A
rticle
Original Article
Accuracy and Repeatability of the Laser Scanner
and Total Station for Crime and Accident Scene
Documentation
A
rticle
David Dustin1 & Eugene Liscio2, P. Eng.
1Dustin Forenics 2ai2-3d
Introduction
Scene documentation or “forensic mapping” has long been in use for crime and accident scenes. The early adoption of the total station in the 1990s was a powerful advance in the area of accident reconstruction since wide expanses of roadways could be documented with greater precision than traditional steel tape or measuring wheels [1]. There is a long history of total station data being used at trial as the foundation of scene drawings and also for different forms of analysis. However, the laser scanner is much more recent and although there are many documented cases where it has been used at trial, the data produced by a
laser scanner (i.e. point cloud) is quite unique since it is visually representative of the object or environment it captures and allows for uses beyond that of a simple scene diagram [2]. Crime scene documentation has benefitted greatly because the use of laser-based instruments allows for non-contact measurement of evidence and allows for measurements to be taken in areas that would be impossible to reach with traditional “tape” tools.
Although there are still many agencies documenting crime and accident scenes using manual methods, the advent of the laser scanner has changed the paradigm for crime
Original Article
The need for quick and versatile scene documentation tools continues to be of great importance at both crime and accident scenes. What was once documented by hand has transitioned to the total station and, most recently, the laser scanner due to its ease of use and capacity to quickly document millions of data points for a more complete documentation of the scene. Both the laser scanner and total station have been accepted in courts all over the world and are in use at police agencies globally. However, few studies, if any, exist that look at the accuracy and repeatability of these laser-based instruments in practice. Therefore, this validation study shows that under controlled conditions for an indoor scene with an expanse of approximately 60 m, the total station exhibited a mean absolute error of 1.1 mm. The laser scanner had similar results using a targeted and targetless registration approach and exhibited mean absolute errors of 1.3 and 1.0 mm, respectively, under the same environmental conditions. All three tests performed for each setup/instrument showed an average stan-dard deviation below 0.5mm. For most crime and accident scene documentation purposes, these results are well within acceptable ranges. Depending on the type of environment, object surface properties, number of scans, distance being measured, choice of setup parameters and other factors, these accuracy values may vary.
Keywords: case management, event segment analysis, contextual bias, bloodstain pattern analysis, crime scene reconstruction, forensic science
Abstract
Received: Revised: Accepted: Published:
Article Information
26 December 2015 13 September 2016 30 September 2016 30 October 2016
Citation: Dustin D, Liscio E. Accuracy and Repeatability of the Laser Scanner and Total Station for Crime and Ac-cident Scene Documentation. J Assoc Crime Scene Reconstr. 2016;20:57-67.
scene documentation. For the better part of two decades, the total station has been a great asset for both indoor and outdoor scenes. However, the introduction of the laser scanner has allowed for an environment to be captured and then visualized virtually. Subsequent analysis such as witness viewpoints, bloodstain pattern analysis, and other types of information can be obtained using data collected by laser scanning, making it an efficient and powerful documentation method. Accuracy and repeatability are of great interest for those operating laser scanners and total stations since it is a question, which can arise when an analysis is presented at court. In many cases, the total station has been used for providing plan drawings and accident scene measurements. For these purposes, errors in the range of a few millimeters do not have any significant impact on overall plan drawings, nor do they affect the result of a speed or distance calculation, especially for vehicles at medium to high rates of travel. However, the need for high accuracy is of greater concern when performing other types of analyses such as bloodstain pattern area of origin, suspect height analysis, or bullet trajectory analysis. In these cases, errors on the order of a few millimeters or a couple of centimeters may have a pronounced effect on the final result. Therefore, it is imperative to understand what the resultant accuracy of a laser-based mapping exercise will yield or at least what should be expected. This study used discrete points of measurement, to determine what a typical laser scanner and total station project should yield in terms of accuracy.
Time of Flight Instruments
Although there may be many proprietary techniques to performing the actual laser-based measurement, the basic method of light detection and ranging (LIDAR) is often categorized using one of two methods. The first method is time of flight (pulse based) while the second is known as phase-based (phase comparison). Time of flight instruments have traditionally been known to be used for longer ranges such as aerial surveying and have also been known to be somewhat slower than phase based instruments [3]. However, these limitations have been improving to the point where both types of instruments (at least for terrestrial uses) are comparable in speed and range.
The basic premise for a time of flight instrument is that a small pulse of light is sent out from the laser scanner and it is timed from the moment when it exits the scanner to when it returns (after hitting a surface and part of the beam is returned to the instrument). Since light travels at a constant speed, the distance from the laser scanner to the surface of the object being measured is [4]:
Where D is the distance travelled to the surface of the object being measures, c is the speed of light (c = 299,792,458 m/s), T is the total time and the division by 2 is to account for the return trip of the pulse.
Phase-Based Instruments
Phase-based instruments work on a similar method emitting one or several sinusoidal signals which, upon return to the scanner exhibit a shift in phase (i.e. the peaks of the waveform shift in relation to the exiting signal). The time is not measured, but calculated through this comparison method between the emitted and return signals. The wavelength of light is usually in the infrared range and each signal is given a specific frequency that can be distinguished upon return. This change in phase is a direct derivative of the distance it has traveled and the time for travel can be calculated using the equation:
Where t is the time, θ is the phase shift and f is the frequency. [4]
Reflectivity and Surface Properties
plastics or metal can cause problems with the laser since they tend to reflect most of the signal away from the scanner [5]. These surfaces can cause problems in that they may detect a surface as a reflection and not the initial surface that the laser encounters. In many cases, there is missing data or noise artifacts which can appear. Laser scanner data which has passed through glass or highly reflective surfaces often have increased errors or artifacts and need to be examined with a critical eye. Therefore, it is important to avoid direct measurements where possible for these types of surfaces. For the determinations of this study, almost all the surfaces in the underground parking lot were of a matte finish and were highly suitable for laser scanning.
Equipment and Methods
The equipment being tested in this study was a Sokkia 530R3 total station [6] and a FARO Focus X330 laser scanner [7]. There are two basic modes on the Sokkia 530R3 total station. One is a targeted EDM (electronic distance meter) mode and requires that an operator place a prism and pole over a location. The laser from the total station hits the prism and is necessary for accurate measurement in this mode. The other mode is a reflectorless mode which does not require a prism and can be used like a laser pointer on most surfaces. In order to avoid errors due to human instability (holding a prism and pole steady) and to avoid fabricating additional brackets for the wall mounted targets, EDM mode was not used in this study since reflectorless mode was much simpler in practice and most similar to the operating theory of the laser scanner. The 530R3 unit has a minimum manufacturer’s stated accuracy in “reflectorless fine” mode as ±3 mm. Additional errors accumulate over the distance measured and are accounted for as 2 parts per million x distance.
The FARO X330 unit has a manufacturer’s stated accuracy of ±2 mm defined as “ranging noise”, a systematic measurement error at around 10 m and 25 m, one sigma. This error value is defined as a standard deviation of values about the best-fit plane for a measurement speed of 122,000 points/s.
Both instruments were compared to a FARO Vantage laser tracker with a point-to-point
accuracy of approximately 0.07 mm over a range of 60 m [8]. In order to avoid issues with interpretation of where a point was measured, special checkered targets were created to avoid having to interpret arbitrary points. These checkered targets were fabricated with a ¼ in (6.13 mm) hole such that a spherically mounted retro-reflector (SMR), required for the laser tracker, could be placed within the center of the checkered pattern, thereby measuring a discrete point. The laser scanner was able to interpret the center of the checkered target in post processing of the data by sampling a large number of points on the checkered target while the total station required a small sticker over the center of the hole in order for the laser to have a reflective surface to return a signal to the total station. An image of the checkered targets is shown in Figure 1.
An underground parking lot at the University of Toronto, Mississauga was chosen as the location for this study (Figure 2). This allowed a testing area of approximately 60 m at the widest point while operating in a controlled environment. A total of 10 checkered targets were spread among the two farthest walls and along a number of pillars while being secured
to avoid any movement during placement and removal of the laser tracker SMR in the center hole (Figure 3).
The laser tracker required a warm up period in order to stabilize the internal workings of the unit. Once this time period had passed, a calibration routine was performed within the area where measurements were to be taken.
Once completed, measurements were taken at each target location by selecting three points on the surface of the checkered target, thereby creating a plane. Subsequently an additional point was measured by inserting the SMR into the center of the checkered targets and a reading was taken by the operator. The measured point at the center of the checkered target was slightly
above the surface and therefore, the center of the checkerboard pattern was calculated by projecting the measured point to the plane formed by the three points. This was a semi-automatic function in the laser tracker software. Once all checkered targets were measured, the results were exported in the form of a csv file, which was subsequently imported to a CAD software program for measurement.
The total station was setup by levelling the tripod and instrument and also by setting up over a known reference point. A backsight was taken which could be checked at the start and end of each trial run to check for any errors. In our case, the backsight errors were 0.000 m. In addition, small circular stickers were placed over the open center holes of each checkered target so that the laser could be reflected back to the unit without having part of the signal entering the center hole (adding erroneous results). However, due to the additional thickness of the paper of approximately 0.020 in (0.5 mm), there was some additional bias introduced into the results. However, since the total station and laser scanner have reported accuracies greater than ±2 mm, it was deemed insignificant for the purposes of this test. Once all targets were measured, a backsight check was done and the entire process was repeated for a total number of 3 trials.
Once complete, the point data was exported as a dxf file and distances could be compared or measured between targets by utilizing a CAD software package.
The laser scanner has two basic methods for combining individual scans into a common coordinate system. The first is a targeted method that relies on spherical or checkered targets while the other relies on the geometry of the environment itself, often referred to as cloud-to-cloud registration. A quantity of twelve 145 mm spherical targets were spread out among the area with the checkered targets and were used for the targeted registration. Although the checkered targets themselves could have been used for registration, it was decided to keep these entirely separate as the primary purpose of the checkered targets was to provide discrete points of measurement for comparison. A total of 7 scans were performed to cover the entire 60 m distance and to capture all the checkered targets with sufficient resolution to allow for distance measurements to be taken. The resolution
setting is a critical variable when determining laser accuracy since it specifies the point density at a specified distance over an object or surface. Resolution can be adjusted depending on the expanse of the environment, number of scans required and also the relative size of the targets. For the test, a resolution setting of one fifth resolution (i.e. one fifth of the full capability of the scanner) resulted in a point spacing of 7.67 mm at 10 m. This relationship is linear, so a surface that is 20 m away would have a point spacing of 15.34 mm.
In order to check repeatability, 3 scans were performed at each scanner position. During the post processing phase, both the targeted and cloud-to-cloud methods of registration could be performed separately in the FARO Scene software. In addition, the checkered targets were identified and manual measurements taken directly in the FARO Scene software.
Results
The data for this validation study is provided below for both accuracy and repeatability of measurements between selected checkerboard targets. The mean result for each set of measurements was used as a comparison to the reference laser tracker results. The absolute error was reported as per the tables below (Tables 1-6).
In addition to the above tests, a single half resolution scan was performed to see if there would be a difference between a non-registered scan that has the ability to obtain a measurement from the two farthest checkerboard targets (i.e. checkerboard targets 1 and 10). At half resolution, the resultant point spacing is 3.068 mm at 10 m. The laser tracker reference measurement was 61.3556 m while the half resolution scan was 61.3541 m. Therefore, the error from a single, high resolution scan was shown to be 0.0015 m. This value was consistent with the result from the registered scans, regardless of which method was chosen.
Checkerboard
Targets Set 1 (m) Set 2 (m) Set 3 (m) DeviationStandard
CB1-to-CB10 61.3547 61.3544 61.3542 0.0003
CB2-to-CB10 44.1837 44.1837 44.1835 0.0001
CB2-to-CB3 10.3358 10.3355 10.3356 0.0002
CB2-to-CB4 8.9041 8.904 8.9043 0.0002
CB2-to-CB5 19.7262 19.7263 19.7264 0.0001
CB2-to-CB6 17.7209 17.7209 17.7208 0.0001
CB2-to-CB7 27.9094 27.9096 27.9095 0.0001
CB2-to-CB8 26.4748 26.475 26.4749 0.0001
CB2-to-CB9 35.3303 35.3302 35.3302 0.0001
CB3-to-CB4 8.6538 8.6538 8.6535 0.0002
CB5-to-CB6 8.5727 8.5726 8.5732 0.0003
CB7-to-CB8 8.5402 8.5404 8.5396 0.0004
Average = 0.0002
Table 1: This table shows the repeatability measurement results for three sets of laser scanner trials. The data was registered using 145 mm spherical targets and shows an average standard deviation of 0.0002 meters.
Checkerboard
Targets Set 1 (m) Set 2 (m) Set 3 (m) DeviationStandard
CB1-to-CB10 61.3540 61.3540 61.3539 0.0001
CB2-to-CB10 44.1826 44.1829 44.1828 0.0002
CB2-to-CB3 10.3356 10.3361 10.3361 0.0003
CB2-to-CB4 8.9040 8.9043 8.9044 0.0002
CB2-to-CB5 19.7257 19.7261 19.7263 0.0003
CB2-to-CB6 17.7202 17.7204 17.7204 0.0001
CB2-to-CB7 27.9091 27.9095 27.9094 0.0002
CB2-to-CB8 26.4740 26.4743 26.4742 0.0002
CB2-to-CB9 35.3291 35.3293 35.3294 0.0002
CB3-to-CB4 8.6538 8.6538 8.6535 0.0002
CB5-to-CB6 8.5727 8.5726 8.5732 0.0003
CB7-to-CB8 8.5402 8.5404 8.5396 0.0004
Average = 0.0002
Checkerboard
Targets Set 1 (m) Set 2 (m) Set 3 (m) DeviationStandard
CB1-to-CB10 61.3502 * 61.3513 0.0008
CB2-to-CB10 44.1807 44.1807 44.1811 0.0002
CB2-to-CB3 10.3345 10.3343 10.3344 0.0001
CB2-to-CB4 8.9029 8.9022 8.9021 0.0004
CB2-to-CB5 19.7243 19.7244 19.7239 0.0003
CB2-to-CB6 17.7179 17.7178 17.7170 0.0005
CB2-to-CB7 27.9083 27.9072 27.9074 0.0006
CB2-to-CB8 26.4727 26.4737 26.4728 0.0006
CB2-to-CB9 35.3280 35.3281 35.3272 0.0005
CB3-to-CB4 8.6546 8.6545 8.6545 0.0001
CB5-to-CB6 8.5718 8.5731 8.5724 0.0007
CB7-to-CB8 8.5398 8.5400 8.5399 0.0001
Average = 0.0004
*Missing measurement
Table 3: This table shows the repeatability measurement results for three sets of total station trials. Note that one measurement was inadvertently missed in trial 2 and the average standard deviation was found to be 0.0004 meters.
Checkerboard Targets Targeted Registration Mean (m) Tracker Reference (m) Absolute Error (m)
CB1-to-CB10 61.3544 61.3556 0.0013
CB2-to-CB10 44.1836 44.1818 0.0018
CB2-to-CB3 10.3356 10.3349 0.0007
CB2-to-CB4 8.9041 8.9031 0.0010
CB2-to-CB5 19.7263 19.7253 0.0010
CB2-to-CB6 17.7209 17.719 0.0019
CB2-to-CB7 27.9095 27.9085 0.0010
CB2-to-CB8 26.4749 26.4728 0.0021
CB2-to-CB9 35.3302 35.3281 0.0021
CB3-to-CB4 8.6537 8.6542 0.0005
CB5-to-CB6 8.5728 8.5722 0.0006
CB7-to-CB8 8.5401 8.5413 0.0012
Average = 0.0013
Checkerboard
Targets Targetless Registration Mean (m) Tracker Reference (m) Absolute Error (m)
CB1-to-CB10 61.3540 61.3556 0.0016
CB2-to-CB10 44.1828 44.1818 0.0010
CB2-to-CB3 10.3359 10.3349 0.0010
CB2-to-CB4 8.9042 8.9031 0.0011
CB2-to-CB5 19.7260 19.7253 0.0007
CB2-to-CB6 17.7203 17.719 0.0013
CB2-to-CB7 27.9093 27.9085 0.0008
CB2-to-CB8 26.4742 26.4728 0.0014
CB2-to-CB9 35.3293 35.3281 0.0012
CB3-to-CB4 8.6537 8.6542 0.0005
CB5-to-CB6 8.5728 8.5722 0.0006
CB7-to-CB8 8.5401 8.5413 0.0012
Average = 0.0010
Table 5: The table below represents the average measurement values between checkerboard targets of all three scan sets and was registered using a targetless approach. Note that the overall average error was 0.0010 meters.
Checkerboard Targets Total Station Mean (m) Tracker Reference (m) Absolute Error (m)
CB1-to-CB10 61.3508 61.3556 0.0048
CB2-to-CB10 44.1808 44.1818 0.0010
CB2-to-CB3 10.3344 10.3349 0.0005
CB2-to-CB4 8.9024 8.9031 0.0007
CB2-to-CB5 19.7242 19.7253 0.0011
CB2-to-CB6 17.7176 17.719 0.0014
CB2-to-CB7 27.9076 27.9085 0.0009
CB2-to-CB8 26.4731 26.4728 0.0003
CB2-to-CB9 35.3278 35.3281 0.0003
CB3-to-CB4 8.6545 8.6542 0.0003
CB5-to-CB6 8.5724 8.5722 0.0002
CB7-to-CB8 8.5399 8.5413 0.0014
Average = 0.0011
checkerboard target 1 and so only two values were used in the mean result instead of three. This measurement was missed by the operator.
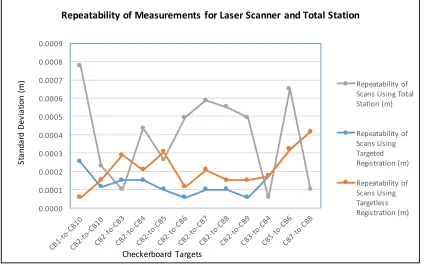
In terms of repeatability, Figure 4 shows how each method performed by taking three measurements for each checkerboard. It can be seen that the total station had the highest standard deviation with one measurement between checkerboard targets one and ten being 0.0008 m. The laser scanner performed similarly regardless of the method chosen. Except for one point which was just over 0.004 m, almost all results were well below 0.0004 m.
Figure 5 shows the results of each method’s accuracy when compared to the laser tracker. Although the total station has one point which is almost 0.005 m off from the laser tracker, the remaining results prove to be quite similar with most of the results at 0.002 m and less.
Discussion
The results obtained in this study show that the total station and laser scanner can have very low errors when measuring to a discrete target under controlled conditions. The area where the tests took place were stable in temperature, void of any wind and on a hard concrete floor which provided a solid and stable setup. The laser scanner was able to perform with similar
error values with targeted, targetless, and even with a single, high resolution scan. However, in practice, evidence does not come with a discrete location and its definition may be difficult to describe. For example, a shattered window or pooled bloodstain may provide an area where evidence is located, but when measured by different people, the interpretation of where it is located and its form may differ slightly from person to person. This is not necessarily a limitation of the instrument, but simply an issue of interpretation of evidence.
In addition, when scanning outdoors, there may be situations where one scanning approach may be more suitable than another. Long, straight stretches of roadway which are void of any vertical structure or very flat and open areas tend not to be the best choice with a targetless solution. In these situations, one would expect that the accumulation of error could be significant and a targeted approach would be preferred.
In this study, the area of the underground parking lot afforded a completely enclosed area with much geometry that was suitable to a targetless registration approach. It is anticipated that this was a contributing factor to why the targetless results were similar to the targeted approach. This is not to say that accurate results
Figure 4: The graph shows the plotted repeatability error values for each set of checkerboard targets. Both registration methods for the laser scanner and total station were shown.
0.0000 0.0001 0.0002 0.0003 0.0004 0.0005 0.0006 0.0007 0.0008 0.0009 Repeatability of Scans Using Total Station (m) Repeatability of Scans Using Targeted Registration (m) Repeatability of Scans Using Targetless Registration (m)
Repeatability of Measurements for Laser Scanner and Total Station
St anda rd De via tio n (m )
by way of targetless registration cannot be obtained in other environments, but it stands to reason that as the geometry in the environment changes from unique to symmetrical or simply planar and void of structure, the registration algorithms have greater difficulty determining how scans fit together due to a lack of uniqueness. For example, if one were to try and register two perfect spheres together, it is impossible since there are no corners or unique features. The same can be said if not enough overlap is obtained between scans or when the environment is changing rapidly from one scan to another since there would be too few features to find any possible alignment. In these cases, a targeted approach may be advantageous.
Other factors, such as the type of surface, also play a role in the accuracy of a laser-based instrument. Dark and glossy, semi-transparent or reflective objects can cause issues with the laser since it is easily reflected, refracted, or absorbed. The underground parking lot where the testing was performed was generally made up of painted white surfaces (on the pillars and ceiling), plus a grey painted floor. Similarly, the checkerboard targets were painted with a flat white coating (excluding the dark checkerboard pattern). These types of surfaces are well suited for the laser scanner.
Conclusions
The results of this study show that it is possible to obtain a high degree of accuracy (approximately 2 mm) and repeatability (below 1 mm) for both the total station and laser scanner in a range of 60 m. For most collision reconstruction, roadway mapping and crime scene scenarios, this level of accuracy is well within the necessary range for measuring the location of evidence, performing speed calculations, momentum analysis, or producing plan drawings. It is expected that as the size of the scene increases and as the number of scans being registered increases, the accumulation of error would also tend to increase. Especially for targets spread far part such that they span across several scans. For scenes up to 100 m or more, results on the order of a few millimeters should be expected when measuring to a discrete location and when scanning in a “well suited” environment.
The test performed with a single high resolution scan, shows that it is possible to obtain good accuracy within the range of our tests and that in some cases (such as where time constraints are a factor), it may be beneficial to perform a single scan, or fewer scans than normal at a higher resolution, in order to maximize efficiency without a loss of accuracy. However, it must be acknowledged that there are many different types of environments which
0.0000 0.0010 0.0020 0.0030 0.0040 0.0050
Erro
r
(m
)
Checkerboard Targets
Targeted Absolute Error (m)
Targetless Absolute Error (m)
Total Station Absolute Error (m)
Laser Scanner and Total Station Errors Compared to the Laser Tracker Reference Values
Copyright: © 2016 David Dustin & Eugene Liscio. Copyright for this article is retained by the authors, with unrestricted publication rights granted to the Association for Crime Scene Reconstruction. This is an Open Access article distributed under the terms of the Creative Commons Attriution-Noncommercial-No Derivatives International License (http://creativecommons.org/licenses/by-nc-nd/4.0/) which permits unrestricted noncommercial use, distribution, and reproduction, provided the original work is properly cited and not changed in any way.
can exist in real-world crime and accident scenes. Thus, variables such as the method of registration, scan settings, targeting method, surface properties of objects, and other items could offer results which vary significantly to those found in this study.
References
1. Boots KE, Salinas J. Fundamentals of Forensic Mapping. Rocklin, CA: Kinetic Energy Press; 2010.
2. IASFM Case Citations [Internet]. Birmingham (AL): International Association of Forensic and Security Metrology; (Cited 2016 Jan 07). Available from: http://www.iafsm.org/citations (membership required for access). 3. RP-Photonics Encyclopedia: Pulses
[Internet]. (Cited 2015 October 14). Available from: https://www.rp-photonics. com/pulses.html
4. Phase Shift Measurement and Time of Flight Measurement, FARO Technology White Paper, April 19, 2012, (Cited 2015 October 14), Available from: http://www. faro.com/en-sg/resource-centre-ap/white-papers (access for registered users only)
5. Hammad Mian S, Abdul Mannan M, Al-Ahmari AM. (2014). The influence of surface topology on the quality of the point cloud data acquired with laser line scanning probe. Sensor Review, 34(3), 255. (Cited 2015 October 16) Available from: http://search.proquest.com/docview/ 1651539183?accountid=14771
6. Sokkia 530R3 total station specification sheet: (Cited 2015 October 14): Available from: https://cdn.auckland.ac.nz/assets/ env/facilities%20and%20resources/ images/Set%20530R%20brochure.pdf, 7. FARO X330 laser scanner specification
sheet: Created: October 10, 2013, (Cited 2015 October 14). Available from: https:// www.reproproducts.com/pdfs/brochures/ faro/x330.pdf