MURDOCH RESEARCH REPOSITORY
http://dx.doi.org/10.1109/ICDSP.2002.1027809
Attikiouzel, Y. and Chandrasekhar, R. (2002) DSP in
mammography. In: 14th International Conference on Digital
Signal Processing, (DSP 2002), 1 - 3 July, Santorini, Greece,
pp. 29-34.
http://researchrepository.murdoch.edu.au/19864/
Copyright © 2002 IEEE
Personal use of this material is permitted. However, permission to reprint/republish
this material for advertising or promotional purposes or for creating new collective
DSP
IN
MAMMOGRAPHY
Y
Attikiouzel and
R Chandrasekhar
Australian Research Centre for Medical Engineering
The University of
Western
Australia
35 Stirling Highway, Crawley, WA 6009, Australia
Abstract: Breast cancer is the most frequently occurring cancer in females with no cure at present. Early detection offers the best chance of survival and mammography is used to screen the asymptomatic female population above fifty years of age. Computerized analysis of mammograms can assist radiologists to detect lesions or abnormalities. However, the entire digitized mammogram must first be segmented and analyzed prior to lesion detection. This paper summarizes work done at the Australian Research Centre for Medical Engineering (ARCME) to systematically and hierarchically segment mammograms as a precursor to lesion detection. The breast is fist segmented from the non-breast background by polynomial modelling and subtraction of the latter region. The nipple, which is the only anatomical landmark, is then located using a sensitive feature set to search the breast border. The pectoral muscle is then identified by an adaptive edge detectiodsurface fitting algorithm. Finally, a systematic methodology is proposed for lesion search.
1. MAMMOGRAMS automatically pays attention to the breast region. The image is then assessed for completeness and quality, i.e., whether it is diagnostically adequate. Thirdly, the ap- pearance of the breast is gauged to characterize it, as shown, for example, in Figure 2.
Mammograms are used in many countries to screen pop- ulations of women above the age of fifty who have no symptoms, to ascertain if they have breast cancer. Detect- ing the disease in its early stages improves patient out- come and quality of life. There is much research effort at present to harness computers to assist radiologists in assessing the vast numbers of mammograms that result from population screening. A standard mammographic examination in Australia involves imaging each compressed breast with X-rays in two views, as illustrated in Figure 1.
Fig. 1. A standard mammographic examination in Australia consists of (a) medioluteral oblique and (b) cruniocuudal views for each breast. These mammograms are from different patients and the letters on the images refer to the following: b: non- breast background; s: skin boundary; n: nipple; g: glandular tissue; f: fat; and p: pectoral muscle (visible only in (a)). Note that the nipple is in profile in image (a) but not in (b). These im- ages have been histogram-equalized to improve visibility and are from two different digital mammogram databases: (a) is image mdb00311 from the MIAS database [I] and (b) is image bxrcc from the UCSFLLNL database [2].
When a radiologist views a mammogram, she or he
fatty fatty-glandular dense-glandular
Fig. 2. Three mammograms of inoreasing radiographic den- sify, or brightness, from left to right. Fatty tissue appears dark on mammograms; glandular and support tissue appears bright. The bright triangle at the top right comer is the pectoral muscle. The breast region, excluding the pectoral muscle, is called the mammographic parenchyma. Mammograms appear more fatty with age.
We are developing an automated system for analyz- ing mammograms following the radiologists’ paradigm: global segmentation, followed by assessment of adequacy, and characterization of appearance. These are important initial steps in a graduated process of successively refined image analysis that logically leads to the detection and characterization of abnormalities, or lesions.
2. HIERARCHICAL SEGMENTATION
Step (n+l)
-I
Segmentation1
4
Attribute1-
Step n
Mammogram -
Fig. 3. Cyclic nature of segmentation and mamniograni- attribute acquisition. An attribute acquired in segmentation step n may be used to drive the segmentation in step (17
+
l), or in subsequent steps. The process would exit after the segmentation has been carried out to the required level of refinement.therefore introduced the nrunzmog7-am-attribute database as a novel tool [3] with which to achieve the goals of seg- mentation, adequacy assessment and appearance charac- terizat ion.
This database will comprise those attributes that have been theoretically suggested or experimentally found to be of greatest value in assisting image segmentation, anal- ysis, adequacy assessment and appearance characteriza- tion.
Image segmentation is considered to be an iterative process that progresses from the gross to the subtle. At any step in the segmentation, salient image attributes are identified, extracted and stored in the database. These at- tributes may be useful in driving the next and subsequent segmentation or analysis steps. This is a cyclic rather than linear process, with the results from one stage feed- ing into the next as suggested in Figure 3.
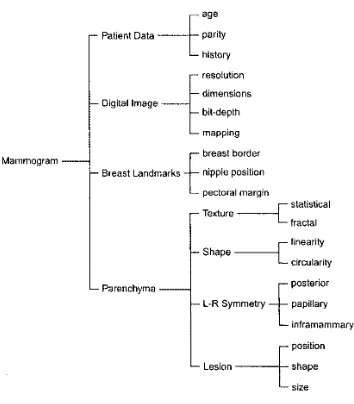
A hierarchy of attributes is proposed as shown in the tree diagram in Figure 4. The listed attributes are those we have found useful, although any particular attribute database will, of course, depend on the approach to seg- mentation and analysis being adopted in that automated system.
The specific steps in the automatic segmentation of mammograms shall be our focus for the remainder of this paper. Nevertheless, the iterative nature of segmentation in the above framework should always be kept in mind.
3. EXTRACTING THE BREAST BORDER
Segmenting breast from background is a form of redun- dancy reduction: once the non-breast pixels are identi- fied, they may be excluded from all subsequent process- ing. facilitating feature extraction as well as saving pro- cessing time. Apart from the overall objective of segmen- tation, the inmediate purpose in extracting the skin-air interface accurately is to provide a suitable input image to a nipple detection algorithm [4]. The requirement to preserve the nipple during segmentation arises from this need. Extracting the breast border is also a prerequisite for bilateral comparison of the left and right breasts. A semi-automatic and fully automatic method for extract- ing the breast border are now summarized.
parity history
1.- resolution
---tage
Patient Data
dimensions bit-depth Digital Image
L mapping breast border
. Breast Landmarks
-E
nipple Positionposterior Parenchyma
inframammary position Lesion shape
size
Fig. 4. Tree diagram of mammogram-attribute hierarchy. These attributes represent some of those we have found useful and are by no incans cxhaustivc. The third layer IS non-spccific in that texture, shape. symmetry and lesion-specific attributcs are indicated but not spelt out in detail.
3.1. Semi-automatic breast border extraction
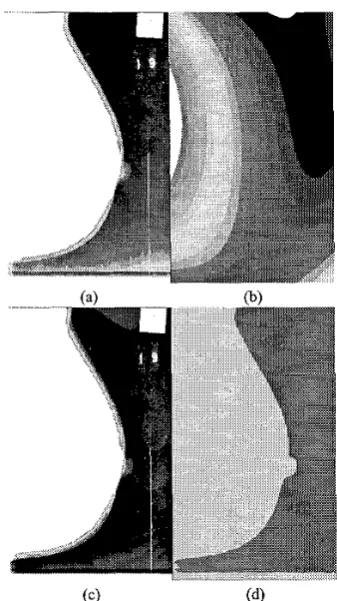
The breast and background on a mammograni form com- plementary, connected sets. Generally, the intensities coni- prising the background are spatially continuous, low in value and lie within a closed interval. The background may therefore be approximated by a poZynoiniu1 in n and y . In the semi-automatic method [ 5 ] , we include the whole background and a small portion of the breast in the region being modelled. The modelled background is subtructed from the original image, the resulting image interactively tliresholtled, and the largest low intensity region taken to be the background. Connected regions are identified, la- belled and merged. The background is flood-filled, and inclusions removed from the object, to yield a breast- background binary image. The method has been tested on 58 mammograms of two views from two digital mam- mogram databases. With one exception, it performs well and yields a skin-air interface with suficient fidelity to preserve a nipple in profile (see Figure 5).
3.2. Automatic breast border extraction
In the automatic method [6], the niainniogram background is again estimated and modelled as a polynoinial in two variables. The modelled image is subtracted from the original, re-thresholded and post-processed to yield a bi- nary labelled image, but completely automatically this time. Depending on the value of a new parameter-the
buckgr-oztnd monochroniuticity-the appropriate degrees
of polynomial and values of difference image thresholds are selected to yield accurate breast border images. The method has been applied to the entire MIAS database of
Fig. 5. Background Subtraction: (a) original image I, with six- teen lowest intensities shown in colour/greyscale and all higher
intensities as white; @) image I,,, of background modelled as a polynomial of degree 3; (c) subtracted image Is; and (d) final segmented binary image
4.
322 images. Thirty-two of these were randomly selected, and evaluated by a radiologist who graded 30 (or 94%) of them acceptable (see Figure 6).
4. LOCATING THE NIPPLE
We have developed a simple, fast and accurate method for automatically locating the nipple on digitized mammo-
grams [4] that have been segmented to reveal the skin-air interface. If the average gradient of the intensity is com- puted in the direction normal to the interface and directed inside the breast, it is found that there is a sudden and dis- tinct change in this parameter close to the nipple. A nip- ple in profile is located between two successive maxima of this parameter; otherwise, it is near the global maxi- mum. Specifically, the nipple is located midway between a successive maximum and minimum of the derivative of the average intensity gradient; these being local tum- ing points for a nipple in profile, and global otherwise. The method has been tested on 24 images, including both oblique and cranio-caudal views, from two digital mam- mogram databases. For 23 of the images (96%), the rms
@>
Fig. 6 . Results of automatic segmentation. (a) Original MIAS mammogram mdb070rl. (b) Segmented breast border superim- posed on original mammogram. Because it is difficult to make out the extent of the original image, both the images (a) and (b) were displayed with enhanced gamma when presented to the radiologist for evaluation on a video terminal. (c) The breast border is superimposed on a histogram-equalized version of the original mammogram. The extent of the breast and the non- uniformity of the background are both apparent.
error was less than 1 mm at image resolutions of 400 and 420 p m per pixel.
Results with a nipple in profile and a nipple not in pro- file are illustrated in Figure 7(a) and @) respectively. In both Figure 7(a) and (b), the normals to the breast border are shown drawn. The average value of the intensity gra- dient along the normal is plotted against they co-ordinate at the left of both figures.
Note the clear dip in the average intensity gradient at y values close to where the nipple is in Figure 7(a). This
behaviour is characteristic of the nipple in profile and re- sults from the normals traversing tissue corresponding to the protruding nipple, which is an almost uniform, low in- tensity region on the mammogram. We have consistently found that for our test images, the nipple position may be estimated reliably and accurately by the mid-point be-
tween the positions of the local maximum and local min-
imum in the derivative of the average intensity gradient. When the nipple is not in profile as in Figure 7(b), the position of the nipple may be grossly estimated by the position of of the maximum of the average. intensity gra- dient. Indeed, in this case, the mid-point of the positions of the derivatives of the global maximum and minimum intensity gradient respectively equals the position of the maximum intensity gradient. We have chosen to use the mid-point of the global maximum and minimum of the derivative of the intensity gradient to locate the nipple because the maximum, being a single value, may or may not be located symmetrically about these rapid changes in intensity gradient.
5. DELINEATING THE PECTORAL EDGE
The pectoral muscle and its edge appear only in medi- olateral oblique view mammograms. It is important as
Fig. 7. Results of nipple location for (a) nipple in profile; and (bj nipple not in profile.
muscle attached to the chest wall can therefore function as a landmark for mammogram-pair registration. It is also useful in determining whether enough of the breast has been imaged, i.e., in determining the adequacy of the mammogram, which can be very useful in image quality assurance. Because lesions arise in the glandular tissue, knowing the pectoral margin also allows restriction of the search space for lesion detection.
Our algorithm [7] consists of two parts: straight line estimation, and cliff detection. Although the pectoral mus- cle edge, or pectoral margin is not necessarily a straight line, it may usefully be modelled as one in a first esti- mate. The second part embodies refinements to more ac- curately reflect the possible non-linear contour of the pec- toral edge. The search for the true edge is now localized to a neighbourhood defined by the initial straight line es- timate, and model-based edge detection and interpolation
Fe used to determine the final edge.
a region-of-interest (ROI) is used to determine the rough extent of the pectoral muscle. A straight line is then fit- ted to the margin of the thresholded region, subject to the caveat that the pectoral muscle does not curve out- ward into the parenchyma. This allows portions of the parenchyma that have been segmented by thresholding to be discarded, and confers robustness to the method. A straight line is then fitted to minimize the square of the error and it is validated independently.
Cliff detection is designed to refine the muscle edge along the straight line estimate, because the actual muscle edge may be slightly curved. Two major components in cliff detection are surface smoothing and edge detection. Surface smoothing is used to remove noise and rough texture on the intensity surface model whereas edge de- tection is used to find the real shape of the muscle edge within a detection range.
There are several methods to smooth the intensity sur- face including mean filtering, Gaussian filtering, poly- nomial fitting and bicubic spline interpolation. Each of these methods was individually tested; it was found that In straight line estimation, iterative thresholding within
mean filtering followed by bicubic spline interpolation was most useful for our purpose. Cliff detection assumes a sigmoidal intensity pattem as the intensity surface slopes down at the pectoral margin. Cliff detection has two ad- vantages: intensity rises are ignored and only intensity drops are detected; and by virtue of the fitted model, cliff detection is more robust to noise and bright spots on the image and therefore gives fewer scattered or broken edges.
Results are promising (approximately 94% of images were considered acceptably segmented in a preliminary evaluation) and the spectrum of results is illustrated in Figure 8. In those images where the pectoral muscle is clear and separated from glandular tissues, the resulting curves are very accurate, e.g. (a) and (b). The algorithm is not affected by tapes, as shown in (a), (c) and (d), be- cause the search paths at the top are horizontal. It is also robust to artifacts as shown in (b). In (c), the lower half of the pectoral edge is obscured by other tissues, caus- ing uncertainty in the edge detection. Although the ex- act muscle edge could not be detected, the straight line estimate was followed, and the final result was accept- able. Note that in this image, there is a strong intemal edge inside the pectoral region. It is the same for (d), but the line was fitted to the internal muscle edge in the lat- ter case. The line fitting decision depends on the binary image produced by iterative thresholding. The pectoral muscle in (e) is quite curved, vertically directed in parts, and mostly indistinct, resulting in a poor segmentation. The results are even worse for (f), which is a particularly difficult image.
( 4 ( e ) (f)
Fig. 8. Results of pectoral margin delineation. Images (a) to (cj are acceptable; (d) to (f) are not.
6. SYSTEMATIC LESION SEARCH
Computerized searches must be systematic, complete and repeatable. Raster scan order (left to right, top to bottom) is a favourite automatic search pattem for images. With a mammogram, however, medical practice and anatomy provide compelling reasons for adopting a different but specific search scheme [ 8 ] .
It is unlikely that a lesion (except for enlarged lymph nodes) will be found in the region associated with the pectoral muscle. The pectoral muscle is therefore ex- cluded from the lesion search as shown in Figure 1 O(a), but care should be taken not to miss a lesion close to the chest wall. By the same token the fibroglandular region must be searched thoroughly because this is where breast cancers originate.
6.1. Paired comparison
The radiologists Tab& and Dean [9] have devised a method for systematically searching for lesions that was origi- nally intended for human experts but that is eminently suited for computerization. It relies on comparing COY-
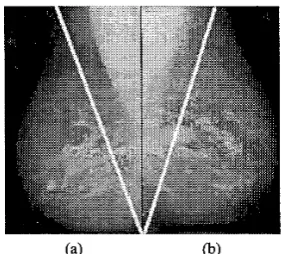
responding regions of the left and right breast mammo- grams to detect significant differences that could be le- sions. Its primary strength is that it is a relative rather than absolute method and thus factors out natural vari- ability in appearance, which when present, affects both mammograms in a pair in the same way. An example of the Tabar-Dean method is shown in Figure 9.
Fig. 9. Oblique masking for systematically viewing mammo- grams according to TabL and Dean [9]. The images in (a) and (b) are the right and left mammograms from the same patient (MIAS images mdb026rl and mdb02511). The regions between the bright pectoral muscle and the slanted arms of the “V” are compared for each side; regions not enclosed by the two arms are blocked out when viewed by the human expert.
6.2. Nipple-anchored linear search
The glandular system of ducts in the breast drains into the nipple, which is also its only anatomical landmark. The logical, anatomically-founded search direction is there- fore to start at the nipple and fan outward into the breast, excluding the pectoral muscle if it appears on the mam- mogram. This is illustrated in Figure 10 where the lines represent the search directions and also, to a lesser extent, the preferred direction of the curvilinear structures on the breast. Any disturbance in the orientation of the curvilin- ear structures with respect to the search directions may signal a lesion [lo]. Incidentally, locating the position of the nipple [4] is a pre-requisite for this search strategy.
Nipple
Fig. 10. Systematically searching for lesions using the nipple as the starting point and fanning into the breast is anatomically well founded. (a) On mediolateral oblique views, the pectoral muscle is excluded from the search. (b) On craniocaudal views the search strategy is similar, but the pectoral muscle is gener- ally absent.
7. CONCLUSIONS
The methods of digital signal processing in general, and image processing in particular, may be applied with con- siderable success in automatically segmenting a mam- mogram to extract the breast border, locate the nipple, delineate the pectoral margin and thereby set the stage for paired mammogram comparison and systematic le- sion search and detection.
Simple techniques may be employed to this end pro- vided the features driving the segmentation are selected to be sensitive and specific to the task. This has been il- lustrated specifically with the nipple location algorithm. Moreover, the anatomy of the breast may be exploited to advantage to underpin robust and accurate algorithms, as has been illustrated with the breast border extraction and pectoral edge delineation.
By understanding clearly what radiologists do, why, and how, it is possible for engineers to design automatic systems that robustly and accurately replicate what the human expert does.
Acknowledgements
REFERENCES
J. Suckling, J. Parker, D. R. Dance. and S. A. et al., “The Mammographic Image Analysis Society Dig- ital Mammogram Database,” in Digital Mammog-
raphy (A. G. Gale, S. M. Astley, D. R. Dance, and
A. Y. Cairns, eds.); (Amsterdam, The Netherlands), pp. 375-378, Elsevier Science, 1994.
University of California, San Francisco and Lawrence Livermore National Laboratory, (UCSFILLNL), “UCSFLLNL High Resolu- tion Digital Mammogram Library.” Available from Ms Christine Skillem, Lawrence Liv- ermore National Laboratory, P. 0. Box 808, L-452, Livermore, CA 94551, USA; e-mail: c m a m m o - db- helps1 In1
.
g o n , 1996.R. Chandrasekhar and Y. Attikiouzel, “Mammogram-attribute database: A tool for mammogram segmentation and analysis,” in
Proceedings of’ the IASTED International Conjer-
ence: Signal Processing, Pattern Recognition. and Applications (SPPRA), July 3-6, 2001, Rhodes,
Greece (M. H. Hamza, ed.), (Calgary, Canada),
pp. 143-148, ACTA Press, 2001.
R. Chandraseuiar and Y. Attikiouzel, “A Sim- ple Method for Automatically Locating the Nipple on Mammograms,” IEEE Transactions on Medical Imaging, vol. 16, pp. 483494, Oct. 1997.
R. Chandrasekhar and Y . Attikiouzel, “Gross Seg- mentation of Maninlograms using a Polynomial Model,” in Bridging DiscQlines .for Biomedicine: Proceedings cfthe 18th Annual International Con-
ference, IEEE Engineering in Medicine and Biol-
ogy Society. October 31-November 3, 1996, Ams-
terdam, The Netherlands, pp. 1056-1058, Amster-
dam, The Netherlands: IEEE, Oct. 1997.
R. Chandrasekhar and Y. Attikiouzel, “Automatic breast border segmentation by background model- ing and subtraction,” in IWDM 2000: 5th Interna-
tional FVorkshop on Digital Mamniography (M. J.
Yaffe, ed.), pp. 560-565, Madison, WI, USA: Med- ical Physics Publishing, 200 1. Proceedings of the Workshop, June 11-14,2000, Toronto, Canada.
S. M. Kwok, R. Chandrasekhar, and Y. Attikiouzel, “Automatic pectoral muscle segmentation on mam- mograms by straight line estimation and cliff detec- tion,” in ANZIIS 2001: Proceedings of the Seventh Australian and New Zealand Intelligent Injormation Systems Conference, (Perth, Australia), pp. 67-72, ARCME, The University of Westem Australia, Nov. 2001.
R. Chandrasekhar and Y. Attikiouzel, “An expert system schema for lesion search and detection on digitized mammograms,” in NNESMED 2001: Pro- ceedings qfthe Fourth International Conference on
Neural Ne/works and Expert Systems in Medicine
and Heulthcare (G. M. Papadourakis, ed.), pp. 158-
162, Technological Educational lnstitute of Crete, Crete. Greece, 2001.
[9] L. ‘Iabar and P. B. Dean, Teaching Atlas ofMam-
mography. New York: Thieme-Stratton, second re-
vised ed., 1985.
[lo] W. Philip Kegelmeyer Jr, J. M. Pruneda, P. D. Bourland, A. Hillis, M. !A7. Riggs, and M. L. Nip- per, “Computer-aided Mammographic Screening for Spiculated Lesions,” Radiology, vol. 19 1, no. 2, pp. 331-337, 1994.