FURGIIINA by Me u. S. Clo parbriret •74
• Far Official
us.
Development and Evaluation of Evapotranspiration Muueis
for Irrigation Scheduling
James L. Wright, Marvin E. Jensen
FELLOW ASAE
ABSTRACT
VAPOTRANSPIRATION (ET) data for irri-1.7.1 gated crops in southern Idaho were used to de-velop relationships for estimating net radiation and potential ET for the USDA-ARS Computerized Irri-gation Scheduling Program. ET estimated with the initial relationships compared well with recent mea-surements obtained with two sensitive weighing lysim-eters. The:average daily measured Et for alfalfa for 128 days when there was full cover was 7.23 mm, while the average daily estimated ET was 7.15 mm.
Crop curve relationships were developed from the ET results for snap beans (Phaseolus vulgaris L). The depletion of soil water was predicted for two years of irrigated beans with the scheduling program using the improved crop curves and compared with the mea-sured as a test of its performance. The standard devia-tion of the difference between predicted and measured was about 0.95 mm/day from planting until harvest. The results also demonstrated the importance of ob-taining -representative meteorological data for irrigation scheduling.
INTRODUCTION
Several years of daily evapotranspiration (ET) data for irrigated crops, obtained with two precision weigh-ing lysimeters, and meteorological and energy balance data were used to develop and evaluate an ET model for irrigation scheduling. The model first estimates maximum or potential ET (E tp) for a reference crop as a function of meteorological conditions. Then the model estimates daily ET for a given crop according to stage of growth with a crop curve function that relates ET to Etp. The model adjustes for increased evaporation when the soil surface is moist.
ET is a primary component of the water balance of a cropped field. Water depleted from the soil by ET must be replenished in arid regions by irrigation for successful crop production. Direct measurement of ET
is difficult and costly; therefore the objective of the
research program of which this study was a part is to develop models to estimate ET from more easily
ob-Article was submitted for publication in February 1977; reviewed and approved for publication_ by the Soil and Water Division of ASAE in May 1977. Contribution from the Western Region, Agri-cultural Research Service. U.S. Department of Agriculture. Uni-versity of Idaho College of Agriculture Research and Extension Center. Kimberly, cooperating. Presented as ASAE Paper No. 76-2063.
The authors are: LAMES L. WRIGHT, Soil Scientist and MARVIN E. JENSEN, Agricultural Engineer, Snake River Conservation Re-search Center, Kimberly, ID.
Agiammisdpossto Appreciation is expressed for technical
assis-tance to 4amen E. Chapman -and John L. Stevens, who greatly as-sisted in the collection and analysis tit data.
tamabledata.
A computerized irrigation scheduling program de-veloped by Jensen, Wright, and Pratt (1971), com-monly referred to as the USDA-ARS Irrigation Schedul-ing Program, provides estimates of the timSchedul-ing and amount of irrigation water needed using weather data and relatively simple data on the crop and soil situation. With this program, a reference potential ET is com-puted with a modified Penman (1963) combination equation described by Wright and Jensen (1972), who used lysimeter and energy balance data to adjust the coefficients of the aerodynamic term for arid irrigated areas. Crop curves used in the original scheduling program were based upon available consumptive use data, most of which were obtained with gravimetric soil sampling procedures over many years. The irri-gation scheduling program with its applications has been summarized, along with supporting information on the consumptive use of water and irrigation water requirements (Jensen, 1974). The original program used the best procedures available at the time and satisfied many of the needs for irrigation scheduling. It was fully anticipated that improvements would be added as needs changed and further developments became available.
The ET-estimating procedures were evaluated in this study using recent measurements obtained with two weighing lysimeters. The present larger data base of accurate ET measurements permits developing improved crop curves. An improved crop curve for beans (Phaseolus vuigaris L (cultivar slimgreen)) is discussed. This curve should improve the accuracy of the scheduling program in predicting depletion of soil water by most irrigated snap and dry edible bean crops.
PROCEDURES
Daily ET measurements have been obtained with a precision lysimeter at Kimberly, ID since 1968. In 1971, a second lysimeter was installed in an adjacent field. This permitted the -.simultaneous measurement and comparison of ET from two crops, with one serving as a reference to the other. These lysimeters, similar to those described by Ritchie and Burnett (1968), are 1.83 m -square by 1.22 m deep. At installation, the soil was excavated and placed in the lysimeters by soil layers and packed to the original bulk density. Each lysimeter is supported on a mechanical floor stand scale with a counter balance. The net weight, representing essentially the water content of the soil, is sensed with an electronic load cell. Weight differ-ences provide a direct measure of ET with an accuracy better than 0.1 mm/day. -Each lysimeter is installed in a field of approximately 2.8 ha to provide adequate fetch. Alfalfa was used as the reference crop for
mum or reference potential ET because it is widely grown in irrigated areas. develops crop cover early, and has an extensive root system that minimizes the effects of decreasing soil water on ET. It also provides a dense crop cover with a high stomatal conductance which results in relatively high rates of ET under arid conditions, except for a period after each cutting.
Estimation of Reference ET
Equations and procedures as modified by Wright and Jensen (1972) were used in this study to estimate maximum daily or potential ET. Etp, for a well-watered reference crop of alfalfa with 20 cm or more of top
growth. The modified combination equation is:
E* = (Rn - G) - 15.36 (0,75 + °Alias 7 u) z - ed
q+ q+ry
[1]
where E* is the estimated daily evaporative flux, Rn is net radiation (estimated from solar radiation) and G is soil heat flux in cal/cm 2.day; u is windspeed at 3.66 m (12 ft) in km/day; eoz is the mean saturation vapor pressure in mb at maximum and minimum air temper-ature and ez is the saturation vapor pressure in mb based on the 0800-hr dewpoint temperature; and A and y are the slope of the saturation vapor pressure-temperature curve and the psychrometric constant in Iraq° C. The coefficients in the wind term (0.75 +
0.0106 u) were developed for the 3.66-m U.S. Weather Service anemometer at Kimberly. The equivalent term for a 2-m anemometer is (0.75 + 0.0115 u). Etp = E*/ 58.5 in mm/day. Meteorological data from the U.S. Weather Service station at the Snake River Conser-vation Research Center, Kimberly, ID, were used to compute Etp for this study because these data are
normally available to users of the scheduling program. Rn was estimated from solar radiation measurements, and G from changes in daily air temperature using the procedures of Wright and Jensen (1972).
The crop coefficient as used in the USDA-ARS
Irrigation Scheduling Program is a dimensionless
proportionality coefficient relating daily crop ET to Etp :
Et - Ke Etp [2]
where Et is the ET for a particular crop at a given growth stage and surface soil moisture condition, and Kc is the overall crop coefficient.
Ke is estimated with procedures described by Jensen, Wright, and Pratt (1971), from information on the wetness of the surface soil and availability of soil water by:
Ke Kee. Ka + Ke [3]
where Keg is a mean crop coefficient derived from ex-perimental data where soil moisture is not limiting,
or transpiration. i.e., Kc = Kco with Ka = 1 and K5 = 0. In the evaluation of the accuracy of the schedul-ing program to estimate daily ET and soil water deple-tion. Kc was calculated manually by equation [3]
just as the scheduling program would do using the newly derived crop curve for beans and adjusting for surface soil wetness.
Daily ET measurements for alfalfa and beans ob-tained with the lysimeters were used to evaluate the accuracy of the calculated Etp and estimated daily ET.
RESULTS AND DISCUSSION
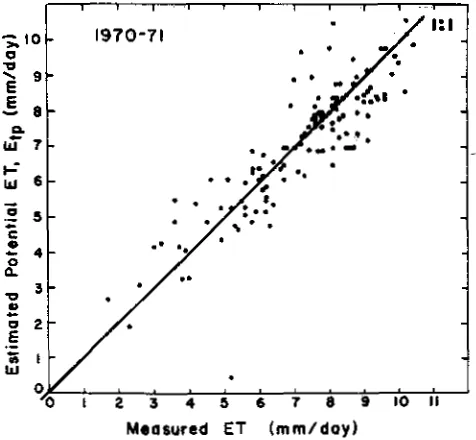
Alfalfa ET data from lysimeter No. 1 in 1968 and 1969 were used by Wright and Jensen (1972) to calcu-late the coefficients for the wind term as given in equa-tion [1]. In the present study, daily Eto calculated with these coefficients was compared with the measured ET with the same lysimeter in 1970 and 1971 for alfalfa with full cover, as shown in Fig. 1. The average measured ET for the 128 days shown was 7.23 mm/day, compared with an average calculated Etp of 7.15 mm/ day. The standard deviation of the diffirence between the measured and estimated values for this period was 0.84 mm/day, which is considered to be quite good. The nature of the difference between the measured and estimated values is further discussed by Jensen and Wright (1976).
In contrast, ET for alfalfa measured in 1973 and 1974 with lysimeter No. 2 averaged about 1 mm/day less than calculated Etp. For 79 days of observation when there was full cover, measured alfalfa ET averaged 7.02 mm/day, compared with an average calculated Etp of 8.13 mm/day. However, the standard deviation of the difference between the measured and calculated daily values was 0.80 mm/day, which is very similar to that for 1970-71. The average measured alfalfa ET was only 0.21 mm lower (2.9 percent), and the average calculated Etp was 0.98 mm higher (13.7 per-cent) in 1973-74 than in 1970-71. The lower alfalfa
a a.
2 3 4 5 6 7 8 9 1q II
Measured ET (mm/day)
FIG. 1 Estimated potential daily ET calculated with equation 1, which is a modified Penman equation TWA& and lemon, 19721, compared with ET immured with a weighing lyelmeier for a well-watered crop of alfalfa with full cover at Kimberly, ID.
Ka is a coefficient whose value is relative to the avail- ,E able soil moisture, and Ks is a coefficient to adjust it for the increased evaporation occurring when the soil surface is partially or completely wetted by irrigation or rains.
.00
20 40 1
PCT -P towing\ enes
9
9
9
9 3L.
.4
3 2
60 80
Full Cover) • KIMBERLY, IDAHO
0 Ben order a 3r4 order
20 40 DT
1.14WVOlif 60
ET in 1973.74 was probably partly due to differences
in the nature of the alfalfa plantings. The alfalfa on the lysimeter No. 2 field had smaller leaves, finer stems, and tended to lodge more easily during strong winds or thundershowers than did the earlier crop on lysimeter No. 1. The larger difference between the two sets of data, however, was due mainly to the much higher values of Etp calculated for 1970-71.
Preliminary analysis of the data indicates that this may have been partly due to yearly changes in the crops grown surrounding the Weather Service instru-ment plot. When short-season crops. such as grains and peas, are grown around the plot, temperatures and windspeeds are higher and humidity is lower at the measurement site during July and August than when crops such as sugarbeets, potatoes, or corn are raised nearby. The tentative correlation of conditions must be verified. but these results do demonstrate the importance of standard fetch around measurement sites where data are to be used for irrigation schedul-ing.
The greatest differences between measured and estimated ET tended to occur during cool and wet periods, especially if accompanied with high wind-speeds. The combination equation as presently used does not adequately account for these conditions.
Development of Crop Curves
During 1973 and 1974, crops of furrow-irrigated snap beans were grown at the lysimeter No. 1 site for seed, while alfalfa was grown at the lysimeter No. 2 site. The daily Etp calculated for this period with the
appropriate data from the U.S. Weather Service site were used with measured Et to calculate Ke. Daily values of K. ET/Etp, are presented in Fig. 2 for 1974, as an example. -These data differ from a mean
crop coefficient curve in that they include days with high evaporation from a wet soil surface. Data for 1973 and 1974 were used to develop a mean crop coeffi-cient curve for beans, as shown in Fig. 3, where IQ is a
function of time during the growing season, with the
lllllllll
8 EANS, 1974 -
LI
IA
w
0
4
cc
fr
MAY
I
16
1 1
it, h .t
JUNE JULY AUG L
FIG. 2 Lytdmeter-measured ET for furrow-lerigated snap beans raised for seed as a fraction of estimated potential ET [Eicti:b:rriltlty irrigations (large arrows] and rains (small arrows} as shown,
ID.
time from planting until full cover on a percentage basis (PCT), and time after full cover (DT) as elapsed days. Percentage of time is used during crop devel-opment because large difference in planting dates usually have little effect on the date full cover is reached. Effective full cover occurred about July 15 each year, or about 52 days after planting and 46 days after emergence.
The "new" curve presented in Fig. 3 essentially represents conditions when the soil surface appears dry. The considerable difference between this and the "previous" curve initially used in the irrigation schedul-ing program results because earlier procedures gave lower estimates of Etp. The earlier ET for snap beans was calculated from soil sampling data obtained under conditions in which some deep percolation was possible and probably also included a higher compo-nent of soil evaporation from wet or partially wet surfaces. The new curve effectively reduces the esti-mated ET during bean leaf area development. This change should be quite beneficial, inasmuch as ser-vice groups using irrigation scheduling procedures have found that use of the previous curve along with estimates of potential ET obtained with the modified Penman equation resulted in overestimating ET. The curve was developed for a medium season, medium bush bean plant representative of a large portion of the bean crops and is applicable to other similar climatic and geographic areas.
Service groups can use some key growth points to adjust crop development to the new curve. The beans emerged about 10 days after planting at PCT = 20. The crop coefficient Kc began increasing rapidly along with leaf expansion at about the time the first trifoliates developed, or 15 days after emergence at PCT = 44 and Kc = 0.2. Bloom began about 34 days after emergence, when cover appeared to be about 50 percent (PCT = 80 and IQ = 0.55). The rows began closing about 42 days after emergence (PCT = 95 and Kc = 0.95). Full cover was reached shortly thereafter, although measured leaf area continued to increase for another 2 wks.
A polynomial regression equation was fitted to the
5 6 7 9 1 10 0 2 4 Measured ET (rnm/dayl
0
10 10 . 20 10 -4O 50 GO 70 90 90 100140
5/20 E
14 • Eetilmeted
190 16O 170 IGO IGO 200 210 220 230 240 5/21
I
Day of Year
BEANS, 1973
SEMIS, 1974
\\\
—imeaters0
• Estimated
ISO 160 170' 410 140 200
Day of Year 2110 220 258 idlesits
-140 6120
new crop coefficient curve for use in the irrigation scheduling program. Third-order polynomial equa-tions were developed for the two periods from plant-ing to full cover and from full cover to harvest, as has been done previously. Also, a single regression equa-tion was developed representing the entire period from planting until harvest. The coefficients for these equations are given in Table 1 for the general form of the polynomial regression equation:
Y + c2 x + c3 x2+ Cn X(4-1) [41
where Y is the crop coefficient (Kco of equation (3)), and X is the time base PCT or DT. In the development of these coefficients, it generally was easier to fit the curve for the period approaching full cover with a single sixth-order equation, with X = PCT or DT, depending on the period. The seven coefficients cover the entire period from planting to harvest. Points for the polynomial regression equations are shown relative to the crop curve in Fig. 3.
Evaluation of Crop Coefficients
To evaluate the ET model. we used the new crop curve and adjusted the coefficients for surface soil wetness with the procedures of the model. ET for beans was calculated with the adjusted crop coefficients, and Etp as calculated from the U.S. Weather Service
meteorological data.
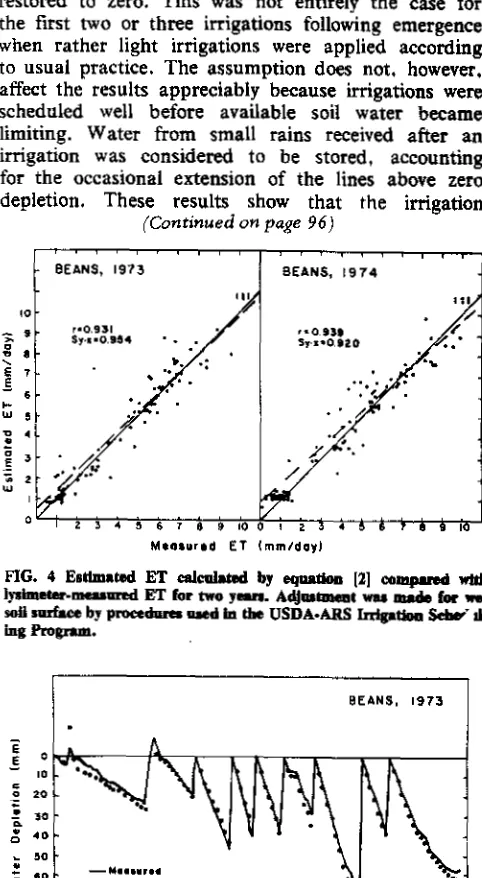
The measured and estimated values are compared in Fig. 4. The standard deviation of the difference between the measured and estimated values was 0.95 mm/day in 1973, and 0.92 mm/day in 1974, from planting about May 20 until harvest at the end of August (103 days). The standard deviation of the difference between measured and estimated ET is essentially as good as that for the estimates of Etp. Un-fortunately, this is not an independent validation, since the same data used in developing the curve were used in the comparison. However, the adjust-ments according to surface wetness are based on in-dependent data and the generalized crop curve was used independently for each of the years 1973 and 1974.
As an evaluation of the complete irrigation schedul-ing procedure, the measured and estimated depletion of soil water were compared for the 1973-74 bean crops, see Figs. 5 and 6. Depletion data shown are the accumulated daily measured and estimated ET of Fig. 4 for the periods between irrigations. It was
as-TABLE I. COEFFICIENTS FOR POLYNOMIAL EQUATIONS FOR BEAN CROP CURVE WHERE Ke IS COMPUTED AS A FUNCTION OF PERCENT OF TIME FROM PLANTING TO
FULL COVER, PCT, AND OF ELAPSED DAYS THEREAFTER, DT
Third-order equation:
C 1 = 0.12369 C 4 = -6.2665E-07
C I - 0.9800
C4 = 2.5268E-06
Sixth-order equation: C1 = 0.096444
C4 = -6.2520E-07
C7 = 3.1655E-12
sumed that at each irrigation soil water depletion was restored to zero. This was not entirely the case for the first two or three irrigations following emergence when rather light irrigations were applied according to usual practice. The assumption does not, however, affect the results appreciably because irrigations were scheduled well before available soil water became limiting. Water from small rains received after an irrigation was considered to be stored, accounting for the occasional extension of the lines above zero depletion. These results show that the irrigation
(Continued on page 96)
FIG. 4 Estimated ET calculated by equation 12] compared with lysigneter.measured ET for two yews. Adjustment was made for wet
soil surface by procedures used in the USDA•ARS Irrigation Sehe big Program.
FIG. 5 Cumulative soil water depletion calculated from messaged and
estimated daily ET for furrow-irrigated beans, Kimberly, ID.
FIG. 6 Cumulative soil water depletion calculated from messaged and estimated daily ET for furrow-irrigated beans, Kimberly, ID.
0
Before effective cover, X = PCT E 10
C2.= -6.0670E-03 C 3 - 2.1103E-04 0 20
.
1; 0
30 40
After effective cover, X = DT 50
C2 = 6.3783E-03 C3 - -6.0186E-04 60
70 90
Entire period. X = PCT or DT (f) 90
Evapotranspiration Models for Irrigation
(Continued from page 91)
scheduling procedure with the new IQ curve ade-quately estimates soil water depletion between irriga-tions, especially during the main part of the season when there is active plant growth and full plant cover. Some problems remain in estimating evaporation from bare soil early and late in the season, as shown by the deviation between the estimated and measured values during those times.
CONCLUSIONS
Results of this study confirmed the earlier evalu-ation of the USDA-ARS Irrigevalu-ation Scheduling Program and showed that the expected errors in estimating potential ET are well within acceptable limits. The improved crop coefficient curve for snap beans greatly improved the evapotranspiration estimates for snap beans; the expected error in estimating daily ET is 3.bout the same as that in estimating the potential or reference daily ET. As more information and ex-perience are obtained on the water requirements of irrigated crops, improvements and greater capability can be incorporated into these procedures, but for the present they are generally more than sufficient to meet the capability of irrigation systems to apply specified quantities of water. The combination
equa-tion, which is a convenient way of estimating evapo-transpiration for crops with full cover, tends to over-estimate potential ET when the season is cool and wet, and refinements are still needed in estimating the soil evaporation component when there is only partial cover. Work is continuing to provide improvements in these areas and to develop crop coefficients for other crops.
References
1 Jensen, M. E. led). 1974. Consumptive use of water and irri-gation water requirements. A report prepared by the Tech. Comm. on Irrigation Water Requirements, Irrig. Drain. Div., Am. Soc. Civ. Eng.. 215 p.
2 Jensen. M. E. and J. L. Wright. 1976. The role of simulation models in irrigation scheduling. ASAE Paper No. 76-2061, ASAE. St. Joseph. MI 49085.
3 Jensen, M. E., J. L. Wright, and B. J. Pratt. 1971. Estimating soil moisture depletion from climate, crop and soil data. TRANS-ACTIONS of the ASAE 14:954-959.
4 Penman, .1. L. 1963. Vegetation and hydrololgy. Tech. Comm. No. 53, Commonwealth Bureau of Soils, Harpenden, England. 125 p. 5 Ritchie. Joe T.. and Earl Burnett. 1968. A precision weighing lysimeter for row crop water use studies. Agron. J. 60:545-549.