A b s t r a c t.Tillage-induced changes in pore-size distribution and aggregate stability of two soils were investigated for 7 con-secutive years from 1994 to 2000. The three tillage treatments were used: conventional tillage with mouldboard plough (CT), ploughless tillage with cultivator (PL) and direct drilling (DD). The experiments were conducted on loam soil (Eutric Cambisol) derived from boulder clay and silt loam soil (Haplic Luvisol) derived from loess. Soil samples were collected at depths of 0-10 and 10-20 cm. Pore size distribution was calculated from the water retention curve. Water stability of aggregates (10-5, 5-1 and <1 mm) was determined by wet sieving method. Macroporosity (>20mm) at a depth of 0-10 cm, varying initially from 0.035 to 0.062 m3m-3, increased during seven years substantially in both the loam (from 1.7 in DD to 3.6 times in CT) and the silt loam (from 1.3 in CT to 3.4 times in PL and DD). The increase for the depth of 10-20 cm was relatively greater in silt loam (from 1.7 in PL to 2.8 times in DD) as compared with loam (from 1.3 in DD to 2.1 times in PL). During the first four years of the experiment, the contribution of mesopores (0.2-20mm) decreased in all treatments to higher extent in loam than in silt loam. Temporal changes in microporosity (<0.2mm) were much smaller than for other size classes of pores. The differences between the treatments were more pronounced for the 0-10 cm than for the 10-20 cm depth. Irrespective of the treatments, the aggregates of 10-5 and 5-1 mm were more stable in the loam than in the silt loam soil. Improved water stability of aggregates of 10-5 and 5-1 mm under PL and DD suggest that the tillage systems are sustainable in soils conducive to soil erosion.
K e y w o r d s: tillage systems, bulk density; pore size distribution, aggregate stability
INTRODUCTION
Many researchers have reported that a reduction in tillage intensity leads to increased soil organic matter (SOM) and to accumulation of crop residue (Lalet al., 1994; Reicosky et al., 1995). Higher concentrations of organic
matter under conservation tillage result in better aggregation and larger macroporosity (Karlenet al., 1994; Mc Garryet al., 2000), and in a greater number of continuous and interconnected pores (Mc Garryet al., 2000; Wiermann and Horn, 2000). Variation in pore characteristics is an important factor affecting water storage and infiltration (Kay and VandenBygaart, 2002; Witkowska-Walczaket al., 2003) and thereby runoff, soil erosion (Franzluebbers, 2002; Tebrügge and Düring, 1999), nutrient losses, and water pollution (Lipiec and Stêpniewski, 1995). Responses of the soil physical characteristics to tillage systems are significantly affected by soil type and climate conditions (Schjønning and Rasmussen, 2000).
Some studies conducted in Poland (Malickiet al., 1997) have shown that reduced tillage can produce crop yields comparable to those obtained under conventional tillage (using mouldboard plough) at lower production costs and greater production efficiency. However, until now, little detailed research has been carried out on long-term effects of alternative tillage systems on soil physical conditions affecting soil quality and erosion. Most erodible soils are situated in the belt of silt loam derived from loess with weak aggregate structure, disintegration of which leads to the formation of crusts or seals (Rejman et al., 1994). Implementation of ploughless tillage systems on rendzina soils in Poland improved transmission properties as defined by air permeability and increased storage of water (Podstawka-Chmielewska et al., 2001; Pranagal and Dom¿a³, 2001). The studies indicated that from the view point of soil physical properties plough-based systems could be replaced by ploughless tillage.
Our objective was to evaluate trends of pore size distribution and aggregate stability over 7 years under two ploughless tillage systems compared with a conventional
Int. Agrophysics, 2005, 19, 165-174
Changes in pore size distribution and aggregate stability of two soils under long term tillage systems
J. Pranagal
1*, J. Lipiec
2, and H. Dom¿a³
11Institute of Soil Science and Environment Management, University of Agriculture, Leszczyñskego 7, 20-069 Lublin, Poland 2
Institute of Agrophysics, Polish Academy of Sciences, Doœwiadczalna 4, P.O. Box 201, 20-290 Lublin 27, Poland
Received March 23, 2004; accepted May 11, 2004
© 2005 Institute of Agrophysics, Polish Academy of Sciences
*Corresponding author’s e-mail: [email protected]
I
I
INNNTTTEEERRRNNNAATATTIIIOOONNNAAALLL A
A
Agggrrroooppphhyhyysssiiicccsss
w
w
loam soil (Haplic Luvisol). Long-term responses of the properties are essential for assessing the sustainability of these tillage methods.
MATERIALS AND METHODS
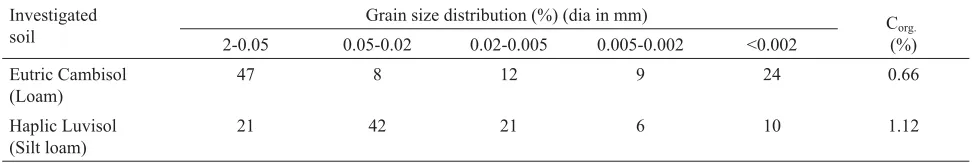
The seven-year investigations were carried out from 1994 to 2000. The experimental fields were located on a loam soil developed from boulder clay (Tomaszkowo, Olsztyn Lake District, 53°43’N; 20°25’N) and on a silt loam soil derived from loess (Czes³awice, Lublin Upland, 51°19’N; 22°16’E). Some characteristics of the soils are given in
Table 1.
Treatments established in a randomized block design with four replications are presented below.
Conventional tillage (CT):
- stubble cultivator (10 cm) + heavy harrow, - mouldboard ploughing (18-20 cm) + harrowing, - sowing + harrowing.
Ploughless tillage (PL):
- cultivator (10 cm) + heavy harrow,
- cultivator (18-20 cm) + string roller, - sowing + harrowing.
Direct drilling (DD):
- sowing with direct drilling machine,
- spraying with Reglone (3 l ha-1).
All tillage operations were performed with tractor-driven equipment in late summer and autumn before and at sowing winter wheat after broad-bean.
Soil samples were taken each year in spring at shooting growth stage of winter wheat at random, but avoiding wheel tracks. For measurements of the soil moisture characteristic curve soil cores of 100 cm3in volume were taken from the 0-10 cm and 10-20 cm layers (8 replications from each layer and each plot). Those layers covered the whole working depth of main implements used under CT and PL. The water retention curve was determined using the pressure cell apparatus (Klute, 1986). It was used to calculate the volume percentage of pore diameter classes >20mm (macropores), 20-0.2 mm (mesopores) and <0.2 mm (micropores). The
density (Blake and Hartge, 1986).
Bulk soil samples for determination of aggregate stabi-lity were collected (in 6 replications) from the depths of 0-10 cm and 10-20 cm. Then 50 g of the air-dried (at 20°C) soil was wet sieved for 12 min using a set of flat sieves of 5 and 1 mm aperture in 1-liter cylindrical containers. The con-tainers were rotated at a tilt (45°) at a frequency of 2 rotations per minute. The aggregates remaining on each sieve were dried and weighed to obtain the percentage of water stable aggregate fractions of 10-5, 5-1 and <1 mm.
Data were tested for significance at the 5% level. Coefficients of variation and correlation were calculated.
RESULTS AND DISCUSSION
Bulk density
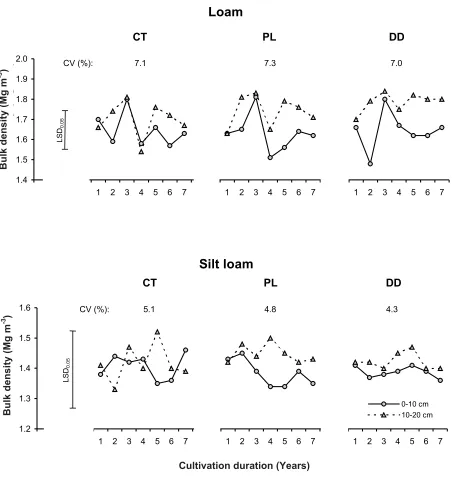
Tillage systems effect on bulk density for 7 consecu-tive years are shown in Fig. 1. In loam, as compared to silt loam, bulk density was more variable over the years, in parti-cular at the depth 0-10 cm. This could be partly associated with swelling and shrinking of the loam soil with 24% clay. The variations were greater for the first 5 years than there-after, and resulted in relatively large differences in bulk den-sity between the 0-10 and 10-20 cm horizons. The diffe-rences were more consistent and pronounced under DD and PL than under CT. Mean values of bulk density between the two depths were significantly different under PL and DD.
The 7-year mean soil bulk densities in the loam for the 0-10 cm depth were similar in all tillage treatments (1.63 -1.65 Mg m-3), whereas for the 10-20 cm depth it was greater under DD (1.78 Mg m-3) than CT (1.70 Mg m-3) and PL (1.74 Mg m-3) (Table 2). In the silt loam the tillage did not significantly affect average soil bulk density at both depths.
Pore size distribution
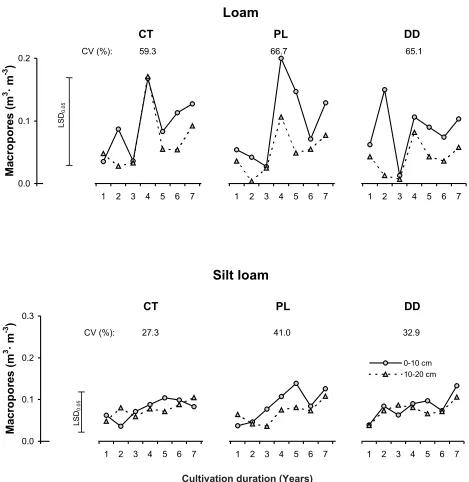
There were no significant differences in 7-year mean macroporosity (>20 mm) with regard to tillage system in both soils (Table 2). Temporal changes were, however, largely affected by soil type and tillage treatments. In the Investigated
soil
Grain size distribution (%) (dia in mm) C
org.
(%) 2-0.05 0.05-0.02 0.02-0.005 0.005-0.002 <0.002
Eutric Cambisol (Loam)
47 8 12 9 24 0.66
Haplic Luvisol (Silt loam)
21 42 21 6 10 1.12
loam soil, the contribution of macropores was highly variable without any definite trend over the 7-year culti-vation duration (Fig. 2).
In the silt loam soil, macroporosity increased in most years and after seven years it was up to 1.3 in CT to 3.4 times in PL and DD for the depth 0-10 cm and from 1.7 in PL to 2.2-2.8 times in CT and DD at the 10-20 cm depth (Fig. 2). Visual observations showed that also the number of macropores created by soil fauna was greater under PL and DD than CT. Enhancing the effect of PL and DD tillage
systems on the percentage of macropores at 0-10 cm depth can beneficially affect water and air conductivity. A positive effect of macropore volume on soil infiltrability has been reported (Walczaket al., 1996; Arvidsson, 1997).
Comparison of Figs 1 and 2 indicates that in the loam the changes in bulk density and macroporosity were similar but in opposite direction (r = -0.538,a=0.05). This relationship was less pronounced in the silt loam soil (r = -0.134,a=0.05). In mostof the cases of this study, increases in volume of macropores over time (Fig. 2) allowed to overpass the value
PORE SIZE DISTRIBUTION AND AGGREGATE STABILITY 167
1.4 1.5 1.6 1.7 1.8 1.9 2.0
1 2 3 4 5 6 7 1 2 3 4 5 6 7 1 2 3 4 5 6 7
Bu
lk
Den
s
it
y
(M
g
·
m
-3
)
CT
PL
DD
CV (%): 7.1 7.3 7.0
LS
D0.05
Loam
1.2 1.3 1.4 1.5 1.6
1 2 3 4 5 6 7 1 2 3 4 5 6 7 1 2 3 4 5 6 7
Cultivation Duration (Yr)
Bu
lk
Den
s
it
y
(M
g
·
m
-3
)
0-10 cm 10-20 cm
CT
PL
DD
CV (%): 4.8 4.3
LS
D0.05
5.1
Silt loam
Fig. 1.Temporal changes in bulk density for the investigated soils. CV – coefficient of variation for both depths; CT– conventional tillage; PL– ploughless tillage; DD – direct drilling.
Bulk
density
(Mg
m
-3 )
Bulk
density
(Mg
m
-3 )
of 0.05 m3m-3that is considered as a critical limit set for cropped sites (Mc Qeen and Shepherd, 2002).
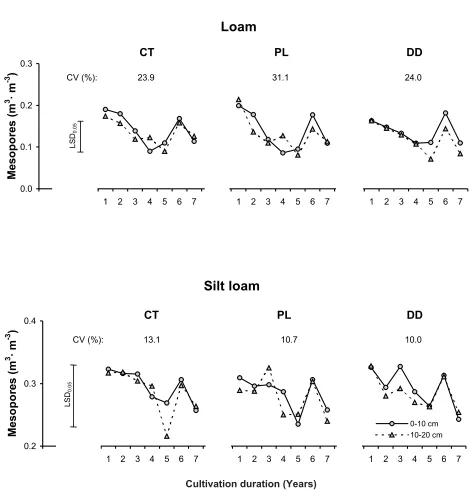
The volume of mesopores (20-0.2mm) was not greatly affected by the tillage systems in both the soils. The mean content of these pores in the combined 0-20 cm horizon varied in the loam soil from 0.129 m3m-3(DD) to 0.138 m3m-3 (CT), and in the silt loam soil – from 0.281 m3m-3(PL) to 0.291 m3m-3(CT) (Table 2). In general, the volume of the mesopores decreased in the first 4-5 consecutive years of cultivation in all the treatments and depths (Fig. 3). This decrease was relatively greater in the loam than in the silt loam soil where the contribution of the pores was greater irrespective of the treatments. In the loam, the differences between the initial value and those in some later years were significant, in particular under PL.
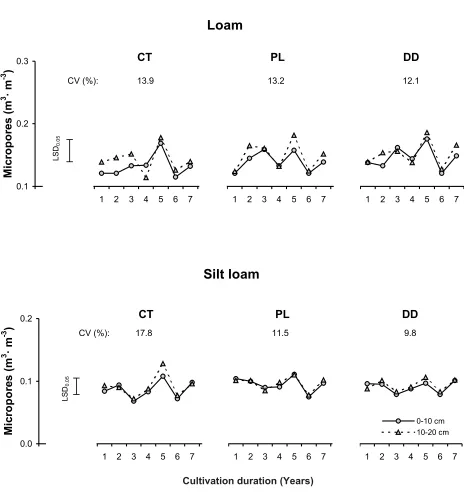
The mean volume of micropores (<0.2mm) for the depth of 0-10 cm and the combined 0-20 cm horizon was different among the tillage treatments in both soils (Table 2). This content in the combined 0-20-cm depth was the least in CT
(0.137 in loam and 0.09 m3m-3in silt loam) and the highest in DD for the loam soil (0.149 m3m-3) and in PL for the silt loam soil (0.096 m3m-3). Figure 4 indicates that changes in microporosity over the years and differences between the depths were relatively smaller in the silt loam than in the loam soil, in particular in PL and DD. The altogether higher percentage of micropores in the loam than in the silt loam soil can be associated with greater content of clay (Table 1). The volume of the micropores was positively related to bulk density in silt loam (r = 0.360) and boulder clay (r = 0.468).
Aggregate stability
Temporal changes in mean stability of 10-5 mm aggregates over the 7-year period are shown in Table 3. In loam soil, in most years the highest stability of the aggregates at the depth of 0-10 cm was observed in DD, where mean value of 0.103 kg kg-1was significantly higher as compared with PL and CT (0.044-0.049 kg kg-1).
Properties Depth
(cm)
CT PL DD LSD0.05
Loam Bulk density
(Mg m-3)
0-10 10-20 0-20 1.65 1.70 1.68 1.63 1.74 1.68 1.64 1.78 1.71 0.0572 0.0323 Macropores
>20mm (cm3cm-3)
0-10 10-20 0-20 0.093 0.069 0.081 0.096 0.066 0.081 0.085 0.040 0.063 0.0412 0.0233 Mesopores
0.2-20mm (cm3cm-3)
0-10 10-20 0-20 0.142 0.135 0.138 0.137 0.132 0.135 0.137 0.121 0.129 0.0222 0.0123 Micropores
<0.2mm (cm3cm-3)
0-10 10-20 0-20 0.132 0.142 0.137 0.139 0.149 0.144 0.146 0.152 0.149 0.0112 0.0063 Silt loam Bulk density (Mg m-3)
0-10 10-20 0-20 1.41 1.42 1.42 1.38 1.45 1.42 1.39 1.42 1.41 0.0772 0.0433 Macropores
>20mm (cm3cm-3)
0-10 10-20 0-20 0.078 0.076 0.077 0.088 0.068 0.078 0.083 0.075 0.079 0.0282 0.0163 Mesopores
0.2-20mm (cm3cm-3)
0-10 10-20 0-20 0.295 0.287 0.291 0.284 0.274 0.281 0.293 0.285 0.289 0.0312 0.0173 Micropores
<0.2mm (cm3cm-3)
0-10 10-20 0-20 0.087 0.092 0.090 0.095 0.096 0.096 0.091 0.093 0.092 0.0082 0.0043
Variability of the stability was higher under CT (CV 85.7 %) compared to PL (CV 42.6 %) and DD (CV 47.9%). In the silt loam soil, the aggregate stability to water was improved under both conservation tillage systems as compared to the conventional one in most years (Table 3). Mean value of the stability of the combined 0-20 cm depth in conventionally tilled (CT) soil (0.015 kg kg-1) was significantly lower than under conservation tillage systems (0.023 kg kg-1).
Stability of 5-1 mm aggregates in the loam soil under DD increased between most consecutive years (Table 4). For the depth of 0-10 cm, the initial stability (0.102 kg kg-1)
in this treatment increased after seven years by 101 %, and at the depth of 10-20 cm (0.114 kg kg-1) – by 144%. There was no such a clear trend in the data for CT and PL. Similar to 5-10 mm aggregates, mean stability of the combined 0-20 cm depth was significantly greater in DD compared with CT and PL (0.05). In silt loam, the stability of the aggregates in most years was the least in CT and the highest in DD for both depths. The differences between the treatments were more pronounced for the depth of 0-10 cm than for 10-20 cm. The mean value of the combined 0-20 cm depth was significantly lower under CT (0.076 kg kg-1) than under PL (0.102 kg kg-1) and DD (0.113 kg kg-1).
PORE SIZE DISTRIBUTION AND AGGREGATE STABILITY 169
0.0 0.1 0.2
1 2 3 4 5 6 7 1 2 3 4 5 6 7 1 2 3 4 5 6 7
M
a
c
ropor
e
s
(m
3
·m
-3
)
CT
PL
DD
CV (%): 59.3 66.7 65.1
LS
D0.
05
Loam
0.0 0.1 0.2 0.3
1 2 3 4 5 6 7 1 2 3 4 5 6 7 1 2 3 4 5 6 7
Cultivation Duration (Yr)
M
acro
p
o
res
(m
3
·m
-3
)
0-10 cm 10-20 cm
CT
PL
DD
CV (%): 27.3 41.0 32.9
LS
D0.
05
Silt loam
Fig. 2.Temporal changes in volume of macropores (>20mm) for the investigated soils. Explanations as in Fig. 1.
The above results indicate that the effect of tillage methods on the stability of 10-5 mm and 5-1 mm aggregates is related to soil type. In boulder clay, most stable aggregates occurred in DD and in silt loam soil in both PL and DD. This can be partly attributed to increased organic carbon content under PL and DD in both the soils as reported by (Pranagal, 2000). Increase of aggregate stability can be also related to increased hydrophobicity of aggregates (Hornet al., 1994). Higher contents of stable large aggregates significantly
contribute to greater surface porosity and infiltration (Braunack and Dexter, 1989; Mamedov and Levy, 2001). The altogether greater stability of 10-1 mm aggregates in the loam could be due to greater clay content and preshrinking effect (Horn, 2003).
Temporal changes in the stability of soil aggregates could correspond to the existing water content. In the silt loam soil, the courses of variations in water content and stabi-lity of the 5-1 mm aggregates were significantly correlated
0.0 0.1 0.2 0.3
1 2 3 4 5 6 7 1 2 3 4 5 6 7 1 2 3 4 5 6 7
M
e
s
opor
e
s
(m
3
·m
-3
)
CT
PL
DD
CV (%): 23.9 31.1 24.0
LS
D0.
05
Loam
0.2 0.3 0.4
1 2 3 4 5 6 7 1 2 3 4 5 6 7 1 2 3 4 5 6 7
Cultivation Duration (Yr)
M
e
s
opor
e
s
(m
3
·m
-3
)
0-10 cm 10-20 cm
CT
PL
DD
CV (%): 10.7 10.0
LS
D0.
05
13.1
Silt loam
Fig. 3.Temporal changes in volume of mesopores ( 20-0.2mm) for two soils. Explanations as in Fig. 1.
(r = 0.388,a= 0.05), whereas in the loam the opposite was true (r = - 0.457,a= 0.05). Similar relations were observed with respect to aggregates of 10-5 mm size. These indicate that the effect of tillage methods on the stability of the aggregates depends on soil water content, and thus precipitation, the dependence being different for different soil types.
The stability of aggregates <1 mm in loam was the least under DD in most years for both depths (Table 5). Mean
seven-year stability in DD treatment for the 0-10 cm depth (0.736 kg kg-1) and the 10-20 cm depth (0.739 kg kg-1) were significantly lower as compared to those at the correspon-ding depths of the two remaining treatments (0.816-0.849 kg kg-1) (0.05) (Table 2). In the silt loam soil, the stability was the highest under CT in most years, and the 7-year mean value of the combined 0-20 cm depth in this treatment (0.91 kg kg-1) was significantly greater compared with PL (0.875 kg kg-1) and DD (0.864 kg kg-1). Water stability of the
PORE SIZE DISTRIBUTION AND AGGREGATE STABILITY 171
0.1 0.2 0.3
1 2 3 4 5 6 7 1 2 3 4 5 6 7 1 2 3 4 5 6 7
M
ic
ropor
e
s
(m
3
·m
-3
)
CT
PL
DD
CV (%): 13.9 13.2 12.1
LS
D0.
05
Loam
0.0 0.1 0.2
1 2 3 4 5 6 7 1 2 3 4 5 6 7 1 2 3 4 5 6 7
Cultivation Duration (Yr)
M
ic
ropor
e
s
(m
3
·m
-3
)
0-10 cm 10-20 cm
CT
PL
DD
CV (%): 11.5 9.8
LS
D0.
05
17.8
Silt loam
Fig. 4.Temporal changes in volume of micropores (<0.2mm) for the investigated soils. Explanations as in Fig. 1.
Tillage system
Depth (cm)
Year Mean Mean
for tillage system
CV (%)
1994 1995 1996 1997 1998 1999 2000
Loam CT PL DD 0-10 10-20 0-10 10-20 0-10 10-20 0.097 0.095 0.068 0.117 0.102 0.114 0.117 0.138 0.164 0.143 0.148 0.124 0.121 0.093 0.181 0.135 0.138 0.146 0.097 0.133 0.112 0.126 0.208 0.101 0.148 0.104 0.155 0.181 0.149 0.240 0.056 0.064 0.067 0.054 0.180 0.234 0.143 0.187 0.118 0.190 0.205 0.279 0.111 0.116 0.124 0.135 0.161 0.177 0.114 0.130 0.169 29.8 33.1 32.5
LSD0.05 0.2111 0.0612 0.0343
-Silt loam CT PL DD 0-10 10-20 0-10 10-20 0-10 10-20 0.090 0.089 0.130 0.095 0.110 0.098 0.071 0.092 0.093 0.101 0.106 0.123 0.060 0.051 0.062 0.049 0.101 0.084 0.103 0.069 0.091 0.078 0.168 0.119 0.096 0.068 0.128 0.143 0.163 0.092 0.075 0.036 0.107 0.109 0.145 0.082 0.098 0.054 0.110 0.132 0.139 0.056 0.085 0.066 0.103 0.101 0.133 0.093 0.076 0.102 0.113 26.3 25.5 28.3
LSD0.05 0.1131 0.0332 0.0183
-Explanations as in the Table 2.
T a b l e 4.Stability of aggregates 5-1 mm (kg kg-1)
Tillage system
Depth (cm)
Year Mean Mean
for tillage system
CV (%)
1994 1995 1996 1997 1998 1999 2000
Loam CT PL DD 0-10 10-20 0-10 10-20 0-10 10-20 0.144 0.041 0.060 0.069 0.158 0.042 0.032 0.048 0.034 0.061 0.063 0.058 0.031 0.026 0.060 0.040 0.064 0.055 0.018 0.020 0.025 0.045 0.170 0.145 0.068 0.020 0.069 0.048 0.133 0.113 0.013 0.009 0.034 0.007 0.029 0.063 0.035 0.081 0.029 0.070 0.103 0.112 0.049 0.035 0.044 0.049 0.103 0.084 0.042 0.047 0.094 85.7 42.6 47.9
LSD0.05 0.1411 0.0412 0.0233
-Silt loam CT PL DD 0-10 10-20 0-10 10-20 0-10 10-20 0.036 0.012 0.065 0.013 0.046 0.012 0.014 0.018 0.021 0.009 0.019 0.019 0.012 0.012 0.009 0.009 0.014 0.018 0.024 0.019 0.010 0.013 0.030 0.013 0.024 0.009 0.025 0.013 0.026 0.011 0.012 0.003 0.037 0.026 0.039 0.015 0.012 0.006 0.045 0.021 0.022 0.037 0.019 0.011 0.030 0.015 0.028 0.018 0.015 0.023 0.023 60.0 69.6 47.8
LSD0.05 0.0481 0.0142 0.0083
aggregates was highly variable over the experimental period. At comparable tillage methods, the variability, as shown by the coefficient of variation, was greater in loam than in silt loam.
CONCLUSIONS
1. Soil structure, as characterized by bulk density, pore-size distribution and aggregate stability, was substantially different between the tillage treatments. Mean bulk density for 0-10 cm was not different between the tillage treatments in both soils and for 10-20 cm in the loam soil it was greater under DD than CT and PL.
2. After seven years, macroporosity increased to a dif-ferent degree depending on tillage treatments and depth. In general, macroporosity in the loam soil increased more under CT and in silt loam under PL and DD. At comparable treatments, the ratios were considerably greater for silt loam than for loam soil. Contribution of mesopores (20-0.2mm) did not differ significantly among the tillage systems and that of micropores (<0.2mm) was the least in CT in both soils.
3. Effects of tillage methods on stability of aggregates were related to soil type. In most years the stability of the 10-1 mm aggregates was the highest under DD in the loam soil and under DD and PL in the silt loam soil. The increases under DD can be associated with increased soil organic
matter content. The results imply that under the ploughless and direct-drilled tillage systems greater stability of the surface soil structure can increase water infiltration owing to greater porosity and lower surface sealing.
REFERENCES
Arvidsson J., 1997.Soil Compaction in Agriculture - From Soil
Stress to Plant Stress. Ph.D. Thesis. Agraria 41, Swedish Univ. Agric. Sci., Uppsala.
Blake G.R. and Hartge K.H., 1986.Bulk density. In: Methods of
Soil Analysis (Ed. A. Klute). 1. Physical and Mineralogical Methods. Agronomy Monograph, 9, SSSA, Madison, WI, 363-375.
Braunack M.V. and Dexter A.R., 1989.Soil aggregation in the
seedbed: a review. I. Properties of aggregates and beds of aggregates. Soil Till. Res., 14, 259-279.
Franzluebbers A.J., 2002. Water infiltration and soil structure
related to organic matter and its stratification with depth. Soil Till. Res., 66, 197-205.
Horn R., 2003.Stress-strain effects in structured unsaturated soils
on coupled mechanical and hydraulic processes. Geoderma, 116, 77-88.
Horn R., Taubner H., Wuttke M., and Baumgartl T., 1994.Soil
physical properties related to soil structure. Soil Till. Res., 32, 135-148.
Karlen D.L., Wollenhaupt N.C., Erbach D.C., Berry E.C.,
Swan J.B., Eash N.S., and Jordahl J.L., 1994.Long-term
tillage effects on water quality. Soil Till. Res., 32, 313-327.
PORE SIZE DISTRIBUTION AND AGGREGATE STABILITY 173
Tillage system
Depth (cm)
Year Mean Mean
for tillage system
CV (%)
1994 1995 1996 1997 1998 1999 2000
Loam CT PL DD 0-10 10-20 0-10 10-20 0-10 10-20 0.759 0.864 0.872 0.814 0.740 0.844 0.851 0.814 0.802 0.796 0.789 0.818 0.848 0.881 0.759 0.825 0.798 0.799 0.885 0.847 0.863 0.829 0.622 0.754 0.784 0.876 0.776 0.771 0.718 0.647 0.931 0.927 0.899 0.939 0.791 0.703 0.822 0.732 0.853 0.740 0.962 0.609 0.840 0.849 0.832 0.816 0.736 0.739 0.845 0.824 0.738 6.9 6.9 9.9
LSD0.05 0.3131 0.0902 0.0513
-Silt loam CT PL DD 0-10 10-20 0-10 10-20 0-10 10-20 0.874 0.899 0.805 0.892 0.844 0.890 0.915 0.890 0.886 0.890 0.875 0.858 0.928 0.937 0.929 0.942 0.885 0.898 0.873 0.912 0.899 0.909 0.802 0.868 0.880 0.923 0.847 0.844 0.811 0.897 0.913 0.961 0.856 0.865 0.816 0.903 0.890 0.940 0.845 0.847 0.839 0.907 0.896 0.923 0.866 0.884 0.839 0.889 0.910 0.875 0.864 3.7 4.5 4.3
LSD0.05 0.1231 0.0362 0.0203
-Explanations as in the Table 2.
and depth stratification of porosity and soil organic matter. Soil Till. Res., 66, 107-118.
Klute A., 1986. Methods of Soil Analysis. 1. Physical and
Mineralogical Methods. ASA-SSSA Inc., Madison, Wisconsin, USA, 1986.
Lal R., Logan T., Eckert D.J., Dick W.A., and Shipitalo M.J.,
1994.Conservation tillage in the corn belt of the United
States. In: Conservation Tillage in Temperate Agro-ecosystems (Ed. M.R. Carter). Lewis Publishers, CRC Press, Canada, 73-114.
Lipiec J. and Stêpniewski W., 1995.Effects of soil compaction
and tillage systems on uptake and losses of nutrients. Soil Till. Res., 35, 37-52.
Malicki L., Nowicki J., and Szwejkowski Z., 1997.Soil and crop
responses to soil tillage systems: a Polish perspective. Soil Till. Res., 43, 65-80.
Mamedov A.I. and Levy G.J., 2001. Clay dispersivity and
aggregate stability effects on seal formation and erosion in effluent-irrigated soils. Soil Sci., 166, 631-639.
McGarry D., Bridge B.J., and Radford B.J., 2000.Contrasting
soil physical properties after zero and traditional tillage of an alluvial soil in semi-arid subtropics. Soil Till. Res., 53, 105-115.
McQeen D.J. and Shepherd T.G., 2002.Physical changes and
compaction sensitivity of a fine-textured, poorly drained soil (Typic Endoaquept) under varying durations of cropping Manawatu Region, New Zealand. soil Till. Res., 63, 93-1007.
Podstawka-Chmielewska E., Malicki L., and Kisiel K., 2001.
Effects of different tillage systems on wetness of heavy soil (in Polish). Annales UMCS, E, 4, 29-36.
various tillage systems (in Polish). Ph.D. Thesis, Univ. Agric., Lublin, Poland.
Pranagal J. and Dom¿a³ H., 2001. Physical conditions of
rendzina in various cultivation systems. Acta Agrophysica, 56, 247-257.
Reicosky D.C., Kemper W.D., Langdale G.W., Douglas Jr.,
C.L., and Rasmussen P.E., 1995. Soil organic matter
changes resulting from tillage and biomass production. J. Soil Water Conserv., 50, 253-261.
Rejman J., Paw³owski M., Dêbicki R., and Link M., 1994.
Stability of aggregates and erodibility of loess soil. Polish J. Soil Sci., XXVII, 2, 87-91.
Schjønning P. and Rasmussen K., 2000.Soil strength and soil
pore characteristics for direct drilled and ploughed soils. Soil Till. Res., 57, 69-82.
Tebrügge F. and Düring R.A., 1999.Reducing tillage intensity –
a review of results from a long-term study in Germany. Soil Till. Res., 53, 15-28.
Walczak R.T., Sobczuk H., and S³awiñski C., 1996.Submodel
of bypass flow in cracking soils. 2. Experimental validation. Int. Agrophysics, 10, 197-207.
Wiermann C. and Horn R., 2000. Effect of different tillage
systems on the recovery of soil structure following a single compaction event. In: Subsoil compaction – distribution, processes and consequences (Eds R. Horn, J.J.H. van den Akker, J. Arvidsson). Advances in geoecology, 32, Catena, Reiskirchen, Germany, 339-350.