DISTRIBUTION SYSTEMS RECONFIGURATION USING
PATTERN RECOGNIZER NEURAL NETWORKS
Ali Reza Fereidunian
Department of Electrical and Computer Engineering, Faculty of Engineering, Tehran University and Moshanir Power Engineering Services Company, Tehran, Iran, [email protected]
Hamid Lesani
Department of Electrical and Computer Engineering, Faculty of Engineering, Tehran University Tehran, Iran, [email protected]
Caro Lucas
Department of Electrical and Computer Engineering, Faculty of Engineering, Tehran University School of Intelligent Systems, IPM, Tehran, Iran, [email protected]
(Received: August 6, 2000 – Accepted in Final Form: June 17, 2002)
Abstract A novel intelligent neural optimizer with two objective functions is designed for electrical distribution systems. The presented method is faster than alternative optimization methods and is comparable with the most powerful and precise ones. This optimizer is much smaller than similar neural systems. In this work, two intelligent estimators are designed, a load flow program is coded, and a special modified heuristic optimization algorithm is developed and used too. The load pattern concept is used for training ANNs. Finally, the designed optimizer is tested on an example distribution system; simulation results are presented, and compared with similar systems.
Keywords Distribution Systems, Pattern Recognition, Neural Networks, Real-Time Control, Loss Reduction, Load Balancing, Optimization, Decision Making
ﻩﺪﻴﻜﭼ
ﻩﺪﻴﻜﭼ
ﻩﺪﻴﻜﭼ
ﻩﺪﻴﻜﭼ
ﺖﺳﺍﻩﺪﺷﻲﺣﺍﺮﻃﻲﻜﻳﺮﺘﻜﻟﺍﻱﮊﺮﻧﺍﻊﻳﺯﻮﺗﻢﺘﺴﻴﺳﻱﺍﺮﺑﻑﺪﻫﻊﺑﺎﺗﻭﺩﺎﺑﺪﻳﺪﺟﺪﻨﻤﺷﻮﻫﺯﺎﺳﻪﻨﻴﻬﺑﻚﻳ .
ﺖــﺑﺎﻗﺭﻲــﻳﺎﻧﺍﻮﺗ،ﺖــﻗﺩﺚــﻴﺣﺯﺍﻭﺖــﺳﺍﺮﺘﻌﻳﺮــﺳﻱﺯﺎــﺳﻪﻨــﻴﻬﺑﻱﺎﻬــﺷﻭﺭﺮﻳﺎــﺳﺯﺍﻩﺪــﺷﻪــﺋﺍﺭﺍﺵﻭﺭ ﺎــﺑ
ﺪﻨﻤﺗﺭﺪﻗ ﺖﺳﺍﻪﺘﻓﺮﮔﺭﺍﺮﻗﻩﺩﺎﻔﺘﺳﺍﺩﺭﻮﻣﻭﻩﺪﺷﻩﺩﺍﺩﻪﻌﺳﻮﺗﻪﺘﻓﺎﻳﺩﻮﺒﻬﺑﻚﻴﺘﺴﻳﺭﻮﻴﻫﻱﺯﺎﺳﻪﻨﻴﻬﺑﻱﺎﻬﺷﻭﺭﻦﻳﺮﺗ
.
ﺭﺩ
ﺎﺑﻭﻪﺋﺍﺭﺍﻱﺯﺎﺳﻪﻴﺒﺷﺞﻳﺎﺘﻧ،ﻩﺪﺷﺶﻳﺎﻣﺯﺁﻪﻧﻮﻤﻧﻥﻮﻣﺯﺁﻊﻳﺯﻮﺗﻢﺘﺴﻴﺳﻚﻳﻱﻭﺭﻩﺪﺷﻲـﺣﺍﺮﻃﺯﺎـﺳﻪﻨـﻴﻬﺑ،ﻥﺎـﻳﺎﭘ ﻢﺘﺴﻴﺳ ﺖﺳﺍﻩﺪﺷﻪﺴﻳﺎﻘﻣﻪﺑﺎﺸﻣﻱﺎﻫ
.
1. INTRODUCTION
After a century since the dawn of electricity era, distribution systems optimization has been considered more often. This consideration occurs after fairly good optimization of the generation and transmission systems. Distribution system is a link between the transmission system and the end consumer, and is the nearest part of power system to the end consumer. Since the distribution system current is higher than the transmission system
current, its line loss is higher; almost 10% of generated energy is wasted in the distribution systems. Two practical methods can be used for minimizing line losses: optimum capacitor placement and feeder reconfiguration. In this paper the feeder reconfiguration method is presented and used.
determined so that a well-defined objective function is optimized. Also its constraints must be satisfied. This is a nonlinear mixed-integer optimization problem and various methods have been suggested for solving it. Some of t his methods are: Mathematical Gradient, Numerical, Heuristic, Intelligent and Stochastic methods. Most of these methods are based on greedy search, which in most cases reaches to a local minimum rather than the global minimum. Extending the distribution network dimensions irritates this situation. In this paper, it will be more complicated because of having two objective functions. Another disadvantage of most of the optimization methods is time-consuming calculations. It hardens their on-line applications. Feeder reconfiguration is used in both design (determining optimal lines) and operation calculations.
In recent years various projects are conducted on Distribution Management Systems (DMS) and Distribution Automation and Control (DAC) including seasonal, daily, hourly and on-line feeder reconfiguration. Networks with many meshes, difference of load profiles of various buses in the network and non-simultaneous variations of commercial, residential and industrial load profiles (load patterns) have made this project feasible.
In 1975, Merlin and Back [1] introduced the feeder reconfiguration problem, and presented a method for solving it. This method was improved and modified by Shirmohammadi and Hong [2,3] and was called: Sequential Switch Opening Method (SSOM). Also Civanlar, et al. [4] introduced a method known as Switch Exchange Method (SEM) presenting an approximate formula for loss changes. Most of the heuristic feeder reconfiguration methods are based on these two methods (SSOM, SEM). Then, Baran and Wu added load balancing to the objective function [5]. Recent improvements in mathematics and control theories have led to a new generation of computing and control systems. These new systems benefit the advantages of acting under variable, uncertain and complex conditions. The need for their precise and fast operation, and the complexity of real systems mathematical model, has placed them in a high ranking in hot research topics.
These systems must have specific characteristics such as: adaptivity, learning ability, robustness against external noise, tolerable internal error, uncertainty, and non-linearity. Also, such a systems do not require the precise mathematical model of the plant system. These properties have made intelligent systems such as Artificial Neural Networks (ANNs), Fuzzy Systems, Heuristic and rule based methods, Genetic Algorithms and Simulated Annealing, powerful methods for solving engineering and scientific applications. Many researchers have applied the above mentioned intelligent and heuristic optimization methods to distribution system optimization problem, such as: Simulated Annealing by Chiang and Jumeau [6], Jiang and Baldick [7] and Nara and Kitagava [8]. Also Nara, et al. [9] applied Genetic Algorithms to this problem and concluded that Genetic Algorithm is faster, and Simulated Annealing is stronger. Santoso and Tan [10] used ANNs for ohmic line loss' reduction by optimum capacitor placement. Jung, et al. [11] used a method based on expert systems including heuristic rule base and inference engine and Kim et al. [12] used ANNs for line loss' optimization by feeder reconfiguration. Bouchard, et al. [13] had an unsuccessful try in using Hopfield Neural Networks for Feeder Reconfiguration like travelling salesman Problem (TSP) solution and Wang et al. [14] applied Fuzzy Logic to this problem. Also Zhou, et al.[15] and Lin, and Chin [16] presented some methods for multi-objective feeder reconfiguration problems. McDermott et. al. [17] used a heuristic method for solving feeder reconfiguration problem, by a normalized objective function, and Popvic et. al. [18] used a multi-objective algorithm for distribution system service restoration.
Here, a modular, powerful, and fast optimizer system is designed which can reach to the previously learnt global minimum. Its dimension is much smaller than similar systems based on ANNs [10,12]. It reduces the dimensions of signal communication system, because of determining critical switches. The presented optimizer determines the optimum topology in one iteration. Hence, it is faster than other optimization methods based on iterative calculations and it can be used in real-time on-line applications. The load pattern idea with constant P-Q load models is used for training ANNs. The method has good performance for distribution systems with large dimensions and its generalization abilities are significant. The presented optimizer benefits the intelligence property of neural networks, which leads to its high performance under faulted and contingency conditions. In this work, also two neural intelligent state estimators are designed [21], a load flow program [3] and a modified heuristic optimization algorithm are developed and used [22].
2. FEEDER RECONFIGURATION PROBLEM DESCRIPTION AND SOLVING
A. Problem Description
Distribution systems are designed as a ring (or network) configuration, and operated as a radial system. Generally, two types of switches exist in distribution systems: Normally Closed (NC) - which connect line sections - and Normally Open (NO) on the tie lines - that connect two feeders, two substations or two ring branches -.Topological change in the configuration of distribution system by opening and closing network switches is known as RECONFIGURATION.The final distribution system must be radial again after every reconfiguration (switching operations) and other network constraints must be satisfied. One of the advantages of the distribution systems radiality is simplicity of protection co-ordination.
Two major objects are noted in distribution system feeder reconfiguration: (1) ohmic loss reduction in lines and (2) protection against over loads in lines and network devices and apparatus (transformers, switches, etc.) which is known as
Load Balancing. Hence, we have an optimization problem with two objective functions. Current ampacity, voltage profile, and load flow equations are considered as constraints. In this method, there is no need to a constraint on the number of permitted switching, because the critical switches are recognized in this method.
B. Problem Formulation
First part of the objective function is loss formula that is written as:PL= 2
i 2 i 2 i L
1 i
i
V
Q
P
.
r
+
∑
=(1)
and the second part is load balance. The load-balancing index for each branch of network is:
dli = Si Simax (2)
where, Si is apparent power of branch (i) at sending end, and Simax is maximum apparent power of branch (i) sending end
Load balancing index for the whole network must include all the branches and is written as an l-p norm of the indices vector [21,22]:
Lp=p N
1 i
p i
f
∑
=
(3)
About the order of the l-p norm, we note the following statement:
Effect of the largest element of a vector on the higher order norms of the vector is greater than its effect on the lower order norms. In other words, sensitivity of l-p norm with respect to the largest element of the vector increases by increasing the order of the norm (i.e., p) [22].
Accordingly, to have an optimum control on the worst load balancing index, p approaches to infinity; hence, the load balancing objective function is taken as a Chebyshev form:
LB= L∞= H∞= Max
f
i , i = 1, 2,. ,N (4)For solving two optimization problems simultaneously, the objective functions can be merged by the familiar method of using penalty factors as:
F= CL . PL+ CB . LB (5)
CLand CB are penalty factors that are selected by the designer under the following constraints:
CL> CB (6)
CL+ CB= 1 (7)
CLhave been taken greater than CB, because the loss reduction goal is more important than the load balancing. Also, constraint (7) has been taken for normalizing the objective function. Finally, the optimization problem is formulated as:
Mingi [CL.
r
P
Q
V
i i
L
i i
i
=
∑
+
1
2 2
2
.
+ CB. Max(Si Simax, i=1,2,...,L)] (8)
Subject to:
Vminj ≤
V
j ≤Vmaxj (9)Iminjk ≤
I
jk ≤Imaxjk (10)f(x,gi )=0 (11)
C. Load Flow
Equation 11, stands for load flow equations. According to specific characteristics of the distribution systems, here conventional load flow algorithms do not work. Hence a specific method for distribution systems known as “Compensated Backward Forward Sweep” or in abbreviated form CBFS is coded and used [3].D. Extended Switch Exchange Method
(ESEM)
There is a detailed comparison between Sequential Switch Opening Method (SSOM)[2] and Switch Exchange Method (SEM) [4] in references [22,23]. It has been concluded that the SSOM solution is independent of the primary topology of the distribution network, while the SEM is faster. In this work, the SSOM cannot be used, because it is based on optimum current flow pattern. So, load balancing objective function cannot be optimized by SSOM. In order to take into account both objective functions, a method(which is similar to the SEM) is used with some modifications. Hence, it is called Extended Switch Exchange Method (ESEM). Figure 2 shows the flow chart of SEM that is briefly explained as follows:
First, the distribution network data such as real and imaginary power, resistance, inductance and primary configuration are entered. Then a load flow study is done and total power loss and load balancing indices are calculated. The change in the objective function (Equation 8) caused by all allowable switching options is determined. Next, a list containing all of allowable switching options and sorted increasingly from the smallest change in the objective function (the most negative) to the largest one is generated. The first row of the list -which introduces the largest change in the objective function - is selected as the best switching option and is applied if it satisfies the optimization constraints. Otherwise, the first row is set aside and the option with the largest priority is replaced. This procedure continues until all of the changes in the objective function are positive, in other words, no reduction in the objective function happens.
3. FEEDER RECONFIGURATION USING ARTIFICIAL NEURAL NETWORKS
A. Solution Methodology
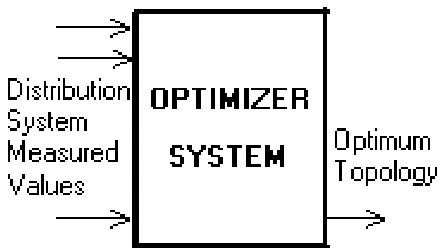
Optimization by ANNs using pattern recognition method is derived from a new approach to the problem. This method is based on finding a deep, but simple, philosophical interpretation: “Optimization is searching, recognizing and determining the optimum pattern”. So that, for performing optimization by ANNs, it is enough to design ANNs, that can find optimum topology of the network, on the basis of knowledge derived from information, heuristics and expertise earned in the learning mode of the ANN. This property is ideal for a real-time control system, because of its on-line, feed-forward computation. Figure 1 shows the block diagram of such a system. In fact, this system acts as an intelligent expert system with optimal decision-making operation. This task cannot be done in one stage. Thus, the optimizer system is partitionedas shown in Figure 3, and explained in the following sections.
B. Zone Load Calculation (Block 1)
In block No. 1, the distribution system is divided to Z zones, then real and imaginary power consumption of every zone is calculated by the following equations:
ZPi = Pi +
p
ijj N
=
∑
1
(12)
ZQi = Qi +
Q
ijj N
=
∑
1
(13)
where: i = 1,2,...,Z
Zpi, Zqi = Loads of zones
Pi, Qi = Sending end power flow of zone i Pij, Qij = power flow of line j supplied by zone i N = Number of line sections supplied by zone i.
C. Zone Load Level Estimation (Block 2)
The output of block 1 is fed to an intelligent state estimator (block No. 2). The state estimator is as ANNs whose inputs are Zpi and ZQi and its outputs are load levels (states) of the distribution system zones. According to a sensitivity analysis of optimum topology with respect to change in Zpi and ZQi it is seen that the sensitivity near peak values of Zpi and ZQi is much greater than lower values. Thus four load levels with 40%, 25%, 20% and 15% sizes from zero to peak values of Zpi andZQi are assumed [21].
A training set including desired inputs and outputs of estimator is generated and is taught to the load level estimator neural network. The estimator neural network must measure the similarity of the new input pattern to the previously learned patterns, and show the most similar load level to the load level of the new input. A well-trained estimator can generalize the learned data as knowledge, and express correct and wise output for the new input. In other words, this estimator neural network is a “maximum likelihood estimator” or a “minimum distance estimator” [19,20]. The Zone Load Level Estimator System is presented separately in an individual paper in[21].
D. Distribution System Optimum Topology
Determinator (Block 3)
The block No. 3 (in Figure 3) determines the optimum topology of the distribution system using zones' loads (states of the system) which is given by the load level estimator block. Single-output neural networks can be designed for every switch of the distribution system, in which zero or one state of the output stands for open or close state of the switches. This design makes the control system very large. Also there is not any control on the constraints: radiality of distribution system and connectivity of all nodes to the graph of the system.A better way is using a merged neural network having a number of outputs just equal to the number of optimum topologies. In this network, the output having greater value indicates corresponding optimum topology. The output of this neural network must be given to a decoder system for recognizing and displaying the greatest output as a number indicating the number of optimum topology. The overall system can be merged and implemented as a unique neural network that has one linear output, which indicates the number of optimum topology. The number of inner layers and the number of neurons in each of them are determined by a combination of pruning and cascade correlation methods. Reducing the dimensions of the neural network by deleting neurons, which have the least effect on the output, is called “pruning”. Also cascade correlation method is based on network growth. Finally, running an entire trial and error
procedure is necessary for optimizing the number of inner layer neurons. [19, 20]
The training set of this neural network is an input/output set, in which the inputs are various zones load levels (states) and the outputs are optimum topologies corresponding to each series of load levels (each state). ESEM method (Section 2-D) has been used for generating this set.
4. NUMERICAL EXAMPLE
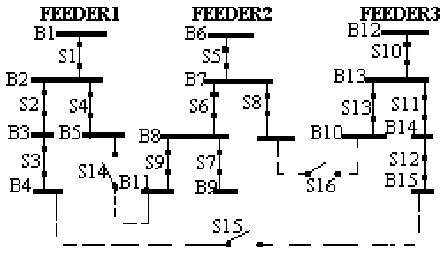
The three feeder distribution system of Figure 4 containing 16 switches and 13 zones has been used in this study as an illustrative numerical example.[4]. Various topologies and methods have been used for designing the neural network such as: Radial Basis Functions (RBFs), Kohonen self-organizing neural networks and Multi Layer Perceptrons (MLPs). In this work, it has been concluded that MLP is the best for this application in terms of learning and generalizing capabilities..
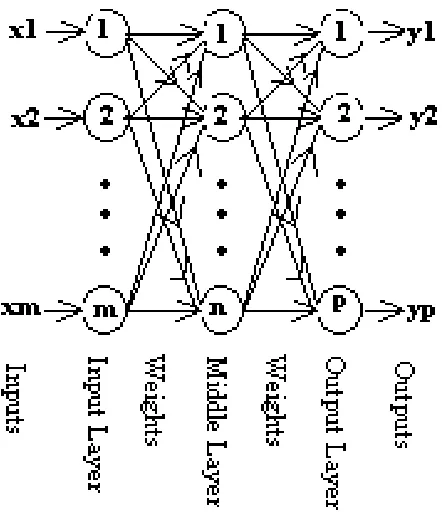
In a Multi Layer Perceptron (MLP), neurons are suited in layers. Each neuron link to its back and front layer neurons through the weights. Output of each neuron is a weighted summation of its inputs, which is passed through a non-linear transfer function. The transfer function that is selected in this work is sigmoid function. Figure 5 shows a three-layer MLP neural network, having “m” input nodes, “n” middle layer nodes, and “p” output layer nodes.
In order to learn the ANNs, Error Back
Propagation learning algorithm with momentum is used. Error Back Propagation algorithm, includes these three functions: Feed Forward, Compute Gradients and Update Weights. [19,20].
In addition to back-propagated error, a momentum term is added to weights and biases, in the iterative learning process. This momentum term is for giving some kind of inertia to the optimization process movement in the hyper-surface of weights and biases.
Also, a noise term (output of a random number generator) is fed to the neural network input. This input noise prevents the learning process from being entrapped in local minimums and also over-fitting to the training set data.
The state estimator neural network (classifier) proposed in this paper is a three-layer perceptron having two nodes in the input layer, three nodes (neurons) in the middle layer, and four nodes (neurons) in the output layer. This ANN contains seven sigmoid neurons, 18 weights and seven biases.[21].
For training the optimum topology determinator
(Block 3 in Figure 3), a training set is generated using the ESEM method (described in Section 2-D. and Figure 2 flowchart). This training set is taught to the optimum topology determinator, which is a MLP neural network. In fact, several methods could be used for generating the ANN training set. Stronger and more precise methods generate better results for the training set, and make the optimizer neural network stronger and better.
Teaching all of feasible combinations of the load levels (feasible system states) is extremely time consuming and impractical. Therefore, the load pattern concept is used, so that each of the distribution system zones has one of the residential, commercial or industrial load patterns by constant P-Q load models. It is enough to teach the set of various combinations of the load levels to the estimator neural network.
Studying example distribution system shows that there are eight optimum topologies totally. Appendix 1 shows the state of network switches in each optimum topology. Also it is seen that only nine of the network switches change state, these switches are called “critical switches”. In a distribution system automation project, the control signals are applied to this switch only. This is one of the advantages of the presented method.
The final designed neural network for the optimum topology determinator (block 3 in Figure 3) is a four-layer perceptron. In the above-mentioned neural network, the input layer has 13 nodes, layer two has 11 nodes (sigmoid neurons), layer three has 8 nodes (sigmoid neurons) and layer four (output) has one node (linear neuron). The output number of the output neuron indicates the number of optimum topology (topology 1, 2, …, 8). The given neural network has totally 20 (=11+8+1) neurons.
In [12] a line loss optimizer system by reconfiguration has been proposed having 276 process elements (neurons). Also in [10] a line loss optimizer system has been presented by capacitor control, having 472 process elements. In our work, line loss and load balance optimization (two objective functions) is performed by 111 process elements only. As such, the optimizer system, which is proposed in this paper, is much smaller than similar systems.
In order to test the designed system performance considers the measured data in two different times during the day: series one at 16 O’clock and series two at 23 O’clock. All of zone loads are calculated in zone load calculation stage (Block 1 in Figure 3), and then, are given to the load level estimator (Block 2 in Figure 3), whose outputs are load levels of various zones.
Input and output values of the estimator are shown as time series in Figure 6. As you see, the desired and estimated values are the same and the
classification precision is 100%.
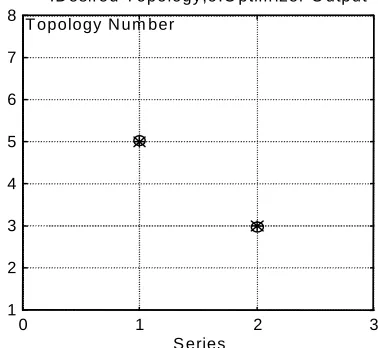
Then the estimated load levels are given to the optimum topology determinator neural network (Block 3 in Figure 3). Figure 7 shows the desired optimum topologies and suggested optimum topologies of the optimizer system, for both times of the day in one coordinate. It can be seen, that the points are the same, i.e., the suggested topology for both times are exactly optimum.
5. SUMMARY
The final results of optimization in two different times of the day are shown in Table 1. According to this table in 16 O’clock, topology number 5 with 2.50% loss reduction and 23 O’clock, topology number 3 with 3.44% loss reduction has been the best topology of the system that are global optimum and ESEM method gives the same answers.
In addition to the high precision of the optimization and low dimensions of the optimizer system with respect to similar systems, its short optimization time is important too. Almost all of the optimization methods presented in the literature are based on iterative calculations, but the proposed method performs calculations in only a feed-forward iteration. Some of the calculation times found in the literature are: Genetic Algorithms: 61 minutes (3660 seconds) and simulated annealing: 227 minutes (13620 seconds) [8, 9].
The calculation time of the optimizer system presented in this paper for a sample system simulated on a IBM compatible Personal Computer with Pentium 233 MHz CPU and 32 MB RAM is a fraction of a second (less than 0.5 second). Using a real system implementing neural network hardware
0 5 10 15 20 25 0
0.5 1
Zones Zone
Loads
+ : Real Power (P), o : Imaginary Power(Q)
0 5 10 15 20 25 1
2 3 4
Zones Estimator
Outputs
* : Desired Output, o : Suggested Output
Figure 6. Time series of inputs (above: (+: P and o: Q)) and outputs (below (*: Desired and o: Suggested)) of the estimator.
0 1 2 3
1 2 3 4 5 6 7 8
S eries T opology N um ber
*:D esired T opology,o:O ptim izer O utput
Figure 7. Outputs of the optimizer system for two hours of a day.
TABLE 1. Final Results of the Optimization.
TIME Optimum Topology
Loss Reduction 16
O’CLOCK
No. 5 2.5%
23 O’CLOCK
(or exactly saying firmware), the calculation time will reduce to propagation delay time of their building block Integrated Circuits (ICs). This time is about a few microseconds for LSI and VLSI implemented ICs.
Besides, this system can operate under crises and fault conditions of the distribution system and estimate faulted distribution system state and suggest its optimum topology. This property is gained from the extrapolation capability of the neural networks that is discussed in another paper. [21]
6. CONCLUSIONS
Taking two objective functions (1) loss reduction and (2) load balance, an optimization problem is formulated and solved by using the corresponding constraints by a novel approach in this paper. The proposed method has established a relation between two applications of neural networks: Optimization and Pattern Recognition. The advantages of the presented method are as follows:
1. Having two objective functions instead of one 2. Calculation speed is higher than other methods because optimization is performed in one iteration. Thus suitability for real-time applications.
3. Very high precision
4. Recognizing distribution network critical switches and reducing signal communication system dimensions
5. Small dimensions of calculation and control system
6. Simplicity of calculation and control hardware implementation in ICs
7. Reaching to the global optimum learned to it
8. Capability of solving distribution system contingency conditions through neural networks' generalization property
9. Independence from primary state of distribution system
7. ACKOWLEDGMENT
Authors wish to thank Dr. Hamid Soltanianzadeh, ECE Dep., Faculty of Engineering, University of Tehran for his useful and valuable suggestions in preparing the proposed paper.
8. REFERENCES
1. Merlin, A. and Back, H., “Search for Minimal-Loss Operating Tree Configuration in Urban P ower Distribution Systems”, Proceedings of 5th Power Systems Computer Conference (PSCC), Cambridge, (1975). 2. Shirmohammadi, D., Hong, H. W., Semylen, A. and Lou,
G. X., “A Compensated-Based Power Flow Method for Weakly Meshed Distribution and Transmission Networks”, IEEE Transactions on Power Systems, Vol.3,No. 2, (May 1988), 753-762.
3. Shirmohammadi, D., Hong and H. W., “Reconfiguration of Distribution Networks for Resistive Line Losses Reduction”, IEEE Transactions on PWRD, Vol. 4, No.2, (April 1989), 1492-1498.
4. Cinvanlar, S., Grainger, J. J., Yin, H. and Lee, S. S. H., “Distribution Feeder Reconfiguration for Loss Reduction” IEEE Transactions on PWRD, Vol. 3, No. 3, (July 1988), 1217-1223.
5. Baran, M. E. and Wu, F., “Network Reconfiguration in Distribution Systems for Loss Reduction and Load Balancing”, IEEE Transactions on PWRD, Vol. 4, No. 2 (April 1989), 1401-1407.
6. Chiang, H. D. and Jumeau, R. J., “Optimal Network Reconfiguration in Distribution Systems, Part 2: Solution Algorithms and Numerical Results”, IEEE Transactions on PWRD, Vol. 5, No. 3, (July 1990), 1568-1574.
APPENDIX 1. Status of Switches in Various Topologies.
7. Jiang, D. and Baldick, R., “Optimal Electric Distribution System Switch Reconfiguration and Capacitor Control”, IEEE Transactions on Power Systems, Vol. 11, No. 2, (May 1996), 890-897.
8. Nara, K., Kitagava, M., “Distribution system Loss Minimum Re-configuration by Simulated Annealing Method”, Proceedings of IEE International Conference on Advances in Power Systems Control, Operation and Management, Printed in Hong Kong, (Nov. 1991), 461-466.
9. Nara, K., Shoise, A., Kitagava, M. and Ishihara, T., “Implementation of Genetic Algorithm for Distribution System Loss Minimum Re-configuration”, IEEE Transactions on Power Systems, Vol.7, No. 3, (August 1992), 1044-1051.
10. Santoso, N. I. and Tan, O. T., “Neural-Net Based Real-Time Control of Capacitors Installed on Distribution Systems”, IEEE Transactions on PWRD, Vol. 8, No. 4, (October 1993), 266-272.
11. J u n g, K . H . , K i m, H . a n d K o , Y . , “ N e t wo r k Reconfiguration for Automated Distribution Systems Based on Artificial Intelligence Approach”, IEEE Transactions on PWRD, Vol. 8, No. 4, (October 1993), 1933-1941.
12. Kim, H., Ko, Y. and Jung, K. H., “Artificial Neural-Network Based Feeder Reconfiguration for Loss Reduction in Distribution Systems”, IEEE Transactions on PWRD, Vol. 8, No. 3, (July 1993), 1356-1365. 13. Bouchard, D., Chikhani, A., John, V. and Salama, M.,
“Application of Hopfield Neural Networks to Distribution Feeder Reconfiguration”, Proceedings of ANN93, Application of Neural Networks to Power Systems, Second Forum on, (1993), 311-315.
14. Wang, G. S., Wang, P. Y., Song, Y. H. and Johns, A. T., “Coordinated System of Fuzzy Logic and Evolutionary Programming Based Network Reconfiguration for Loss Reduction in Distribution Systems”, IEEE Conference, Proceedings, 0-7803-3645-3/96, (1996), 1838-1844.
15. Zhou, Q., Shirmohammadi, D. and Liu, W. H., “Distribution Feeder Reconfiguration for Service Restoration and Load Balancing”, IEEE Transactions on Power Systems, (May 1997), 724-729.
16. Lin, W. M. and Chin, H. C., “A New Approach for Distribution Feeder Reconfiguration for Loss Reduction and Service Restoration”, IEEE Transactions on PWRD, Vol. 13, No. 3, (July 1998), 870-875.
17. McDermott, T. E., Drezga, I. and Broadwater, R. P. “A Heuristic Nonlinear Constructive Method for Distribution System Reconfiguration”, IEEE Transactions on Power Systems, Vol. 14, No. 2, (May 1999).
18. Popvic, D. S. and Ciric, R. M., “A Multi-Objective Algorithm for Distribution Network Restoration”, IEEE Transactions on PWRD, Vol. 14, No. 3, (July 1999). 19. Bose, N. K. and Liang, P., “Neural Network Fundamentals
with Graphs, Algorithms and Applications”, Chapters 4, 5 and 6, McGraw-Hill Book Co., Printed in Singapore, (1996).
20. Hush, D. R. and Horn, B. G., “Progress in Supervised Neural Networks”, IEEE Signal Processing Magazine, (January 1993)
21. Freidunian, A. R., Lesani, H. and Lucas, C., “Designing Two Intelligent MLP and RBF Classifiers for Distribution System State Estimation, And Comparing Their Characteristics”, Journal of Faculty of Engineering, University of Tehran, ISSN 1026-0803, Vol. 33, No. 4, (March 2000), 9-20.
22. Freidunian, A. R., “Distribution Systems Intelligent Optimization and Automation Using Neural Networs”, M.S. Thesis, Electrical and Computer Engineering Department, Faculty of Engineering, University of Tehran, Tehran, Iran, (1997).