Informative Graph-based Features
⋆Lixin Cui1, Yuhang Jiao1, Lu Bai1, Luca Rossi2, and Edwin R. Hancock3
1
Central University of Finance and Economics, Beijing, China 2
Aston University, Birmingham, UK 3
University of York, York, UK
Abstract. In this paper, we propose a novel method to adaptively select the most informative and least redundant feature subset, which has strong discriminating power with respect to the target label. Unlike most traditional methods using vectorial features, our proposed approach is based on graph-based features and thus incorporates the relationships between feature samples into the feature se-lection process. To efficiently encapsulate the main characteristics of the graph-based features, we probe each graph structure using the steady state random walk and compute a probability distribution of the walk visiting the vertices. Further-more, we propose a new information theoretic criterion to measure the joint rele-vance of different pairwise feature combinations with respect to the target feature, through the Jensen-Shannon divergence measure between the probability distri-butions from the random walk on different graphs. By solving a quadratic pro-gramming problem, we use the new measure to automatically locate the subset of the most informative features, that have both low redundancy and strong discrim-inating power. Unlike most existing state-of-the-art feature selection methods, the proposed information theoretic feature selection method can accommodate both continuous and discrete target features. Experiments on the problem of P2P lend-ing platforms in China demonstrate the effectiveness of the proposed method.
1
Introduction
Many real-world applications, including image processing, bioinformatics analysis, face recognition, and P2P lending analysis [16], are represented by high dimensional data. However, only a small number of features are really significant to describe the target label [12]. One way to overcome this problem is to use feature selection.
Mutual information (MI) [8, 18, 15, 9] is a well-known means of measuring the mu-tual dependency of two variables, and has received much attention for developing new feature selection methods. Typical examples include 1) the Information-based Feature Selection method (MIFS) [8], 2) the Maximum-Relevance Minimum-Redundancy Fea-ture Selection method (MRMR) [18], 3) the Joint-Information FeaFea-ture Selection method (JMI) [20], and 4) the MIFS method under the assumption of a uniform distribution for input features (MIFS-U) [14]. Unfortunately, these methods suffer from two widely known drawbacks. First, these methods require the number of selected features in ad-vance. Second, these methods mine subsets of the most informative features in a greedy
⋆
manner [10]. To overcome the shortcomings, Liu et al. [15] have developed the Adap-tive MI based Feature Selection method (AMIF) that can automatically determine the size of most informative feature subsect, by maximizing the average pairwise informa-tiveness. Zhang and Hancock [21] have developed a Hypergraph based Information-Theoretic Feature Selection method (HITF) that can automatically determine the most informative feature subset through dominant hypergraph clustering [17].
Unfortunately, the aforementioned information theoretic feature selection methods cannot incorporate the relationship between pairwise samples of each feature
dimen-sion. More specifically, for a dataset withNfeatures denoted asX ={f1, . . . ,fi, . . . ,fN},
each featurefihasM samples asfi ={fi1, . . . , fia, . . . , fib, . . . , fiM}T.
Traditional-ly, existing information theoretic feature selection methods accommodate each feature
fi as a vector, and thus ignore the relationship between pairwise samplesfia andfib
infi. This drawback limits the precise information theoretic measure between pairwise
features. To address this shortcoming, Cui et al. [11] have proposed a new feature se-lection method in terms of graph-based features. They transform each vectorial feature into a graph structure that encapsulates the relationship between pairwise samples from the feature. The most relevant vectorial features are identified by selecting the graph-based features that are most similar to the graph-graph-based target feature, in terms of the Jensen-Shannon divergence measure between graphs. Unfortunately, this method can-not adaptively determine the most relevant feature subset. It is fair to say that developing effective information theoretic feature selection method still remains a challenge.
This paper aims to overcome the shortcomings of existing information theoretic feature selection methods by developing a new algorithm that can incorporate the re-lationship between feature samples into the feature selection process. In summary, the
main contributions are threefold. First, like Cui et al. [11], for the above dataset X
having N features, we transform each vectorial featurefi into a graph-based feature
Gi. Here,Giis a complete weighted graph, where each vertexva represents a
corre-sponding samplefiainfiand each weighted edge{va, vb}represents the relationship
between pairwise samplesfiaandfib. We use the Euclidean distance to measure the
re-lationship betweenfiaandfib. Similarly, for the target featureY(e.g., the class labels),
we also compute a target feature graphGY. We argue that the graph-based features can
reflect richer characteristics than the original vectorial features. Furthermore, for the
feature graphsGi andGY, we probe each graph structure in terms of the steady state
random walk (SSRW) [3] and compute a probability distribution of the walk visiting the
vertices. Second, with the probability distributions of the feature graphsGiandGY to
hand, we propose a new information theoretic criterion to measure the joint relevance of different pairwise feature combinations with respect to the target feature, through the Jensen-Shannon divergence (JSD). Third, we use the new information theoretic measure to automatically locate the subset of the most informative and less redundant features by solving a quadratic program problem [17]. We show that, unlike most existing fea-ture selection methods, the proposed feafea-ture selection method can accommodate both continuous and discrete target variables. Experimental results on the analysis of P2P lending platforms in China demonstrate the effectiveness of the proposed method.
2
Preliminary Concepts
2.1 The Steady State Random Walk (SSRW)
As mentioned in the previous section, we propose to use the SSRW to capture the main characteristics of the graph-based features. The main advantages of using SSRWs are twofold. First, SSRWs can accommodate weighted information residing on edges. Second, the computational complexity of probing a graph structure using SSRWs is quadratic in the number of vertices, i.e., SSRWs can be efficiently performed on graphs. As a result, SSRWs represent an elegant way of efficiently characterizing the graph-based features. Below, we review the main concepts underpinning SSRWs.
LetG(V, E)be a weighted graph,V be the vertex set, andEbe edge set. Assume
ω : V ×V → R+ is a edge weight function. Ifω(u, v) > 0 (ω(u, v) = ω(v, u)),
we say that(u, v)is an edge of G, i.e., the verticesu ∈ V andv ∈ V are adjacent.
The vertex degree matrix of Gis a diagonal matrixD whose elements are given by
D(v, v) = d(v) = ∑u∈V ω(v, u). Based on [3], the probability of the steady state
random walk visiting each vertexvisp(v) =d(v)/∑u∈V d(u). Furthermore, from the
probability distributionP = {p(1), . . . , p(v), . . . , p(|V|)}, we can straightforwardly
compute the Shannon entropy ofGas
HS(G) =−
∑
v∈V
p(v) logp(v). (1)
2.2 The Jensen-Shannon Divergence
In information theory, the JSD is a dissimilarity measure between probability
distri-butions. Let two (discrete) probability distributions beP = (p1, . . . , pa, . . . , pA)and
Q= (q1, . . . , qb, . . . , qB), then the JSD betweenP andQis defined as
ID(P,Q) =HS (P+Q 2 ) −1 2HS(P)− 1 2HS(Q), (2) whereHS(P) = ∑A
a=1palogpais the Shannon entropy of the probability distribution
P. In [3], the JSD has been used as a means of measuring the information
theoret-ic dissimilarity between graphs associated with their probability distributions. In this work, we are also concerned with the similarity measure between graph-based features. Therefore, we transform the JSD into its negative form and obtain the corresponding
exponential function value to denote the information theoretic similarity measure IS
between probability distributions, i.e.,
IS(P,Q) = exp{−ID(P,Q)}. (3)
3
Methodology of The Proposed Feature Selection Method
3.1 Graph-based Features from Vectorial FeaturesIn this subsection, we introduce how to transform each vectorial feature into a complete weighted graph. The advantages of using the graph-based representation are twofold.
First, graph structures have stronger ability to encapsulate global topological informa-tion than vectors. Second, the graph-based features can incorporate the relainforma-tionships between samples of each original vectorial feature into the feature selection process, thus reducing information loss.
Given a dataset ofN features denoted asX = {f1, . . . ,fi, . . . ,fN} ∈ RM×N,fi
represents thei-th vectorial feature and hasMsamples asfi={fi1, . . . , fia, . . . , fib, . . . , fiM}T.
We transform each featurefiinto a graph-based featureGi(Vi, Ei), where each vertex
via∈Viindicates thea-th samplefiaoffi, each pair of verticesviaandvivis
connect-ed by a weightconnect-ed connect-edge(via, vib) ∈ Ei, and the weightω(via, vib)of(via, vib)is the
Euclidean distance betweenfiaandfib, i.e.,
ω(via, vib) =∥fia−fib∥2. (4)
Similarly, if the sample values of the target featureY={y1, . . . , ya, . . . , yb, . . . , yM}T
are continuous, its graph-based featureGˆ( ˆV ,Eˆ) can be computed using Eq.(4) and
each vertexvˆarepresents thea-th sampleya. However, for classification problems, the
sample of the target feature Y is the class labelc and thus takes the discrete value
c = 1,2, . . . , C, i.e., the samples of each featurefibelong to theCdifferent classes.
In this case, we propose to compute the graph-based target featureGˆi( ˆVi,Eˆi)for each
featurefi, where the weightω(ˆvia,ˆvib)of each edge(ˆvia,vˆib)∈Eˆiis
ω(ˆvia,vˆib) =∥µia−µib∥2, (5)
whereµiais the mean value of all samples infifrom the same classc.
Note that, constructing the graph-based feature from the original vectorial feature is an open problem. In fact, in addition to the distance measure employed in this paper, one could employ a number of alternative measures, e.g., covariance, cosine similarity, etc. Moreover, instead of a complete graph, one may want to define a sparser graph.
3.2 The Information Theoretic Criterion for Feature Selection
We propose to use the following information theoretic criterion to measure the joint relevance of different pairwise feature combinations with respect to either the continu-ous or discrete target feature. For a set ofN featuresf1, . . . ,fi, . . . ,fj, . . . ,fN and the
associated continuous target featureY, the relevance degree of a feature pair{fi,fj}is
Wi,j=IS(Gi,Gˆ)×IS(Gj,Gˆ)×ID(Gi,Gj), (6)
whereGiandGˆare the graph-based features offiandY,ISis the JSD based
informa-tion theoretic similarity measure defined in Eq(3), andIDis the JSD based information
theoretic dissimilarity measure defined in Eq(2). The above relevance measure consists
of three terms. The first and second termsIS(Gi,Gˆ)andIS(Gj,Gˆ)are the relevance
degrees of individual featuresfiandfjwith respect to the target featureY,
respective-ly. The third termIS(Gi,Gj)measures the non-redundancy between the feature pair
{fi,fi}. Therefore,Wfi,fj is large if and only if both IS(Gi,Gˆ)andIS(Gj,Gˆ)are
large (i.e., bothfi andfj are informative themselves with respect to the target feature
For classification problems, the samples of the target featureY take the discrete
valuecandc= 1,2, . . . , C. In this case, we compute the individual graph-based target
featureGˆifor each featurefi, and the relevance measure defined in Eq.(6) can re-written
as
Wi,j={S(fi)IS(Gi,Gˆi)} × {S(fj)IS(Gj,Gˆj)} × {ID(Gi,Gj)}, (7)
whereS(fi)is the Fisher score of featurefi[13] and is defined as
S(fi) = L ∑ c=1 nl(µl−µ)2/ C ∑ c=1 ncσ2c, (8)
whereµcandσ2c are the mean and variance of the samples belonging to thec-th class
in feature fi, µ is the mean of feature fi, and nc is the sample number of the c-th
class in featurefi. For Eq.(8), the Fisher scoreS(fi)indicates the quality of the
graph-based target featureGˆi for fi, i.e., a higher Fisher scoreS(fi)means a better target
feature graphGˆi. This follows the definition of Eq.(5). More specifically, the
graph-based target feature Gˆi of original vectorial feature fi is preferred, if the distances
between samples in different classes are as large as possible and the distances between data points in the same class are as small as possible. Similar to Eq.(6), the three terms of Eq.(7) have the same corresponding theoretical significance.
3.3 Determination of the Most Informative Feature Subset
We adaptively determine the most informative subset of features by solving a quadratic program problem [17]. More specifically, for a set ofNfeaturesf1, . . . ,fi, . . . ,fj, . . . ,fN
and the target featureY, we commence by transforming each feature into a graph-based
feature. Moreover, based on the graph-based features, we construct a feature
informa-tiveness matrixW, where each elementWi,j∈Wrepresents the information theoretic
measure between a feature pair{fi,fj}based on Eq.(6) (forYis continuous) or Eq.(7)
(forYis discrete). As we have stated in Section 3.2,Wfi,fj is large if and only if both
fiandfj are informative themselves with respect to the target featureY, andfiandfj
are not redundant. Therefore, we locate the most informative feature subset by finding the solution of the following quadratic program problem [17]
max f(a) = 1 2a
TWa (9)
subject toa∈RN,a≥0and∑N
i=1ai= 1. The solution vectorato the above
quadrat-ic program is anN-dimensional vector. Whenai>0, thei-th featurefibelongs to the
most informative feature subset. Therefore, the number of the selected featuresncan
be determined by counting the positive components of vectora. Pavan and Pelillo [17]
have shown that the local maximum off(a)can be solved using the following equation
ai(t+ 1) =ai(t)
(Wa(t))i
a(t)TWa(t). (10)
whereai(t)corresponds to thei-th featurefi at iterationtof the update process.
subsets, i.e.,S1(a) ={fi |ai > 0}andS2(a) ={fj |aj = 0}. Clearly, the setS1
that has nonzero variables is the selection of the most informative feature subset. The
features inS1have both low redundancy and strong discriminative power.
3.4 Complete Feature Ranking
The proposed feature selection method aims to adaptively select a compact most
infor-mative feature subset that falls into the subsetS1(a) ={fi|ai >0}. We can rank the
feature fi ∈ S1 by evaluating the values of their indicatorsai. A higher indicatorai
means a more informative feature. Moreover, we can also rank the features contained
in the unselected feature subsetS2(a) ={fj |aj = 0}based on the selection method
in [15]. More specifically, we compute the reward of each featurefj ∈S2as
rj=
∑
fi∈S1,ai>0
Wi,jai, (11)
which summarizes the pairwise informativeness between the featurefj ∈S2and each
featurefi ∈S1. A higherrjmeans a more informative feature inS2, thus providing a
measure to rank the features inS2. Based on the feature ranking ofS1andS2, we can
obtain a Complete Feature Ranking ListL, from1to a user-specified number.
4
Experimental Evaluations
To validate the effectiveness of the proposed feature selection approach, we perform the following experimental evaluation on a P2P dataset collected from the Peer-to-Peer
(P2P) lending sector in China. The reasons for using this dataset are twofold.First,
P2P lending data are usually high-dimensional, highly correlated, and unstable, thus representing a challenge for traditional statistical and machine learning techniques. To better analyze the P2P data, the sample relationship of the P2P data encapsulating sig-nificant information should be incorporated, when designing feature selection methods. Unfortunately, most existing feature selection methods ignore the sample relationships and may cause significant information loss. By contrast, our proposed adaptive feature selection method is able to encapsulate the sample relationship of P2P data and
over-come these shortcomings.Second, the P2P lending industry in China has developed
rapidly since 2007, with more than 3,000 P2P lending platforms and an accumulative loan amount of 12 trillion by 2015. It is of great significance to develop an effective decision aid for the credit risk analysis of the P2P platforms.
TheP2P datasetis collected from a reputable P2P lending portal in China1, which consists of the most popular 200 platforms (i.e., 200 samples) until Aug 2014. For each platform, we collect 19 features including 1) transaction volume, 2) total turnover, 3)average annualized interest rate, 4) total number of borrowers, 5) total number of in-vestors, 6) online time, which refers to the foundation year of the platform, 7) operation time, i.e., number of months since the foundation of the platform, 8) registered capital, 9) weighted turnover, 10) average term of loan, 11) average full mark time, i.e., tender
1
period of a loan raised to the required full capital, 12) average amount borrowed, i.e., average loan amount of each successful borrower, 13) average amount invested, which is the average investment amount of each successful investor, 14) loan dispersion, i.e., the ratio of the repayment amount to the total capital, 15) investment dispersion, the ratio of the invested amount to the total capital, 16) average times of borrowing, 17) average times of investment, 18) loan balance, and 19) popularity.
4.1 Identification of The Most Influential Factors for Credit Risk
We evaluate the performance of the proposed feature selection approach with respect to
continuous target features. Specifically, we use the proposed method to perform credit risk evaluation of the P2P lending platforms. As it is difficult to obtain sufficient data of the platforms which encountered problem, we use the annualized average interest rate as an indicator of the credit risk of the P2P lending platforms. In finance, interest rate is the amount charged, expressed as a percentage of principal, by a lender to a borrower for the use of assets. When the borrower is a low-risk party, they will usually be charged a low interest rate. On the other hand, if the borrower is considered high risk, the in-terest rate charged will be higher. Likewise, a higher annualized average inin-terest rate of the P2P lending platforms often indicates greater likelihood of default, i.e., higher credit risk of the platforms. Identifying the most relevant features to the interest rate can help investors effectively manage the credit risks involved in P2P lending. There-fore, in our experiment, we set the average annualized interest rate as the target feature which takes continuous values. Our purpose is to identify the most informative subset of features for the credit risk of the P2P platforms by using the proposed feature selec-tion method. To further strengthen our findings, we also compare the proposed adaptive feature selection method associated with the SSRW (AFS-RW) with three alternative methods. These include correlation analysis (CA) and multiple linear regression (ML-R), which are simple but widely applied. Furthermore, we also compare the proposed method to the most relevant graph-based feature selection method associated with the SSRW (FS-RW) [11], since it can also accommodate the continuous target feature.
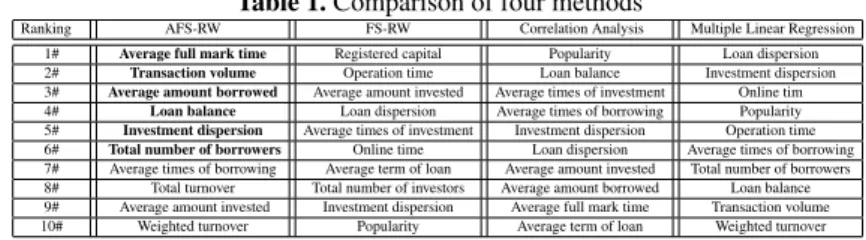
Table 1 presents a comparison of the results obtained using these methods. For each method, we display the top 10 features in terms of correlation to the average annualized interest rate. Because the number of the most informative features adaptively located by AFS-RW is six, we display these results in bold. It is worth noting that the most influ-ential factors located by the proposed AFS-RW method is in general different from the remaining three methods used for comparison. This is due to the unique characteristics of the proposed feature selection method which encourages the most informative and least redundant features to be selected. For instance, AFS-RW identifies average full mark time, transaction volume, and average amount borrowed as the most informative features. This is reasonable because a longer full mark time of the loan often reflects a higher level of credit risk and a higher amount of total transaction volume and a higher level of the average amount borrowed indicate a higher preference of both the borrow-ers and investors for the P2P lending platform due to a higher degree of security. Also, AFS-RW and CA consider loan balance as a relevant feature. This is also reasonable because a higher amount of loan balance often indicates a higher level of credit risk and can result in a higher interest rate. In addition, the total number of borrowers reflects
the borrowers preference for the P2P lending platforms and is a significant influential factor. A platform with a relatively low average annualized interest rate is often more attractive to the borrowers because this indicates both a lower transaction cost and a lower credit risk of the platform. However, only the proposed AFS-RW method is able to select this factor, whereas the remaining three methods rank this factor much lower. These results demonstrate the effectiveness of the proposed method for identifying the most influential factors for credit risk of P2P lending platforms.
Table 1.Comparison of four methods
Ranking AFS-RW FS-RW Correlation Analysis Multiple Linear Regression 1# Average full mark time Registered capital Popularity Loan dispersion 2# Transaction volume Operation time Loan balance Investment dispersion 3# Average amount borrowed Average amount invested Average times of investment Online tim 4# Loan balance Loan dispersion Average times of borrowing Popularity 5# Investment dispersion Average times of investment Investment dispersion Operation time 6# Total number of borrowers Online time Loan dispersion Average times of borrowing 7# Average times of borrowing Average term of loan Average amount invested Total number of borrowers 8# Total turnover Total number of investors Average amount borrowed Loan balance 9# Average amount invested Investment dispersion Average full mark time Transaction volume 10# Weighted turnover Popularity Average term of loan Weighted turnover
4.2 Classification for The Credit Rating of The P2P Lending Platforms
We evaluate the performance of the proposed feature selection approach with respect todiscrete target features. Specifically, we aim to locate the most informative subset of features for the credit rating of the P2P platforms in China, which takes discrete val-ues and is collected from the Report on the Development of the P2P lending industry in
China, 2014-2015, issued by theFinancial Research Institute of the Chinese Academy
of Social Sciences. In this Report, only 104 platforms are included due to the strict e-valuation criteria involved, among which only 42 platforms belong to the 200 platforms used in the above P2P dataset. Thus, we use the 42 platforms (i.e., samples) for the evaluation. We set the credit ranking for these platforms as the discrete target feature, and aim to locate the most informative feature subset using the proposed approach.
To evaluate the effectiveness of the features selected by the proposed approach, we set the discrete credit ranking targets as classification labels. Since there are only 42 samples and these need to be classified into four classes, it is a very challenging
classi-fication problem. In the experiment, we randomly select50%samples as training data
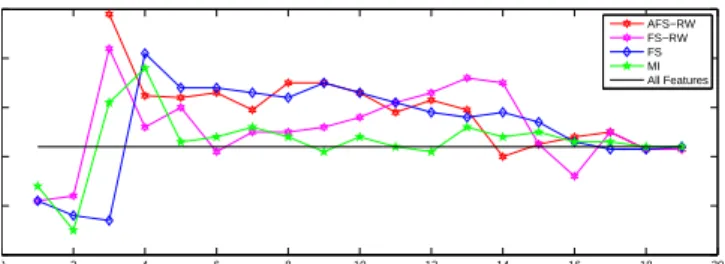
and the remainder as testing data. By repeating this selection process 10 times, we ob-tain 10 random partitions of the original data. For each partition, we identify the most relevant features via the proposed method based on the train data, and perform a 10-fold cross-validation using a C-Support Vector Machine (C-SVM) to evaluate the classifi-cation accuracy associated with the selected features based on the testing data, i.e., we use 9 folds for training and 1 fold for testing. For the C-SVM on each partition, we re-peat the process 10 times and compute the average classification accuracy. Finally, we compute the average classification accuracy over the 10 partitions. To further evaluate our study, we compare the proposed method (AFS-QW) with several alternative fea-ture selection methods. These alternative methods include: 1) the Fisher Score method (FS) [13], 2) the Mutual Information based method (MI) [19], and 3) most relevan-t graph-based fearelevan-ture selecrelevan-tion merelevan-thod (FS-RW) [11]. The classificarelevan-tion accuracy of each method is shown in Fig. 1 as a function of the number of features selected.
Fig. 1 indicates that the proposed method AFS-RW achieves the best classification
selected features. In contrast, FS and MI both require 4 features to generate best classi-fication accuracies. Like the proposed method, the FS-RW also achieves best accuracy with 3 features. However, only the proposed method can adaptively determine the most informative feature subset. Finally, recall that there are only 42 samples divided into 4 class for the evaluation, making this classification task very challenging. Thus, these results demonstrates the effectiveness of the proposed method.
0 2 4 6 8 10 12 14 16 18 20 0.1 0.15 0.2 0.25 0.3 0.35
Number of Selected Features
AFS−RW FS−RW FS MI All Features
Fig. 1.Accuracy vs. Number of Selected Features for Different Feature Selection Methods.
5
Conclusion
In this paper, we have proposed an adaptive feature selection method, based on a new information theoretic criterion between graph-based features. Unlike most existing in-formation theoretic feature selection methods, our approach has two advantages. First, it is based on graph-based features and thus incorporates the relationships between feature samples into the feature selection process. Second, it can accommodate both continu-ous and discrete target features. Experiments on the analysis of P2P lending platforms in China demonstrate the effectiveness of the proposed feature selection method.
We will extend our method in a number of ways. First, in our previous works [5, 4], we have developed a number of quantum Jensen-Shannon kernels using both the continuous-time and discrete-time quantum walks. It is interesting to extend the pro-posed feature selection method using the classical Jensen-Shannon divergence to that using its quantum counterpart. Second, we will also use our previous graph kernel mea-sures as the graph similarity meamea-sures for our feature selection frameworks [7, 2, 6]. We will explore the performance of our feature selection method associated with dif-ferent graph kernels. Third, the proposed feature selection method only considers the relationship between pairwise features, i.e., it only evaluates the two-order relationship between features. Our future work will extend the proposed method into a high-order feature selection method by establishing higher order relationship between features. Fi-nally, it is interesting to establish hypergraph-based features [1] and thus develop a new hypergraph-based feature selection method.
Acknowledgments
This work is supported by the National Natural Science Foundation of China (Grant no. 61602535 and 61503422), the Open Projects Program of National Laboratory of Pattern Recognition, the Y-oung Scholar Development Fund of Central University of Finance and Economics (No. QJJ1540), and the program for innovation research in Central University of Finance and Economics.
References
1. Lu Bai, Francisco Escolano, and Edwin R. Hancock. Depth-based hypergraph complexity traces from directed line graphs.Pattern Recognition, 54:229–240, 2016.
2. Lu Bai and Edwin R. Hancock. Fast depth-based subgraph kernels for unattributed graphs.
Pattern Recognition, 50:233–245, 2016.
3. Lu Bai, Luca Rossi, Horst Bunke, and Edwin R. Hancock. Attributed graph kernels using the jensen-tsallis q-differences. InProceedings of ECML-PKDD, pages 99–114, 2014. 4. Lu Bai, Luca Rossi, Lixin Cui, Zhihong Zhang, Peng Ren, Xiao Bai, and Edwin R.
Han-cock. Quantum kernels for unattributed graphs using discrete-time quantum walks. Pattern Recognition Letters, 87:96–103, 2017.
5. Lu Bai, Luca Rossi, Andrea Torsello, and Edwin R. Hancock. A quantum jensen-shannon graph kernel for unattributed graphs.Pattern Recognition, 48(2):344–355, 2015.
6. Lu Bai, Luca Rossi, Zhihong Zhang, and Edwin R. Hancock. An aligned subtree kernel for weighted graphs. InProceedings of ICML, pages 30–39, 2015.
7. Lu Bai, Zhihong Zhang, Chaoyan Wang, Xiao Bai, and Edwin R. Hancock. A graph kernel based on the jensen-shannon representation alignment. InProceedings of IJCAI, pages 3322– 3328, 2015.
8. Roberto Battiti. Using mutual information for selecting features in supervised neural net learning. IEEE Trans. Neural Networks, 5(4):537–550, 1994.
9. Boyan Bonev, Francisco Escolano, and Miguel Cazorla. Feature selection, mutual informa-tion, and the classification of high-dimensional patterns. Pattern Anal. Appl., 11(3-4):309– 319, 2008.
10. Gavin Brown. A new perspective for information theoretic feature selection. InProceedings of AISTATS, pages 49–56, 2009.
11. Lixin Cui, Lu Bai, Yue Wang, Xiao Bai, Zhihong Zhang, and Edwin R. Hancock. P2P lending analysis using the most relevant graph-based features. InProceedings of S+SSPR 2016, pages 3–14, 2016.
12. Jiuqi Han, Zhengya Sun, and Hongwei Hao. Selecting feature subset with sparsity and low redundancy for unsupervised learning.Knowl.-Based Syst., 86:210–223, 2015.
13. Xiaofei He, Deng Cai, and Partha Niyogi. Laplacian score for feature selection. In Proceed-ings of NIPS, pages 507–514, 2005.
14. Nojun Kwak and Chong-Ho Choi. Input feature selection by mutual information based on parzen window.IEEE Trans. Pattern Anal. Mach. Intell., 24(12):1667–1671, 2002. 15. Si Liu, Hairong Liu, Longin Jan Latecki, Shuicheng Yan, Changsheng Xu, and Hanqing Lu.
Size adaptive selection of most informative features. InProceedings of AAAI, 2011. 16. Milad Malekipirbazari and Vural Aksakalli. Risk assessment in social lending via random
forests.Expert Syst. Appl., 42(10):4621–4631, 2015.
17. Massimiliano Pavan and Marcello Pelillo. Dominant sets and pairwise clustering. IEEE Trans. Pattern Anal. Mach. Intell., 29(1):167–172, 2007.
18. Hanchuan Peng, Fuhui Long, and Chris H. Q. Ding. Feature selection based on mutual information: Criteria of max-dependency, max-relevance, and min-redundancy.IEEE Trans. Pattern Anal. Mach. Intell., 27(8):1226–1238, 2005.
19. Jouni Pohjalainen, Okko R¨as¨anen, and Serdar Kadioglu. Feature selection methods and their combinations in high-dimensional classification of speaker likability, intelligibility and personality traits. Computer Speech & Language, 29(1):145–171, 2015.
20. H. Yang and J. Moody. Feature selection based on joint mutual information. InProceedings of AIDA, pages 22–25, 1999.
21. Zhihong Zhang and Edwin R. Hancock. Hypergraph based information-theoretic feature selection.Pattern Recognition Letters, 33(15):1991–1999, 2012.