Spring 2019
The influence of surface reinforcement on concrete failure under
The influence of surface reinforcement on concrete failure under
shear loading
shear loading
James Buban
Iowa State University, [email protected]
Follow this and additional works at: https://lib.dr.iastate.edu/creativecomponents
Part of the Structural Engineering Commons
Recommended Citation Recommended Citation
Buban, James, "The influence of surface reinforcement on concrete failure under shear loading" (2019). Creative Components. 145.
https://lib.dr.iastate.edu/creativecomponents/145
by
James Buban
A Creative Component submitted to the graduate faculty
in partial fulfillment of the requirements for the degree of
MASTER OF SCIENCE
Major: Civil Engineering (Structural Engineering)
Program of Study Committee: Dr. An Chen, Major Professor
Dr. Jiehua Shen Dr. Bora Cetin
Iowa State University
Ames, Iowa
2019
TABLE OF CONTENTS
LIST OF FIGURES ... i
LIST OF TABLES ... iv ABSTRACT ... v
CHAPTER 1: INTRODUCTION ... 1
1.1 Background ... 1
1.1.1 Necessity of Cost-Effective Improvements in Construction Industry ... 1
1.1.2 Uses and Importance of Fastenings to Concrete ... 1
1.1.3 History of the Approaches used to Determine Shear Capacity of Concrete ... 3
1.1.4 Current Method used to Determine Concrete Breakout in Shear ... 6
1.1.5 Size Effect of Anchor Bolts ... 9
1.1.6 Current Standard Definition of Supplemental Reinforcement ... 11 1.1.7 Sizing and Capacity of Shear Reinforcement ... 18
1.2 Problem Statement ... 20
CHAPTER 2: FINITE ELEMENT ANALYSIS ... 21
2.1 Introduction ... 21
2.2 Model Design ... 22 2.2.1 Model Geometry ... 22 2.2.2 Model Properties ... 25
2.3 Finite Element Analysis Results ... 28
2.3.2 Control Model with Reinforcement 4in Spacing (Model 2, Figure 2.10) ... 30 2.3.3 Experimental Model with Reinforcement 6in Spacing (Model 3, Figure 2.13) ... 31 2.3.4 Experimental Model with Reinforcement 8in Spacing (Model 4, Figure 2.16) ... 33 2.3.5 Force vs. Displacement Results ... 35
CHAPTER 3: CONCLUSION ... 36
3.1 Overall Conclusion ... 36
3.1.1 Recommended Modification ... 38
3.2 Field Application ... 39
LIST OF FIGURES
Figure 1.1 - ACI 349-85 (Projected Area of Failure Cone) ... 3
Figure 1.2 - Concrete Failure Surface with Reductions for Edges ...4
Figure 1.3 - Idealized Concrete Failure Surface ...4
Figure 1.4 - Embedment Depth and Failure Load Curve... 10 Figure 1.5 - Lateral Distribution of Longitudinal and Edge Reinforcement – CEB ... 11 Figure 1.6 - The effect of reinforcement on load-bearing behavior of single anchors close to an edge – (Eligehausen 2006b) ... 12 Figure 1.7 - Lateral Distribution of Longitudinal and Edge Reinforcement - ACI 318-14 ... 13 Figure 1.8 - Hairpin Reinforcement Details tested ... 14
Figure 1.9 - ASCE Stirrup Reinforcement Detail using STM ... 15
Figure 1.10 - Development Length of Suppl. Reinf. using Hairpins ACI 318-14 ... 17
Figure 1.11 - Development Length for Hairpin Reinforcement beyond failure surface - CEB ... 17
Figure 1.12 - Stirrup Reinforcement Development Length - ACC ... 17
Figure 2.1 - Dimensions of Steel Anchor; All Model ... 22
Figure 2.2 - Dimensions of Concrete Block; All Models ... 23 Figure 2.3 - Dimensions of Stirrup Design used Throughout Study ... 24
Figure 2.4 - Edge Reinforcement Dimensions used Throughout Study ... 24
Figure 2.5 - Boundary Condition and Displacement Control (same for all models) ... 25
Figure 2.6 - Von Mises Stress for Steel Anchor (Model 2 results)... 27
Figure 2.7 - Concrete Tensile Damage Parameter for Model 1 ... 28
Figure 2.8 - Failure Surface predicted using the CCD Method ... 28
Figure 2.9 - Concrete Compressive Damage Parameter for Model 1 ... 29 Figure 2.10 - Diagram of Model 2 ... 30 Figure 2.11 - Concrete Tensile Damage Parameter for Model 2 ... 30 Figure 2.12 - Von Mises Stress in No. 5 Stirrups (left), Max stress on Single Stirrup (right) for
Model 2 ... 31 Figure 2.13 - Diagram of Model 3 ... 31 Figure 2.14 - Concrete Tensile Damage Parameter for Model 3 ... 32 Figure 2.15 - Von Mises Stress in No. 5 Stirrups (left), Max stress on Single Stirrup (right) for
Figure 2.16 - Diagram of Model 4 ... 33 Figure 2.17 - Von Mises Stress in No. 5 Stirrups (left), Max stress on Single Stirrup (right) for
LIST OF TABLES
Table 1.1 - Shear Breakout Equations used in ACI 318-14 ...6
Table 1.2. Shear Breakout Equations used in ACI 349-85 ...6
Table 1.3. Shear Breakout Equations used in CEB – “Design of Fastenings” ...6
Table 1.4. Shear Breakout Equations proposed for CCD Approach ...7
Table 1.5. Shear Breakout Equations used in “Anchorage in Concrete Construction” ...7
Table 1.6 - Development Length and Hanger Reinforcement Capacity ... 16
Table 1.7 - Shear Strength of Supplemental Reinforcement ... 19
Table 2.1 - Concrete Compressive Damage Properties and Parameter adjusted for fc’ = 4,000 psi (Zhang 2018) ... 26
Table 2.2 - Concrete Tensile Damage Properties and Parameter adjusted for fc’ = 4,000 psi (Zhang 2018) ... 26
ABSTRACT
Recently, construction costs have been at a global high – paired with increased global
demand, rise in cost of material and limited skilled labor – it has become of utmost paramount to
determine the solutions in the Civil Engineering industry to accommodate these changes and
relieve these costs. Fastening to concrete has been important part of the construction industry for
many years. Several standards have adopted a form of determining the strength of concrete
breakout such as: ACI 318, ACI 349, or European code “Design of Fastenings in Concrete.”
Many of these codes still reference testing and use equations that were developed in the early
1990’s. As technology in construction moves forward, so must the codes we use to design these
new structures. Therefore, this study will evaluate whether the code is too conservative and can
be expanded upon. Through the use of an FEA program, the effectiveness of shear anchor
reinforcement is investigated. The load-bearing capacity is currently limited to three specific
conditions: 1) No reinforcement present, 2) Edge reinforcement present, and 3) Edge
reinforcement and stirrups spaced at 4in max. There are significant gaps in between these
situations. Expanding condition 3) to include larger spacing would greatly benefit designers and
laborers. Finite Element Analysis models will be run with 4 in, 6 in, and 8 in spacing between
shear reinforcement stirrups. Peak loads will be extracted from each data and analyzed. Based on
comparisons with the results, FE and calculations, recommendations are provided on the
CHAPTER 1: INTRODUCTION
1.1 Background
1.1.1 Necessity of Cost-Effective Improvements in Construction Industry
Historically, the price of hot-rolled steel has fluctuated with the season; overall the
industry has seen a steady decline in steel pricing in the last decade, costing approximately
630.49 USD/MT (US dollar per metric ton) in 2013 to 380 USD/MT in February 2016.
However, in more recent history the price of steel has climbed to 833.11 USD/MT in 2018
(Focus Economics, 2019). According the World Steel Association, global steel demand is
forecasted to grow by 1.8% in 2018 & 0.7% in 2019 (General Steel, 2019). A rise in demand
may very well drive projected steel prices even higher. In addition to increased material costs,
recent industrywide surveys have indicated that skilled labor wages will continue to rise at a
steady pace due to significant shortage of qualified craft workers. According to the Labor
Statistics Bureau, in 2016 more than 200,000 construction positions remained unfilled. This is an
81% increase from the previous two years. A significantly high percentage that results in higher
labor wage costs and hinders the development of the industry (Pearman, 2018). Given these
major factors, cost of construction will continue to escalate – leading to a push for more
cost-effective designs. An area for cost reduction may be found in adjusting the design of concrete
fasteners.
1.1.2 Uses and Importance of Fastenings to Concrete
Concrete fasteners come in a large range of shapes, sizes, and applications such as:
embed plates with welded studs cast into the structure; post-installed wedge anchors used to
secure a piece of machinery to a concrete slab, or a drilled and epoxy rod used to attach a precast
“steel elements either cast into concrete or post-installed into a hardened concrete member and
used to transmit applied loads to the concrete” (ACI 318-11). The quantity and arrangement of
the anchor(s) is to be decided by the designer. Many factors need to be considered when
designing the anchorage. Assuming that the steel itself has sufficient strength to resist the applied
loads, the next failure mode is the portion of concrete affected by the transmittal of the loads.
Similar to other structural connections, the clear distance of the fastener relative to adjacent
edges or discontinuities will greatly affect the capacity of the connection. In the case of
anchorage in concrete, the location of the anchor relative to free edges or openings will dictate
how much load the concrete can resist. Other factors influencing capacity, such as: load
distribution, spacing and embedment depth are also considered in the overall capacity of an
anchor(s).
Cast-in-place anchors are becoming a prominent method used to make many different
types of structural connections. Engineers are always trying to take full advantage of a structural
connection and make the most economical and safe design possible. But the construction
industry today is using these same anchorage devices to resist larger loads due to advancements
in member design. Previous designs for anchorage devices are no longer adequate to support the
increased demand imposed by the member. Anchorage in concrete construction must continue to
develop in order to keep pace with the increased demand from the structural system, as well as,
1.1.3 History of the Approaches used to Determine Shear Capacity of Concrete
The behavior of cast-in-place headed stud anchors have been tested and analyzed for many years.
Up to and including most the 1980’s, fastenings in concrete were designed to be limited by the
steel itself. According to ACI 349-85 “Code Requirements for Nuclear Safety Related Concrete
Structures”, brittle failure of concrete was not allowed to govern the overall ductile steel failure
strength of the connection regardless of loading. “Bolts, studs, or bars shall meet the
requirements of B.5.1.1. The minimum edge distance, m, for shear loading toward a free edge
shall be such that the concrete design strength (based on a uniform tensile stress equal to
4 , acting on an effective area defined by projecting a 45° half-cone to the free surface from
the centerline of the tensile stress component at the shearing place) exceeds the ultimate shear
strength of the bolts, studs, or bars, (based on ),” (ACI 349-85). Ignoring the strength of
concrete required that anchors have deeper embedment and larger edge distances to satisfy code.
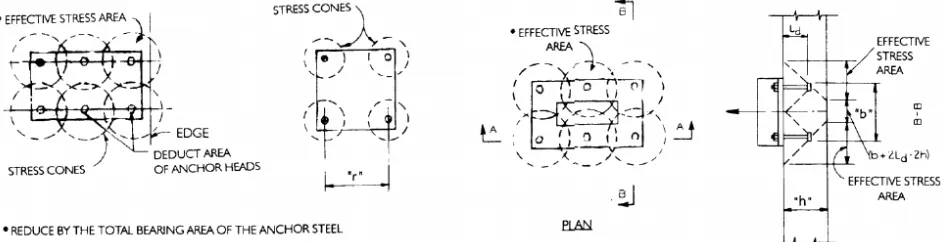
Under tension and shear, the concrete failure is governed by a cone formed at a 45° relative to
the direction of force with uniform stress equal to 4ϕ f over the projected failure surface.
Reductions in the projected area are made by accounting for free edges and overlapping cones
[image:10.612.80.551.545.666.2](See Figure 1.1). This methodology was the foundation on which anchor design was built on.
During the mid to late 1990’s there was a methodology shift in determining the strength of
anchored connections. This shift was driven by the demand for steel anchors to perform at a
higher level and the need for a more flexible and reliable method of calculation. The Concrete
Capacity Design (CCD) method (Fuchs, Eligehausen, & Breen 1995) was introduced as alternate
means of determining the strength of concrete. The CCD method combines the visualization of
the physical model represented by ACI 349-85, the accuracy of the κ-method and provides a
more user-friendly breakout surface0 below (Fuchs, Eligehausen, & Breen 1995).
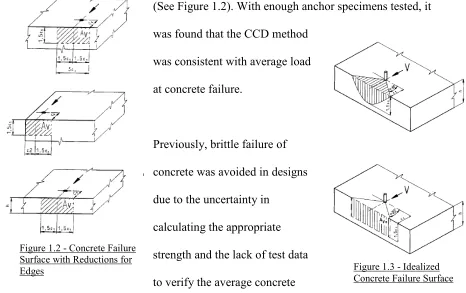
One of the largest improvements was the idealization of the projected failure surface as a prism
formed at 35° (55° from the centerline of the anchor) as opposed to 45° (See Figure 1.3). The 35°
angle is equivalent to the 1.5ca1 that is used in multiple codes today. This use of a prism allows
for a simpler calculation when determining the influence of free edges and overlapping anchors
(See Figure 1.2). With enough anchor specimens tested, it
was found that the CCD method
was consistent with average load
at concrete failure.
Previously, brittle failure of
concrete was avoided in designs
due to the uncertainty in
calculating the appropriate
strength and the lack of test data
to verify the average concrete
[image:11.612.89.555.404.697.2]Figure 1.3 - Idealized Concrete Failure Surface Figure 1.2 - Concrete Failure
failure load. The CCD method proved to be a reliable method to determine concrete failure.
These findings revolutionized the way the industry calculates and designs fastenings to concrete.
Now that ductile or brittle design could be predicted with certainty, the applications for steel
anchors increased significantly.
1.1.4 Current Method used to Determine Concrete Breakout in Shear
Currently, both ACI 318-14 and ACI 349-13 use the CCD approach as the governing method to
determine concrete breakout strength. But, ACI Committee 349 only recently adopted the CCD
method in the 2002 edition of the code, ACI 349-02. In ACI 349-85, the concrete breakout
capacity calculates the projected concrete failure cone as the cylindrical section of uniform
stress. Upon examination of European and U.S. standard calculation of capacity against the
tested values, the CCD method agreed well with the average failure loads in the European tests
(Fuchs et al. 1995). The study concluded that the average shear capacity over a range of spacing
and embedment depths was accurately predicted by the CCD method; but also determined that
the ACI 349-85 is overly conservative for anchors with small edge distances, while not
conservative for larger edge distances (Fuchs et al. 1995). Notably, several equations provided
by ACI 318-14 code are adaptations of equations from both the development of the CCD method
as well as, the European code Comite Euro-International Beton, “Design of Fastenings in
Concrete” (CEB). In 2006, another publication was completed titled, “Anchorage in Concrete
Construction” (ACC) (Eligehausen, et al, 2006), that provides more explanation of the equations
utilized in CEB.
The equations used to calculate the concrete capacity in ACI 318-14 and European codes
edges, eccentric load, spacing, etc. See Table 1.1 – Table 1.5 for shear breakout capacity
equations for ACI 318-14, ACI 349-85, CEB, CCD approach, and ACC text respectively.
Table 1.1 - Shear Breakout Equations used in ACI 318-14
Equation Reference Comment
V =AA ψ , ψ , ψ , V (1) Nominal Breakout Strength of Anchor
V = 7 dl . d ! λ f #c %&%.' < 9λ f #c %&%.'
(2) Basic Concrete Breakout Strength limited by large diameter anchors
ψ , = 0.7 + 0.3 ∗ 1.5cc
% ≤ 1
(3) Modification Factor for Influencing edges
For anchors where analysis indicates no cracking
ψ , = 1.4
For anchors where analysis indicates cracking:
ψ , = 1.0 for cracked concrete without supplementary
reinforcement or reinforcement smaller than No. 4 bar
ψ , = 1.2 for cracked concrete with reinforcement of a
No. 4 bar or greater between the anchor and the edge
ψ , = 1.4 for cracked concrete with reinforcement of a
No. 4 or greater between the anchor and the edge, and the reinforcement enclosed within stirrups spaced not more than 4in.
(4) Modification Factor for Uncracked and Cracked Concrete with and without supplemental
reinforcement
ψ , = 2%.'334≥ 1, when ha > 1.5ca1
(5) Modification Factor for Member
Size
Table 1.2. Shear Breakout Equations used in ACI 349-85
Equation Reference Comment
V = 4ϕ f (6) Strength of Concrete under uniform
stress
Table 1.3. Shear Breakout Equations used in CEB – “Design of Fastenings”
Equation Reference Comment
V67, = V67, ∗ ψ8,9∗ ψ ,9∗ ψ:,9∗ ψ;,9∗ ψ< =,9 [N] (7) Characteristic resistance of anchor
ψ8,9= A ,9/A ,9 (8) Factor to account geometric effects
V67, = k@∗ dA B.' ∗ C FGHDE I .
∗ f7.'∗ c%%.' [N]
k@= 0.5 [N0.5 / mm]
(9) Characteristic resistance of anchor without influence
ψ ,9= C%.' 4I %/J
≥ 1 , when ha > 1.5ca1
(10) Factor to account for member thickness
ψ;,9 = 1.0 for α < 55° (12) Factor to account of angle of applied shear load
ψ< =,9= 1.0 for cracked concrete without edge
reinforcement
ψ< =,9= 1.2 for cracked concrete with straight edge reinforcement
ψ< =,9= 1.4 for cracked concrete with edge reinforcement and closely spaced stirrups
(13) Factor to account for uncracked concrete or cracked concrete with and without reinforcement
Table 1.4. Shear Breakout Equations proposed for CCD Approach
Equation Reference Comment
VA=88QGQ ∗ ψ@∗ ψ'∗ VA (14) Nominal Concrete Breakout
Strength
ψ'= 0.7 + 0.3 ∗ C%.'K4I (15) Tuning Factor for stress
distribution at corner
VA = 13 CDGI .
d ∗ f ∗ c%%.' [lb] (a) VA = CDGI
.
d ∗ f ∗ c%%.' [N] (b)
l ≤ 8d [mm]
(16) Basic Concrete Breakout Strength
Activated bearing length of fastener
Table 1.5. Shear Breakout Equations used in “Anchorage in Concrete Construction”
Equation Reference Comment
V67, = V67, ∗ ψ8,9∗ ψ ,9∗ ψ:,9∗ ψ;,9∗ ψ< =,9 [N] (17) Characteristic resistance of anchor
V67, = 0.45 dA B∗ C FGHDE I .
∗ f 7, < ∗ c%%.' [N] (18) Characteristic resistance of anchor without influence
ψ ,9 = 2%.' 4≥ 1 , when ha > 1.5ca1
(19) Factor to account for member thickness
ψ:,9= 0.7 + 0.3 ∗ C%.'K4I ≤ 1 (20) Factor to account for edge influence
ψ;,9= 1.0 for α < 55° (21) Factor to account of angle of applied
shear load
ψ< =,9= 1.0 for cracked concrete without edge reinforcement
ψ< =,9= 1.2 for cracked concrete with straight edge
reinforcement
ψ< =,9= 1.4 for cracked concrete with edge reinforcement and closely spaced stirrups
(22) Factor to account for uncracked concrete or cracked concrete with and without reinforcement
Although ACI 349-85 criteria places a strict limitation on the position of the anchor, it
does provide a conservative lower bound prediction for anchors with small edge distances. This
limitation is evident when examining how simplistic the equation is for concrete strength. This
ACI 318-14, CEB, and ACC are all derived from the research in CCD approach proposed
in 1995. Upon examination of the nominal or characteristic basic breakout strength (Table 1.1
Eq. (2), Table 1.3 Eq. (9) and Table 1.5 Eq. (18), respectively), there is considerable difference
between the codified equations and the CCD approach. ACI 318-14 basic concrete breakout
strength includes the constant 7, instead of 13. European code, CEB utilizes the factor k4 = 0.5,
instead of the constant 1.0, originally proposed. ACI 318-14 commentary states, “the constant, 7,
in the shear strength equations was determined from test data reported…at the 5 percent fractile
adjusted for cracking”(ACI 318-14). CEB does not provide a justification for the reduction
resulting from k4 = 0.5. In 2006, characteristic breakout strength used in CEB, was adjusted to
account for 5% fractile and cracked concrete similar to ACI (Eligehausen, et al, 2006b). The
modification factors for concrete, Ψc,V and Ψucr,V, were determined through experimental values
of failure of anchors in cracked concrete. It was found that anchors in cracked concrete failed at
loads between 70% and 75% of uncracked concrete (Eligehausen and Balough, 1995). To
validate the factor, Ψ = 1.4, which increases the shear breakout strength the following calculation
is given as 1/1.4 = 0.714 71.4% of uncracked failure strength. The adjustment the nominal or
characteristic breakout strength for 5% fractile and cracking is given below:
For ACI 318-14:
(Assume 5% fractile = 0.753) Vb(adj)= Vb(avg) x (5% frac. x 1 / Ψc,V) = Vb x (0.753 x 1/1.4)
Vb(adj) = Vb(avg) x 0.538
- proposed constant of 13, the adjusted equation for nominal breakout strength, Vb is equal to:
Vb(adj) = 13 x 0.538 = 7 (Vb(avg))
For CEB/ACC: (Specified 5% fractile = 0.7) VRk,c(adj) = VRk,c(avg) x (5% frac. x 1 / Ψc,V) = Vb x
VRk,c(adj) = VRk,c(avg) x 0.50
- constant of 1.0 for CEB, the adjusted characteristic breakout strength, V'Rk,c is equal to:
VRk,c(adj) = 1.0 x 0.50 (VRk,c(avg))
- constant of 0.9 for ACC, the adjusted characteristic breakout strength V'Rk,c is equal to:
V'Rk,c = 0.90 x 0.50 = 0.45
Reducing CCD approach for shear breakout was necessary because the equation predicts
the mean value at which the concrete would fail. This was a purely empirical approach and did
not include any statistical analysis. Similar to the revised equation given in ACC compared to
CEB code, the modification factor for member thickness (Eq. (10) and Eq. (20), respectively)
were also changed to be consistent with testing.
1.1.5 Size Effect of Anchor Bolts
In the case of tensile loading, the required embedment depth is a very important factor
when choosing an anchor for application. Through testing and numerical studies, it has been
determined that the ultimate concrete breakout strength is not directly proportional to the
embedment depth of the anchor. This concept is called “Size effect”. Size effect can be defined
as: “the fracture front blunted be a zone of micro-cracking causing deviations from the structural
size effect known from linear elastic fracture mechanics.” (Bazant 1984). Based on the theory
proposed by Bazant, studies have been conducted to determine the amount of influence and at
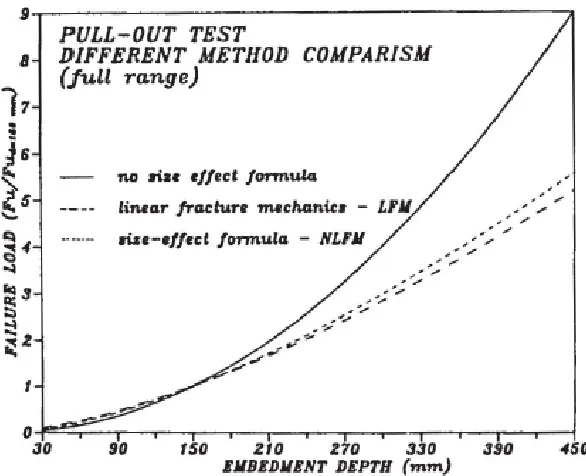
what range of embedment depths does size effect apply to. In 1991, Eligehausen and Ozbolt
proposed a formulation based on numerical finite element modeling that included the size effect
was given as:
This formula was later refined via testing to the following:
F<= 2.2 f .' h C1 +% I Y .'
(24)
The terms h and d are the embedment depths, respectively. Simplification of FA =
a% EGWd3/2 (23), would result in the embedment depth raised to the power of 3/2, which is
consistent with the numerical analysis previously completed. This equation predicts a gradual
transition from a plastic solution (no size effect) for small embedment depths to a linear fracture
mechanics solution (largest size effect) for large embedment depths (Eligehausen et al. 1992).
The transition between the plastic and
fracture mechanics solution can be
seen in Figure 1.4. This conclusion
falls directly within the description of
size effect theory (Bazant 1984). As
embedment depth increases to a point
the transfer effects less of the
surrounding concrete is consistent
with other mechanics of material
principles.
Since the concept of size effect is based on a localized zone of microcracking, the
principles of fracture mechanics for a portion of concrete loaded in tension are applied to
concrete loaded in shear. Both ACI 318-14 and CEB “Design of Fastenings” consider size effect
in the calculation of concrete breakout in shear by incorporating the edge distance parameter
[image:17.612.273.566.274.512.2]raised to the 3/2 power (i.e. ca11.5).
1.1.6 Current Standard Definition of Supplemental Reinforcement
Cast-in steel anchors that are
used in any type of reinforced
concrete structure will have some
type of reinforcement near the
embedment. Simply assuming that
any reinforcement placed within the
failure surface will supplement the
concrete strength is incorrect. Studies have shown that there are limitations on how much of the
existing steel can be considered, as well as the increase for nominal shear breakout capacity. ACI
318-14, CEB, and ACC specify several conditions for a modification factor used to increase the
shear capacity based on whether or not the concrete is cracked in addition to the presence of
reinforcement (See Table 1.1, Table 1.3 and Table 1.5 for commentary). When reinforcement is
present, but not specially designed for the application, the concrete breakout strength is
multiplied by a modification factor. The largest modification factors are applied to uncracked
concrete during service loading (Ψc,V = 1.4) and cracked concrete with closely spaced stirrups
and edge reinforcement (Ψc,V = 1.4). The closely spaced stirrups were originally required to
provide sufficient confinement to meet seismic design criteria. This would prevent spalling of the
corner and weakening of the structure. Edge reinforcement and stirrups spacing are based on the
testing presented in ACC text. ACI 318-14 and CEB specify a minimum bar size of No. 4 (1/2”)
and 12 mm, respectively. Edge reinforcement must be confined with the stirrups spaced no
farther than 4 in ACI 318-14 and 100 mm for CEB (See Figure 1.5). The distance or quantity of
[image:18.612.252.539.118.273.2]the reinforcement only needs to be installed within that distance, but this information is missing
from code. Clarification would be beneficial for a minimum diameter on the stirrups as well. Not
specifying the size of the stirrups leaves the decision to the judgement of the designer. These
descriptions are open-ended and leave room for interpretation. Without a more detailed
description, the designer would be forced to err towards a potentially over conservative design.
If the applied loading still exceeds the shear capacity with all the appropriate
modification factors, supplemental reinforcement is permitted to be incorporated to increase the
load-bearing capacity of the fastening. The location, size and anchorage, or development length,
of the rebar all have a range in which the reinforcement is considered effective. Typically, two
methods of supplemental reinforcement are used; stirrups with edge reinforcement or hairpins
that enclose the fastener.
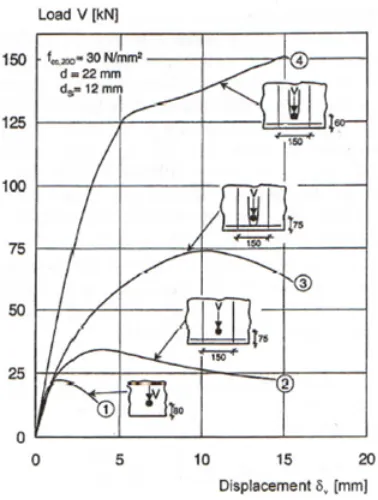
When dealing with supplemental stirrups and edge
reinforcement, the position of steel is an important aspect
to examine. Intuitively, we understand that the closer a
support is to an applied load, the more load that support
will resist. It is often said, stiffness attracts load.
Supplemental reinforcement follows that same concept.
Decreasing the distance between the stirrups and anchor,
increases the effectiveness. Research has been conducted
to analyze how the effectiveness of reinforcement changes
with position relative to the fastening. Test shows that
stirrups combined with edge reinforcement will increase the load-bearing capacity, this can be
[image:19.612.370.559.357.607.2]seen in the difference between curve 1 and 2 in Figure 1.6. Even though, the projected concrete
failure area has a width of 3.0hef, only the reinforcement near the anchor is considered effective
from a calculation stand-point. Bars placed within the lesser of 0.3ca2 and 0.5ca1 from the
centerline of the anchor are considered effective in increasing the strength of concrete according
to ACI 318-14 (See Figure 1.7).
The depth at which the reinforcement is placed has a very drastic impact on how the
fastening will perform. Hairpins and stirrups are typical reinforcement details used to confine the
concrete around a steel anchor. The proximity of the rebar relative to the shaft of the anchor, as
well as the distance from the surface of concrete, have been tested.
A series of specimens (56 total) with varying perpendicular edge distances and
reinforcement details were tested to investigate the effectiveness of hairpins placed around
anchors and provide guidelines as design criteria (Klinger et al 1982). The study was comprised
of hairpins that were placed within varying offsets from the shaft of the anchor, as well as with
varying depths from the surface of concrete (See Figure 1.8). Plain concrete with anchors and
[image:20.612.99.455.185.414.2]large (non-critical) edge distances were used as a control group for comparison. The results of
the testing showed that with the addition of the hairpin, the anchors with short edge distances
were able to reach loads as high as the anchors with large edge distances in plain concrete.
Many of the tests did not reach the full shear capacity of the steel anchor due to excessive
deflection as a result of concrete spalling in front of the anchor. Of the four types of hairpin
reinforcement studied, the spalling loads were highest
in the “Type 1” hairpin detail (See Figure 1.8), which
were approximately 40% higher than “Types 2-4”.
The spalling load increase was attributed to the
biaxial compression of the concrete in front of the
anchor in “Type 1”, as opposed to the stress
concentrations in the concrete around the
reinforcement seen in “Types 2-4”. The authors also
conclude that placing the hairpin reinforcement as
close as possible to the anchor provided good
performance at the ultimate load. When the distance
of the reinforcement to the surface of concrete (cover)
is increased, the load-displacement also increased (i.e.
decreased effectiveness). Another experiment conducted in 2013 agreed with the results from
testing from Klinger (Petersen, Zhao 2013).
This increased performance was validated by the concept of anchor stiffness influence on
load-bearing capacity. Behavior of anchors with applied tension in cracked concrete, analyzed to
examine the influence of crack size. Cast-in-place and post-installed anchors were tested in
[image:21.612.340.564.180.520.2]cracked concrete with varying crack widths and the load-displacements were noted during the
experiment (Eligehausen et al 1995). A reduction of 25% concrete cone failure load was noted
due to anchor in or near cracks when compared to uncracked concrete. This shows that the
anchor stiffness directly impacts the load carrying capacity of the concrete failure cone.
Providing reinforcement close to the surface which restrains the anchor and confines the concrete
is the most effective way to increase the stiffness of the anchor itself. Similar results were found
in another study with large diameter anchors with deep embedment. It was determined that the
hairpin reinforcement increased the concrete breakout capacity, but was still less than the
anticipated ultimate load for the steel based on yield stress (Lee et al. 2010).
The resulting data of the previous studies provided the basis for the requirement specified
in both ACI 318-14 and CEB “Design of Fastenings”. The American Society of Civil Engineers
(ASCE), published a document specifying guidelines for design stirrup reinforcement for
concrete pedestals (Widianto; Owen, J.; and Patel, C, 2010). The design example using
Strut-and-Tie method for determining the corresponding tensile loads in either stirrup located 2 in and
5 in below the surface. ACI 318-08 comments on pedestal reinforcement, “Confinement
improves load transfer from the anchor bolts to the column or pier for situations where the
concrete cracks in the vicinity of the bolts”
(ACI 318-08). The cracking in the vicinity
of the anchors bolts is likely referring to
the radial stress that propagates outwards
from the anchor when axial load is
applied. This ASCE design method makes
use of the reinforcement by modeling the
[image:22.612.299.554.488.643.2]with previous studies and codes) and is shared between both layers of reinforcement (See Figure
1.9). This type of analysis does not directly follow the parameters set forth by ACI 318-14 or
CEB, but STM analysis is permitted in ACI 318-14 per commentary R17.5.2.9 (See Figure 1.9).
If all of the preceding criteria are met, but the reinforcement is not properly anchored (or
developed), the design will not be effective and will not adequately withstand the load. Peak
loads less than the ultimate load of the reinforcement were attributed to spalling of concrete and
insufficient anchorage. The total shear that can be resisted is determined by the summation of the
number of stirrups developed within the failure surface or number of bar developed outside the
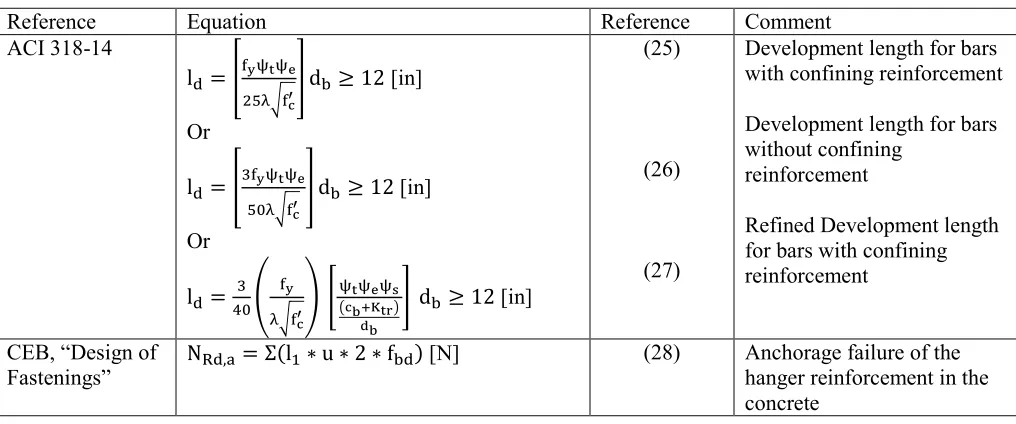
[image:23.612.56.564.338.550.2]failure surface for hairpin reinforcement (See Table 1.6).
Table 1.6 - Development Length and Hanger Reinforcement Capacity
Reference Equation Reference Comment
ACI 318-14
l = ZW[\]\^ '_2W`a
b d ≥ 12 [in]
Or
l = ZJW[\]\^
' _2W`a b d ≥ 12 [in]
Or
l =@J c W[ _2W`a
d e\]\^\f g`hij]kl
mh
n d ≥ 12 [in]
(25)
(26)
(27)
Development length for bars with confining reinforcement
Development length for bars without confining
reinforcement
Refined Development length for bars with confining reinforcement
CEB, “Design of
Fastenings” N6 , = Σ#l%∗ u ∗ 2 ∗ f &
[N] (28) Anchorage failure of the
ACI 318-14 development lengths have multiple ways to calculate the minimum distance
required for different applications. CEB equation is more focused on calculating the design
resistance with a given development length. ACI 318-14, CEB, and ACC agree that when stirrup
reinforcement is used, the bars must be anchored on either side of the failure surface because the
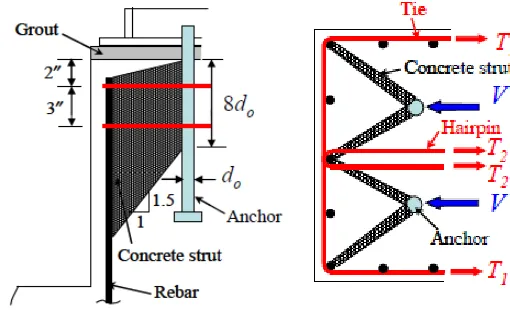
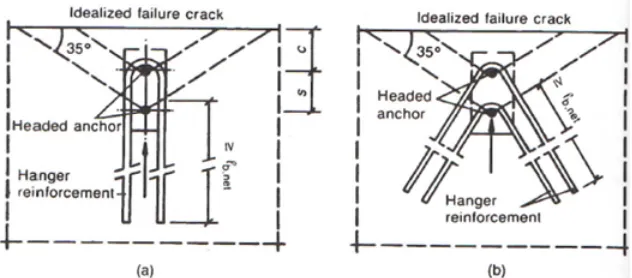
bars are assumed to yield (See Figure 1.11, 1.12, 1.10 respectively). If hairpin reinforcement is
utilized the bars only need to be development outside of the failure surface (See Figure 1.11 and
1.12). Since the bar is placed in very close proximity to the shaft of the anchor, the load is
[image:24.612.48.374.299.454.2]directly transferred to the reinforcement.
[image:24.612.416.571.385.596.2]Figure 1.10 - Development Length of Suppl. Reinf. using Hairpins ACI 318-14
Figure 1.12 - Stirrup Reinforcement Development Length - ACC
[image:24.612.68.384.516.655.2]1.1.7 Sizing and Capacity of Shear Reinforcement
Safety factors or strength reduction factors are a critical part of any anchorage design and
can vary greatly based on the application or failure mode. CEB uses a partial safety factor of γms,1
= 1.15 to reduce the allowable load for both the steel fastener and the concrete failure. Between
the two codes, only ACI 318-14 separates the failure modes for brittle concrete failure with and
without reinforcement present. “Condition A” considers the effect of reinforcement being
present. ACI R17.3.3 specifies that there does not need to be an explicit design for the
reinforcement if it is not sized to resist the full shear load. The capacity increased is minimal (i.e.
φ = 0.75 for Condition A and φ = 0.70 for Condition B). Strength reduction for supplemental
reinforcement is equal to φ = 0.75.
The original testing conducted to determine the influence of reinforcement concluded that
only deformed bars of 16 mm (~ No. 5 U.S. standard size) are allowed. As reinforcing bars begin
to increase in size beyond 16 mm, they may not be able to develop yield stress. If bars do not
reach yield strength, then there is load sharing between the concrete and steel bars which is not
permitted based on the completed research. Flexibility of the reinforcement is cited as the
probable reason that larger bars are less effective than smaller diameters (<16 mm or No. 6 max).
“…supplementary reinforcement did increase capacity. The increase, however, was much less
than what would have been achieved for complete load transfer to the stirrups on either side of
the anchorage…This is likely due to the flexibility of the hairpins and to the large displacements
of the anchor required to develop complete yield of the hairpins,”(Lee et al. 2010). The
limitation of reinforcing bars to 16 mm or No. 5 is to ensure yielding of the reinforcing prior to
excessive load transfer into the concrete. Current practice is to size the reinforcement to resist the
CEB specify how the load is distributed to the reinforcement when there are multiple bars on
either side of the failure surface. ACC authors write, “The shear capacity of the anchorage is
derived by summing the capacities for all stirrup legs…whereby only those stirrups legs near the
surface should be included” (Eligehausen, et al, 2006b). Since the deformation in the concrete
failure prism is relatively small, any reinforcement placed within the permitted range will share
[image:26.612.61.571.263.664.2]the load equally.
Table 1.7 - Shear Strength of Supplemental Reinforcement
Reference Equation Reference Comment
ACI 318-14 V:== A: x fs
V<= ϕV:== ϕA: x fs [lb]
(29)
(30)
Nominal Strength of
Supplemental reinforcement
Ultimate Strength of Reinforcement CEB, “Design of
Fastenings” V67,:%= kt∗ η ∗ A:∗ fs7 [N] k7 = efficiency factor = 0.5
n2 = # of bars in hanger reinf. per anchor
V6 ,:D= V67,:D / γw:% [N]
(31)
(32)
Steel Failure of hanger reinforcement
(applies to stirrups and hairpins)
Factored Steel Failure Anchorage in
Concrete Construction
V<,:= 2 ∗ η%∗ A:∗ fs [N]
η1 = efficiency factor varies = 0.5 to 1.0
η1 = 1.0 for reinf. against anchor
η1 = 0.5 for reinf. with gap between anchor
V6 ,:%= V67,:D / γw:% [N]
V<, = π ∗ d:∗ l%∗ f B / α ≤ A:∗ fs [N]
f B= bond strength [N/mm2]
α = 0.7
V6 ,:%= V<, / γw:% [N]
(33)
(34)
(35)
(36)
Load Carried by single bar of hairpin hanger reinforcement with efficiency factor, η
Factored Steel Failure for hairpins
Load carried by single bar with given development length for stirrups
Factor to take into account hook or welded transverse bars
The most notable difference between the equations for supplemental or hanger
reinforcement are the factors of safety and efficiency applied to the nominal strength of steel.
ACI 318-14 only applies a strength reduction factor, of 0.75, which includes the decreased
efficiency for placement below the applied shear. ACC provides two equations used to calculate
load carried by either stirrups or hairpins. Equation 33 is consistent with Equation 31 in terms of
efficiency factors and the number of bars included (k7 = 0.5 and η1 = 0.5 to 1.0).
European code, CEB, apply a factor of safety γMs1 = 1.15, which equates to a reduction of
1/1.15 = 0.869. This is in combination with the efficiency factor, k7 = 0.5 and η1 = 0.5(min). The
total strength reduction is approximately equal to 0.43 for both hairpins and CEB stirrups. ACC
does not specify any reduction for efficiency in Equation 35. According to ACC equation for
stirrup capacity is only reduced by the factor of safety, γMs1 = 1.15 which is less conservative
compared to the ACI 318-14 reduction.
1.2 Problem Statement
Based on the discussions above, the code might be too conservative and can be expanded.
Therefore, this study will examine this by using FEA to determine the load-bearing capacity
when reinforcement is spaced at a distance greater than 4 in. This would help in alleviating
design costs, supply expenses, labor and time – thus improving the concrete construction
CHAPTER 2: FINITE ELEMENT ANALYSIS
2.1 Introduction
Finite Element Analysis programs are powerful tools that are often used to analyze
complex problems that arise in the engineering field. Accurately modeling reinforced concrete
structures has always been a difficult task to achieve. The FE program, ABAQUS, is capable of
analyzing the nonlinear properties of concrete. In this model, the stresses within the concrete and
reinforcement are generated by applying a load to the steel anchor, similar to a typical
connection designed for a structure. Shear loading is applied via a specified displacement equal
to 1 inch towards the perpendicular edge. Using a displacement-controlled method will result in
a peak reaction forces which can then be compared to values calculated using approved code
equations. In this model, the failure mechanisms will include concrete crushing and cracking.
These failure mechanisms can be accounted for by specifying material damage properties.
ABAQUS provides a method to calculate compression and tension damage values based on
previous research. Tension damage is caused by cracks begin to open and redistribute stress into
the surrounding areas and creating inelastic strain. Concrete compression damage is caused by
concrete strain exceeding 0.003 in. In both cases the damage parameter is calculated by the
following expression:
d = 1 −€•^3‚€ (37)
Establishing an unreinforced or “plain” model control used as the control group for the
subsequent tests is critical. This is done to validate that the concrete properties used are
consistent with the expected failure load. Using the validated “control” model the reinforced
models can be made. The calibration model will be designed in accordance with ACI 318-14.
Figure 2.1 - Dimensions of Steel Anchor; All Model
steel stirrups spaced at 4 inches along the edge. The calibration model can also be compared to
code values for reinforced concrete. Once these models are validated the experimental models
with varying stirrup spacing are analyzed. FE models will be able to predict the peak failure load
of the different reinforcement configurations.
2.2 Model Design
2.2.1 Model Geometry
Four models are used throughout this study; (1) a simple concrete model without
reinforcement (important in validating the material properties from code), (2) a concrete model
with the recommended 4in reinforcement spacing, (3) an experimental concrete model with 6 in
reinforcement spacing, and (4) another experimental concrete model with 8in reinforcement
spacing. All models maintain the same geometry throughout the study, and appear as follows;
The steel anchor used in all of the models is created as a deformable solid revolution with
the following geometry:
Length: 6-1/2”
Figure 2.2 - Dimensions of Concrete Block; All Models
The concrete block geometry was determined such that the projected failure surface
would not be reduced by any adjacent edges (See Appendix for calculations regarding concrete
block dimensions). An edge distance of 12 in was chosen to provide adequate distance away
from the edge to allow for stress and tensile damage to spread to the adjacent steel reinforcement
for the experimental models. Size effect of this model does not need to be considered any more
than what is already assumed in the equations used to determine the anticipated failure loads.
According to ACI 318-14, anchors with embedment of 11 in to 25 in exhibit failure loads that are
consistently underestimated when using hef1.5. An alternate equation is used to calculate a less
conservative prediction for nominal concrete breakout failure when embedment exceeds 11 in.
Applying this same concept and mechanics to a shear loading application, as well as rounding to
a convenient distance of 12 in, the edge distance is justified for this study. With the
perpendicular edge distance set equal to 12 in, the total length must be greater than 3.0ca1. The
member depth is also sized such that it will not influence the failure surface; therefore, the
member depth must be greater than 1.5ca1 (See Appendix for hand calculations). This results in a
concrete domain with the following dimensions:
Figure 2.3 - Dimensions of Stirrup Design used Throughout Study
Stirrup are detailed in accordance with ACI 318-14 to include concrete cover of 1 inch
and minimum bend radius for No. 5 deformed bars equal to 6da or 3-3/4”. Embedment constraint
was used to model the interface between the internal surface of concrete and the external surface
of the reinforcement.
Bar: No. 5 bar (Ø5/8”)
Length = Width: 22” or 1’-10” overall
Edge reinforcement is detailed according to ACI 318-14 deformed bar. Embedment
constraint was used to model the interface between the internal surface of concrete and the
external surface of the reinforcement.
Length: 40” Bar: No. 4 (Ø1/2”)
Each model has identical boundary conditions and specified loading. Using a fixed
boundary condition along the bottom surface ensures that the tensile or compressive stresses in
the concrete are unaffected by any external reactions. As previously mentioned, a
displacement-controlled boundary condition is applied to the top surface of the embedded anchor. The benefit
to use displacement is that the peak load value is easily found for a given force vs displacement
curve.
2.2.2 Model Properties
Concrete compressive and tensile damage properties are calculated using formulations
provided by ABAQUS and calibrated in previous research (Zhang 2018). The values given in
Table 8 have been adjusted for 4,000 psi concrete strength used in the models. The concrete
damaged plasticity parameters are identical to properties from previous research (Zhang 2018) as
follows:
- Dilation angle: 31 °
- Eccentricity: 0
- Ratio of biaxial strength to uniaxial strength fb0/fc0: 1.16
- Ratio of the second stress invariant on tensile meridian K: 0.667
[image:32.612.64.544.233.435.2]- Viscosity parameter: 0.0001
Table 2.1 - Concrete Compressive Damage Properties and Parameter adjusted for fc’ = 4,000 psi (Zhang 2018)
Concrete Compressive Behavior Concrete Compressive Damage Behavior
Yield Stress Inelastic Strain Damage Parameter Inelastic Strain
4000 0.001945989 0 0
3821 0.002945989 0.466667556 0.001945989
3502 0.003945989 0.490564735 0.002945989
3183 0.004945989 0.533084678 0.003945989
2898 0.005945989 0.575662311 0.004945989
2654 0.006945989 0.61356392 0.005945989
2444 0.007945989 0.646195039 0.006945989
2265 0.008945989 0.674090928 0.007945989
2110 0.009945989 0.698000919 0.008945989
1976 0.010945989 0.71862303 0.009945989
1858 0.011945989 0.736542547 0.010945989
1754 0.012945989 0.752232837 0.011945989
1662 0.013945989 0.766072462 0.012945989
1580 0.014945989 0.778363974 0.013945989
1506 0.015945989 0.789350201 0.014945989
1439 0.016945989 0.799227314 0.015945989
1378 0.017945989 0.80815498 0.016945989
1323 0.018945989 0.816264167 0.017945989
1272 0.019945989 0.823663135 0.018945989
1225 0.020945989 0.830442047 0.019945989
1212 0.021235989 0.836676531 0.020945989
Table 2.2 - Concrete Tensile Damage Properties and Parameter adjusted for fc’ = 4,000 psi (Zhang 2018)
Concrete Tensile Behavior Concrete Tensile Damage Behavior Yield Stress Cracking Strain Tension DMG Inelastic Strain
474.341649 0 0 0
365.243070 0.000128421 0.437655012 0.00013
213.453742 0.000394737 0.671356825 0.00039
[image:33.612.46.567.500.589.2]Only the elasticity of steel is included in the model parameters. Test data for plastic
behavior was not available for materials similar to A449 steel. The following parameters were
used in the steel material:
- Young’s Modulus = 29,000 ksi
- Poisson’s ratio = 0.30
After the models were completed, the stress in the anchor embedment was examined to
verify the assumption of elasticity used for the material properties. The maximum stress was
found to be generated in Model 2 with edge reinforcement and stirrups spaced at 4 in centers.
The largest stress concentration was determined to be 94,230 psi. Using steel material properties
for ASTM A449 steel, the yield stress for Ø3/4” rod is 92,000 psi and ultimate stress of 120,000
psi. The difference between the resultant stress and yield stress is as follows:
Difference = … 94,23092,000 − 1† x 100 = 2.4%
The difference between the yield stress and resultant stress is negligible, and therefore, the
[image:34.612.248.385.467.677.2]assumption of elasticity for steel is accurate.
2.3 Finite Element Analysis Results
2.3.1 Control Model without Reinforcement (Model 1)
Figure 2.7 shows the resulting tensile damage due to the specified displacement. A
maximum tensile damage value of 0.90 is achieved during this run. With the parameters adjusted
for 4,000 psi concrete, the maximum calculated value for tensile damage is equal to 0.929 from
Table 8. Percent difference between the calculated value and the analyzed value is calculated as:
0.929 / 0.90 = 1.03. The difference of 3% can be attributed to the tension acting on the opposite
side of the direction of the displacement. Since the tension damage parameter is not equal to 1.0
at these locations, there is still stress in those elements. The tensile stress on the backside of the
[image:35.612.86.451.103.295.2]anchor will counteract some of the forward displacement. This 3% difference is negligible for
[image:35.612.109.386.533.706.2]Figure 2.7 - Concrete Tensile Damage Parameter for Model 1
this study. The distribution of the tensile damage coincides with the anticipated failure surface
predicted by the CCD method. During the original development of the CCD method test
specimen had failure surface widths varying from 1.3ca1 to 1.5ca1 (See Figure 2.8).
Compressive damage also follows the expected distribution. The bearing force should be
transferred to the concrete radially. The activated bearing according ACI 318-14 calculated
values is 8da = 6 in. The compressive damage parameter is at the maximum value over a majority
of the depth of the embedment. Both the concrete damage and activated bearing indicate that the
concrete compressive properties and model interactions are accurate (Figure 2.9).
Evaluating the peak load of the control model against the calculation peak, the percent
difference is calculated as:
- Peak Load = 29.9207 kips
- Calculated Value = 24.157 kips (See Appendix for calculation of anticipated failure load)
- Error % = ˆ1 − C @.%'t
[image:36.612.86.510.305.483.2]‰.‰ tIŠ x 100 = 19.2%
Although 19.2% is not ideal, it appears that this is still within a reasonable range of that
calculated value. Considering both the tensile and compressive damage and the failure surface
shape, it is determined that this control model adequately represents the load-bearing response
for plain concrete.
2.3.2 Control Model with Reinforcement 4in Spacing (Model 2, Figure 2.10)
The concrete tensile damage with stirrups
follows a similar path as compared to the control
model without reinforcement (See Figure 2.11). The
difference between Model 1 and Model 2 is the stress
concentrations in the stirrups embedded in the
concrete.
The increased peak load is due to the additional stress carried by the reinforcement.
Stirrups closest to the anchor shown in Figure 2.12, resist the most stress. Peak value of 17,260
[image:37.612.78.547.199.596.2]psi was observed during the control run. This stress is significantly lower than typical ultimate
Figure 2.10 - Diagram of Model 2
stress of, fu = 40 ksi or 60 ksi, for Grade 40 or Grade 60 respectively. This verifies the
assumption that the steel reinforcement remains below the yield point and that the material
properties are appropriate for this study. The peak load for the control reinforced model is equal
to 32.8185 kips. Compared to the calculated value of 33.819 kips (See Appendix for calculation
of anticipated failure load), the difference of 3% is negligible. The control model with
reinforcement at 4in spacing accurately represents the anticipated load response.
2.3.3 Experimental Model with Reinforcement 6in Spacing (Model 3, Figure 2.13)
In the first experimental model (Model
3), the stirrups are increased to a spacing of 6 in.
This spacing does not conform to the confining
requirement of 4 in spacing maximum. As the
spacing increases, the reinforcement is farther
away from the centerline of the anchor. This
implies that the peak load of Model 3 with 6 in
[image:38.612.105.493.267.436.2]Figure 2.12 - Von Mises Stress in No. 5 Stirrups (left), Max stress on Single Stirrup (right) for Model 2
spacing should be less than the peak load of the Model 2 with 4 in spacing. Figure 2.14 illustrates
that the concrete tensile damage propagates to the anticipated failure surface as in the previous
models.
Interestingly, comparison of the peak loads for Model 2 and Model 3 are almost equal,
32.8185 kips and 33.8719 kips respectively. The difference between peak loads of these models
is equal to (33.8719 / 32.8185) = 1.03, a 3% increase in Model 3. The difference between the
peak load and the calculated ACI 318-14 value is significant. Since 6 in spacing does not
conform to the allowable spacing, a smaller modification factor is required. Comparing the
calculated value from ACI 318-14 of 28.988 kips (See Appendix for anticipated failure load) to
the FE model, the increase is calculated as follows:
Diff % = … 33.871928.988 − 1† x 100 = 16.8%
The maximum stress in the stirrup is equal to 13,900 psi and is located closer to the free
[image:39.612.101.508.359.609.2]consistent with where the projected failure surface would theoretically intersect the
reinforcement. Changing the spacing of the stirrups will also change the point at which the
failure surface crosses the bar, resulting in different stress concentrations compared to Model 2.
2.3.4 Experimental Model with Reinforcement 8in Spacing (Model 4, Figure 2.16)
The second experimental model (Model
4), has stirrups spaced at 8 in apart. Again, this
will not conform to the requirements for
confining reinforcement and would be expected
to have a peak load less than Model 2. The peak
load value for Model 4 is equal to 33.459 kips,
which is greater than Model 2, but less than
Model 3 values.
[image:40.612.99.451.79.239.2]Figure 2.15 - Von Mises Stress in No. 5 Stirrups (left), Max stress on Single Stirrup (right) for Model 3
Similar to Model 3, the stress concentration in the stirrup is located further along the top
horizontal bar. The maximum stress is equal to 14,930 psi (See Figure 2.18). This value is also
[image:41.612.115.503.74.253.2]between the upper and lower values of Model 2 and Model 3 respectively. Figure 2.18 - Concrete Tensile Damage Parameter for Model 4
[image:41.612.126.482.369.524.2]0 5 10 15 20 25 30 35 40
0 0.2 0.4 0.6 0.8 1
R e ac ti o n F o rc e ( k ip s) Displacement (in)
Force vs Displacement
Plain Concrete
4in c-c
6in c-c
8in c-c
Figure 2.19 - Force vs Displacement Results from FEA 2.3.5 Force vs. Displacement Results
[image:42.612.77.542.210.661.2]The summary of peak loads from FE model 1-4 and the anticipated failure load are as follows:
Table 2.3 - Summary of Peak Loads and Calculated anticipated Loads
Model # / Concrete Reinforcement
FE Model Peak Load (kips)
Anticipated Failure Load (kips)
Difference: FE vs. Anticipated (+ increase, - decrease)
Model 1 (Plain concrete)
29.9207 24.157 +19.2%
Model 2 (Edge + Stirrups at 4 in c-c)
32.8185 33.819 -3.0%
Model 3 (Edge + Stirrups at 6 in c-c)
33.8719 28.988 +16.8%
Model 4 (Edge + Stirrups at 8 in c-c)
CHAPTER 3: CONCLUSION
3.1 Overall Conclusion
Based on these numerical studies it can be seen that the peak values for both of the
control models are near the nominal strength that would be calculated with ACI 318-14 code.
Being that the reinforced model with stirrups spaced at 4 in centers closely compared to the
anticipated value, this implies that the other reinforced models adequately represents the actual
load-bearing response. The load-displacement curve of the models using 6 in and 8 in spacing
(Model 3&4, respectively) follow an identical path and give peak load values within 1.91% to
3.1% of the control reinforced model. Not only are the values very close to upper bound for the
nominal strength, but these are significantly higher than the values calculated using ACI 318-14
code.
The initial hypothesis was that the 6 in or 8 in spacing would have a lesser peak load, but
this was not the case. The test values for the two experimental models actually gave results
higher than what was thought to be the maximum load. Model 3 gave the largest peak load,
Model 4 in between that and Model 2.
Upon examination of the stirrups at each model, the location where the breakout failure
surface occurs is very influential on the peak load. Another important factor is the stirrup’s
position relative to the anchor. As expected the development length will also play a role in the
load resisted by each bar. Two main factors are in effect for each configuration 1) proximity to
the anchor fastening and 2) development length inside and outside of the breakout surface. The
Model 2 - Stirrups at 4in spacing
1) These stirrups are in such close proximity to anchor, that these it does not require much
strain or concrete damage for the steel to be mobilized. The largest displacement occurs
near the anchor and concrete interface. The small sections of steel bar, although they have
a much higher tensile strength compared to concrete, the stiffness is relatively small.
2) Bars placed close to the centerline of the anchor will have the most development length
within the breakout surface. This is beneficial to the design.
Model 3 - Stirrups at 6in spacing
1) As the stirrups move further away from the centerline, more load must be dissipated into
the structure before enough damage can occur to mobilize the reinforcement, some
distance away. This is beneficial to increasing the capacity.
2) These bars still have a significant portion of the stirrup able to be developed inside the
breakout surface, but will be limited on the allowable load.
Model 4 - Stirrups at 8in spacing
1) This position requires the most amount of load to be dissipated prior to mobilization of
the steel.
2)These bars will have the least amount of development length available and will be limited
on the total load carrying capacity.
This study was conducted using specific dimensions for the edge distance, concrete block,
and stirrup spacing. Since only the elastic properties were used to model steel members in the
control and experimental models, actual test data can be utilized to give a more accurate result
will only increase the accuracy of the steel and concrete interaction. Future studies are strongly
encouraged to include this information in FE models going forward.
Having an understanding how all the parameters involved can significantly influence the
outcome of the study. The geometry of the model as well as boundary conditions will have a
large impact on the results of individual studies. Keeping external factors, such as the boundary
conditions, consistent across multiple studies will allow for more repeatability and consistency in
the results. The stress concentration positions and magnitudes noted in these results, are
dependent on this specific model and will change depending on the configuration. This study
was design using an edge distance of 12 in that was chosen with the intent on providing enough
distance to transfer load into the reinforcement and develop stress in the stirrups. To adequately
evaluate whether the code is conservative, creating models to study individual variables is
critical. Increasing stirrup spacing must be analyzed at shorter edge distances. Only by analyzing
all the different configurations of anchor positions, stirrup spacing, and member size can a
generalized conclusion be drawn.
3.1.1 Recommended Modification
Based solely on these tests, there is potential to include larger stirrup spacing for anchors
under shear loading.
Current parameters: s < 4 in [US]
s < 100 mm [SI]
Modification Factor, ψ = 1.4
Suggested parameters: s < 8 in [US]
s < 200 mm [SI]
3.2 Field Application
Widening the range in which existing reinforcement can be used to resist shear loads will
have huge cost savings benefits in the construction industry. A specific example would be in the
construction of a high-rise building. It is common practice to use self-climbing wall forming
systems in the concrete industry. This type of system incrementally works its way up the
building while carrying workers, stored material, equipment, concrete placing boom, etc. In
order to climb the building, anchors are set prior to each wall pour at specific elevations to
provide connections points later on. Once the walls are cast, and have sufficient strength, raising
the system can begin. Once lifted to the next elevation, the system is secured to the wall via the
cast-in anchors.
This process is repeated at each level of the building, so efficiency is key. The structural
engineer will specify the concrete strength based on code design requirements, not temporary
construction conditions. But, the self-climbing system design requires a safe minimum concrete
strength to support the tremendous vertical load applied by the self-climbing system. This means
that the contractor’s schedule is governed by how quickly the concrete cures. If concrete must
one additional day per cycle, which could potentially add months to the duration of the project.
With the additional strength that can be utilized from the existing reinforcement, the extra curing
time could be eliminated entirely.
3.3 Future Studies
Further investigations need to be made into the other variables that are involved
designing reinforcement. These parameters include, but are not limited to: influence of size
Current practice is to only include supplemental reinforcement that is placed within
0.5ca1 of the centerline of the anchor in the direction of the force. Reinforcement can be placed
outside of 0.5ca1, but is still well within the range of the failure surface. Another area of focus
would be testing whether the shear reinforcement is still effective with small edge distances. The
reinforcement can only help resist the shear once some small cracking has occurred and the
reinforcement is mobilized. Conversely, larger edge distances would have the room to allow for
mobilization. This may lead to an over conservative design that with small edge distances,
mobilization of the reinforcement may occur too late and be of benefit to the design. Another
area for investigation is limitations of the bar size or reinforcement ratio used. Large diameter
bars or increased quantities of rebar will be significantly stiffer than the concrete. With higher
stiffness, the displacement or strain the concrete must also increase to mobilize a larger amount
of steel. The continuation of this investigation through parametric studies in critical. Further
studies will help expand and advance this field.
The construction industry is always moving and looking towards the future. Advances in
technology are allowing engineers to design larger and more complex structures faster than ever
before. Seeing that technology is going to continue to improve, engineers and researchers must
also continue to find new ways to improve on our current methods. Research form years past
must be evaluated and updated to keep from falling behind.
When certain fields within the industry exhaust all options and development begins to
plateau, that’s when we must re-evaluate what has been done in the past and update our old
CHAPTER 4:REFERENCES
ACI Committee 318, “Building Code Requirements for Structural Concrete” (ACI 31808, 11, -14) and “Commentary on Building Code Requirements for Structural Concrete” (ACI 318R-08, -11, -14), American Concrete Institute, Detroit, 2008-2014.
ACI Committee 349, “Code Requirements for Nuclear Safety Related Concrete Structures” (ACI 349-85, -97, -13), American Concrete Institute, Detroit, 1985-1997.
ACI Committee 355, “Guide for Design of Anchorage to Concrete: Examples Using ACI 318 Appendix D”, Chapter 4. Example 8: Group of cast-in anchors in tension and shear with two free edges and supplemental reinforcement. American Concrete Institute, Detroit, 2011. Page 71-75\
ACI Committee 446, “Finite Element Analysis of Fracture in Concrete Structures” (ACI 446.3R-97), American Concrete Institute, Detroit, 1997
ACI Committee 446, “Fracture Mechanics of Concrete: Concepts, Models and Determination of Material Properties” (ACI 446.1R-91), American Concrete Institute, Detroit, 1991.
“Annual Steel Price Forecast.” General Steel, 2019, gensteel.com/building-faqs/steel-building-prices/forecast.
Bažant, Z. P., and Oh, B. H., “Crack Band Theory for Fracture of Concrete,” Materials and Structures, V. 16, No. 3, May-June 1983, pp. 155-177.
Bazant, Z. P., “Size effect in Blunt Fracture: Concrete, Rock, Metal”. Journal of Engineering Mechanics ASCE, 1984, 110 (4), pp. 518 - 535.
CEB, 1997, “Design of Fastenings in Concrete”, Comite Euro-International du Beton (CEB), Thomas Telford Services Ltd., London, UK, Jan.
CEB, 1994, “Fastenings to Concrete and Masonry Structures, State of the Art Report,” Comite Euro-International du Beton (CEB), Bulletin No. 216, Thomas Telford Services Ltd., London, UK.
Eligehausen, R., and Balogh, T., 1995, “Behavior of Fasteners Loaded in Tension in Cracked Reinforced Concrete,” ACI Structural Journal, V. 92, No. 3, May-June, pp. 365-379.
Eligehausen, R.; Bouska, P.; Cervenka, V.; and Pukl, R., "Size Effect on the Concrete Failure Load of Anchor Bolts," Fracture Mechanics of Concrete Structures, Elsevier Applied Science, 1992, pp. 517-525.