Applying Optimal Stopping for Optimizing Queries to
External Semantic Web Resources
Albert Weichselbraun
Vienna University of Economics and Business Administration Augasse 2-6, Vienna, Austria
WWW home page:http://www.ai.wu-wien.ac.at/˜aweichse
Abstract. The rapid increase in the amount of available information from vari-ous online sources poses new challenges for programs that endeavor to process these sources automatically and identify the most relevant material for a given application.
This paper introduces an approach for optimizing queries to Semantic Web re-sources based on ideas originally proposed by MacQueen for optimal stopping in business economics. Modeling applications as decision makers looking for opti-mal action/answer sets, facing search costs for acquiring information, test costs for checking these information, and receiving a reward depending on the useful-ness of the proposed solution, yields strategies for optimizing queries to exter-nal services. An extensive evaluation compares these strategies to a conventioexter-nal coverage based approach, based on real world response times taken from popular Web services.
1
Introduction
Semantic Web applications provide, integrate and process data from multiple data sourc-es including third party providers. Combining information from different locations and services is one of the key benefits of semantic applications.
Service provider like Google restrict the number of queries processed on a per IP/user base to prevent excessive use of their Web services. From a client’s perspec-tive overloaded Web services lead to higher response times and therefore higher cost in terms of processing times and service outages.
Grass and Zilberstein [2] suggest applying value driven information gathering (VDIG) for considering the cost of information in query planning. VDIG focuses on the query selection problem in terms of the trade off between response time and the value of the retrieved information. In contrast approaches addressing only the coverage problem put their emphasis solely on maximizing precision and recall.
Optimizing value under scare resources is a classical problem from economics and highly related to decision theory. Applying these concepts to the information systems research domain yields important strategies for optimizing the acquisition of Web re-sources [3], addressing the trade-off between using rere-sources sparingly and providing accurate and up-to-date information. In this research we apply the search test stop (STS) model to applications leveraging third party resources. The STS model considers the user’s preferences between accuracy and processing time, maximizing the total utility in regard to these two measures. In contrast to the approach described by Grass and Zilberstein [2] the STS model adds support for a testing step, designed to obtain more information about the accuracy of the obtained results, aiding the decision algorithm in its decision whether to acquire additional information or act based on the current answer set. Similar to Ipeirotis et al. [4] the resulting query strategy might lead to less accurate results than a “brute force” approach, but nevertheless optimizes the balance between accuracy and costs. Therefore, the search test stop model addresses the trade-off be-tween two of the major software engineering challenges outlined in ISO/IEC 9126-1:
(i)reliability - the capability of the software product to maintain a level of accuracy
according to measures specified in the software design process [5], and (ii)efficiency
- requiring the software to provide an appropriate performance in terms of processing time and resource allocation, under stated conditions [6].
This paper’s results are within the field of AI research facilitating techniques from decision theory to address problems of agent decision making [7].
The article is organized as follows. Section 2 presents known query limits and re-sponse times of some popular Web services. Section 3 provides the theoretical back-ground for the search test stop model, and presents its extension to discrete probability functions. Afterwards the application of this method to applications utilizing external resources is outlined in Section 4 and an evaluation of this technique is presented in Section 5. This paper closes with an outlook and conclusions drawn in Section 6.
2
Performance and Scalability
The increased popularity of applications that rely on external data repositories calls for strategies for a responsible and efficient use of these resources.
Even commercial providers like Google or Amazon restrict the number of accesses to their services. For instance, Google’s Web API only allows 1000 requests a day, with exceptions for research projects. Workarounds like the use of Google’s public Web in-terface may lead to blacklisting of the client’s IP address1. Google’s geo coding service imposes a limit of 15,000 queries per day and IP address. Amazon limits clients to 20 queries per second, but restrictions vary between the offered services and might change over time2. Other popular resources like GeoNames and Swoogle to our knowledge currently do not impose such limits.
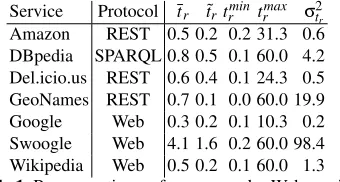
A Web service timing application issuing five different queries to popular Web re-sources in 30 min intervals over a time period of five weeks yielded Table 2. The ser-vices’ average response time (tr), the response time’s median (˜tr), its minimum and maximum values (trmin,trmax), and variance (σt2r) characterize its potential impact on an application’s performance. Due to the timeout value of 60 seconds, specified in the timing application, alltrmax values are equal or below 60. These response times vary, depending on the client’s Internet connectivity and location, but adequate values can be easily obtained by probing the service’s response times from the client’s location.
Table 2 suggests that Google provides a fast and quite reliable service (σt2r =0.2)
with only small variations in the response times. This result is not very surprising con-sidering the global and highly reliable infrastructure Google employs.
Service Protocol tr t˜rtrmin trmax σ2tr Amazon REST 0.5 0.2 0.2 31.3 0.6 DBpedia SPARQL 0.8 0.5 0.1 60.0 4.2 Del.icio.us REST 0.6 0.4 0.1 24.3 0.5 GeoNames REST 0.7 0.1 0.0 60.0 19.9 Google Web 0.3 0.2 0.1 10.3 0.2 Swoogle Web 4.1 1.6 0.2 60.0 98.4 Wikipedia Web 0.5 0.2 0.1 60.0 1.3 Table 1.Response times of some popular Web services.
Smaller information providers which cannot afford this kind of infrastructure in general provide good response times (due to fewer requests), but they are more sensi-tive to sudden peaks in the number of clients accessing their services as visualized in Figure 1. Table 2 reflects these spikes in terms of higher variances andtrmaxvalues.
Our experiments suggest (see Section 5) that especially clients querying services with high variances benefit from implementing the search test stop model.
Another strategy from the client’s perspective is avoiding external resources at all. Many community projects like Wikipedia or GeoNames provide database dumps which might be used to install a local copy of the service. These dumps are usually rather large (a current Wikipedia dump including all pages, discussions, but without the edit history comprises approximately 7.8 GB3) and often outdated (Wikipedia dumps are sometimes
0 10 20 30 40 50 60
0 100 200 300 400 500 600
reqest time (s)
datapoint (10*n)
Test Times (google) Test Times (swoogle) Test Times (GeoNames)
Fig. 1.Selected test times over the time, computed with a timeout of 60 seconds. Every data point accumulates five measurements.
even more than one month old, other services like GeoNames update their records very frequently).
The import of this data requires customized tools (like mwdumper4) or hacks and rarely processes without major hassles. In some cases the provided files do not contain all available data (GeoNames for instance does not publish therelatedToinformation) so that querying the service cannot be avoided at all.
3
The Search Test Stop Model
This section outlines the basic principles of the search test stop (STS) model as found in decision theory. For a detailed description of the model please refer to MacQueen [8] and Hartmann [9].
MacQueen [8] describes the idea of the STS model as follows: A decision maker (a person or an agent) searches through a population of possible actions, sequentially discovering sets of actions (SA), paying a certain cost each time a new set of actions is revealed (the search costcsi). On the first encounter with a set of possible actions, the
person obtains some preliminary information (x0) about its utility (u), based on which he can
1. continue looking for another set of possible actions (paying search costcsi+1),
2. test the retrieved set of actions, to obtain (x1) - a better estimation of the actions value - paying the test cost (cti) and based on this extended information continue
with option 1 or finish the process with option 3, or 3. accept the current set of answers (and gain the utilityu).
The challenge is combining these three options so that the total outcome is optimized by keeping the search (csi) and test (cti) costs low (∑
m
i=1csi+∑
n
i=1cti) without jeopardizing
the obtained utilityu.
Introducing the transformationr=E(u|x0)yields the following description for a policywithout testing:
v=vF(v) +
Z +∞
v
r f(r)dr−cs (1)
with the solution v=v0. F(r) represent the cumulative distribution function of the expected utility and f(r)its probability mass function. The constantcsrefers to search cost andv(betterv0) to the utility obtained by the solution of this equation.
Extending Equation 1 to testing yields Equation 2:
v=vF(rD) + (2)
ZrA
rD
T(v,r)f(r)dr+
Z+∞
rA
r f(r)dr−cs and
T(v,rD) =v (3)
T(v,rA) =rA (4)
T(v,r)refers to the utility gained by testing,rDto the value below which the discovered action set (SA) will be dropped, andrAto the minimal utility required for acceptingSA. A rational decision maker will only resort to testing, if the utility gained outweighs its costs and therefore the conditionT(v0,v0)>v0holds which is the case in the interval [rD,rA].
In the next two sections we will (i) describe the preconditions for applying this model to a real world use case, and (ii) present a solution for discrete data.
3.1 Preconditions
MacQueen [8] defines a number of preconditions required for the application of the STS model. Hartmann [9] eases some of these restrictions yielding the following set of requirements for the application of the model:
1. a common probability mass functionh(x0,x1,u)exists.
2. The expected value ofugiven a known realizationx0(z=E(U|x0,y0))exists and is finite.
3. F(z|x0)is stochastically increasing inx0. For the concept of stochastically increas-ing variables please refer to [10, p75].
3.2 The Discrete Search Test Stop Model
discrete models. The following section summarizes the most important points of his work [9].
Hartmann starts with a triple (x0,x1,u) ofdiscreteprobability variables, described by a common probability functionh(x0,x1,u). FromhHartmann derives
1. the conditional probability functionf(u|x0,x1)and the expected valueZ=E(u|x0,x1), 2. the probability function ofr,f(r|x0)andF(r|x0),
3. the probability ofx0, f(x0)andF(x0).
Provided that the conditions described in Section 3.1 are fulfilled only five possible optimal policies are possible - (i) always test, (ii) never test, (iii) test ifu>ut, (iv) if
u<ut, or (v) ifut<u<ut0. The expected utility equals to
1. E(u|x0)for accepting without testing, 2. T(r,v)with testing, and
3. v0if the action is dropped and a new set (SA) is selected according to the optimal policy.
4
Method
This section focuses on the application of the STS model to Web services. At first we describe heuristics for estimating cost functions (cs,ct), and the common probability mass functionh(x0,x1,u)Afterwards the process of applying search test stop to tagging applications is elaborated.
4.1 Cost functions
In the conventional STS model costs refer to the investment in terms of time and money for gathering information. By applying this idea to software, costs comprise all expenses in terms of CPU-time, bandwidth and storage cost necessary to search for or test certain answers.
Large scale Semantic Web projects, like the IDIOM media watch on climate change [11], process hundred thousands of pages a week. Querying GeoNames for geo-tagging such numbers of documents would adddaysof processing time to the IDIOM architec-ture.
This research focuses solely on costs in terms of response time, because they are the limiting factor in our current research projects. Other applications might require extending this approach to consider additional cost factors like CPU-time, bandwidth, etc.
4.2 Utility Distributions
one domain the notion of an answer set’s (SA) value might not be clear. For instance in a geo context the “correct” answer for a certain problem may be a particular mountain in Austria, but the geo-tagger might not identify the mountain but the surrounding region or at least the state in which it is located (compare Figure 2).
1. Austria/Carinthia/Spittal/Heiligenblut/Grossglockner (mountain)
2. Austria/Carinthia/Spittal/Heiligenblut (village)
3. Austria/Carinthia/Spittal (district)
4. Austria/National Park Hohe Tauern (national park)
5. Austria/Carinthia (state)
6. Austria/Salzburg (Neighbor) (state)
7. Austria/Tyrol (Neighbor) (state)
8. Austria (country)
Fig. 2.Ranking of “correct” results for geo-tagging an article covering the “Grossglockner”.
Assigning concrete utility values to these alternatives is not possible without de-tailed information regarding the application and user preferences. Approaches for eval-uating the set’s value might therefore vary from binary methods (full score for correct answers; no points for incomplete/incorrect answers) to complex ontology based ap-proaches, evaluating the grade of correctness and severe of deviations.
4.3 Application
This work has been motivated by performance issues in a geo-tagging application facil-itating resources from GeoNames and WordNet for improving tagging accuracy. Based on the experience garnered during the evaluation of STS models, this section will present a heuristic for determining the cost functions (cs,ct) and the common prob-ability mass functionh(x0,x1,u).
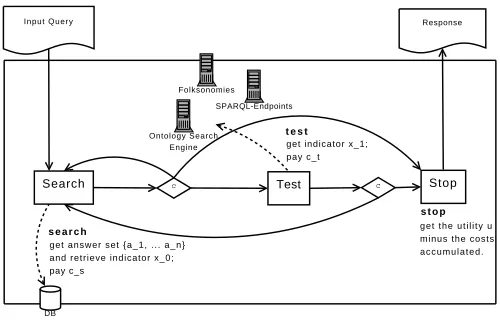
Figure 3 visualizes the application of the search test stop model to Web services. Searching yields an answer setSa={a1, . . . ,an}and the indicatorx0at a prices ofcs. Based onx0the search test stop description logic decides on whether to (i) accept the current answer set, (ii) drop the answer set and continue searching, or (iii) query another set of resources to retrieve the refined indicatorx1paying the test costct. Based onx1 the answer set is dropped or finally accepted.
Cost functions Searching leads to external queries and therefore costs. Measuring a service’s performance over a certain time period allows estimating the average response time and variance.
Search Test Stop Folksonomies
Ontology Search Engine
SPARQL-Endpoints
DB
get indicator x_1; pay c_t
c c
Input Query Response
t e s t
get answer set {a_1, ... a_n} and retrieve indicator x_0; pay c_s
s e a r c h g e t t h e u t i l i t y u minus the costs a c c u m u l a t e d . s t o p
Fig. 3.Applying the search test stop model to Web resources.
In real world situations the translation from search times to costs is highly user de-pendent. To simplify the comparison of the results, this research applies a linear trans-lation functioncs=λ·tswithλ=const=1/t˜syielding costs ofO(cs) =1. Selecting the median of the response times ˜ts and specifying a timeout value of 60 seconds for any query operation reduces the influence of service outages on the simulation results.
The performance of the search test stop algorithm is highly dependent on accurate estimations of the query cost, because all decisions are solely based on the common probability mass function and the cost functions. Future research will compute query cost based on use case specific cost functions as demonstrated by Strunk et al. [12], Verma et al. [13], and Yeo and Buyya [14] and evaluate the results yielded by these different approaches.
Utility distribution The discrete common probability mass functionhis composed of three components: The probability mass function of (i) the utilityu, (ii) the random vari-ablex0providing an estimate of the utility and, (iii) the random variablex1containing a refined estimate of the answer’s utility.
In general a utility function assuming linearly independent utility values might look like Equation 5.
u=
∑
ai∈SA
λ(ai)feval(ai) (5)
The utility equals to the sum of the utility gained by each answer setSA, which is eval-uated using an evaluation function feval, and weighted with a factorλ(ai). To simplify the computation of the utility we consider only correct answers as useful (Equation 6) and apply the same weight (λ(ai) =const=1) to all answers.
feval(ai) =
(
0 ifaiincorrect; 1 ifaicorrect.
Geo-tagging identifies geographic entities based on a knowledge base as for instance a gazetteer or a trained artificial intelligence algorithm.
After searching the number of identified entries (|Sa|=x0) provides a good esti-mation of the expected value of the answers utility. Applying a focus algorithm (e.g. [15]) yields a refined evaluation of the entity set (|S0a|=x1) resolving geo ambigui-ties. S0a might still contain incorrect answers due to errors in the geo disambiguation or due to ambiguous terms not resolved by the focus algorithm (e.g. turkey/bird versus Turkey/country). Based on the probabilities of a particular answer ai∈Sa/a0i∈S0aof being incorrectPincorr(ai)/Pincorr(a0i)the expected value ufor a given combination of
x0,x1is determined. Evaluating historical error rates yields estimations forPincorr(ai) andPincorr(a0i).
If no historical data is available heuristics based on the number of ambiguous geo-entries are useful for providing an educated guess of the probabilities.
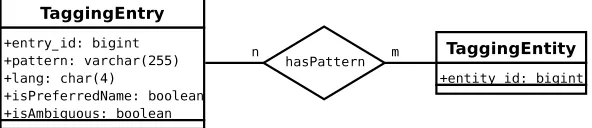
A tagger recognizes patterns based on a pattern database table. The relationhasPattern
translates these patterns to TaggingEntities as for instance spatial locations, persons, and organizations. Figure 4 visualizes a possible database layout for such a tagger.
Fig. 4.Database schema of a simple tagger.
ThehasPatterntable often does not provide a unique mapping between patterns
and entities - names as for instance Vienna may refer to multiple entities (Vienna/Austria versus Vienna/Virgina/US). On the other side many entities have multiple patterns asso-ciated with them (e.g. Wien, Vienna, Vienne, Bech, etc.). Based on the database schema above,Pincorr(ai)for such a tagger is estimated using the following heuristic:
nEntities=|TaggingEntity| (7)
nMappings =|hasPattern| (8)
nambiguous=|σ[isAmbiguous=0true0]( (9)
TaggingEntry∗hasPattern)|
Pincorr=1−
nEntries
nMappings+nambiguous
(10)
5
Evaluation
For evaluating the STS model’s efficiency in real world applications a simulation frame-work, supporting (i) a solely coverage based decision logic and the search test stop model, (ii) artificial (normal distribution) and measured (compare Section 2) distribu-tions of network response times, and (iii) common probability mass funcdistribu-tionsh(x0,x1,u) composed from user definedPincorr(ai)andPincorr(a0i)settings have been programmed.
To prevent the coverage based decision logic from delivering large amounts of low quality answers, the simulation controller only accepts answers with an expected utility above a certain threshold (umin). In contrast the search test stop algorithm computes
umin=rDon the fly, based on the current responsiveness of the external service and the user’s preferences.
5.1 Performance
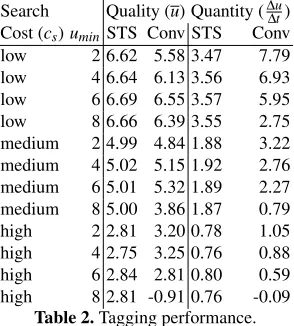
Comparing the two approaches at different minimum quality levels (umin), and service response time distributions approximated by a normal distributionN(t,σ2t)yields
Ta-ble 2. The common probability mass functions has been composed withPincorr(ai) = 0.3,Pincorr(a0i) =0.1. The parameters for the normal distribution arecs=N(2,1.9)for high search costs,cs=N(1,0.9)for medium search costs, andcs=N(0.5,0.4)for low search costs.
Search Quality (u) Quantity (∆u
∆t)
Cost (cs)uminSTS Conv STS Conv
low 2 6.62 5.58 3.47 7.79 low 4 6.64 6.13 3.56 6.93 low 6 6.69 6.55 3.57 5.95 low 8 6.66 6.39 3.55 2.75 medium 2 4.99 4.84 1.88 3.22 medium 4 5.02 5.15 1.92 2.76 medium 6 5.01 5.32 1.89 2.27 medium 8 5.00 3.86 1.87 0.79 high 2 2.81 3.20 0.78 1.05 high 4 2.75 3.25 0.76 0.88 high 6 2.84 2.81 0.80 0.59 high 8 2.81 -0.91 0.76 -0.09
Table 2.Tagging performance.
Table 2 evaluates the two strategies according to two criteria: (i)answer quality u, the average utility of a set (SA) retrieved by the strategy, and (ii)answer quantity ∆∆ut, the rate at which the number of correct answers (and therefore the total utility (u)) grows.
Highuvalues correspond to accepting only high quality results, with a lot of correct answers, and dropping low quality answer sets (at the cost of a lower quantity).
utility. This greedy approach comes at the cost of a lower answer quality and therefore low average utility u per answer. Increasing umin yields a better answer quality, but lower quantity values. At high search costs this strategy’s performance is particularly unsatisfactory, because it doesn’t consider the costs of the search operation.
In contrast to the conventional approach STS maximizes answer quality and quan-tity based on thecurrentsearch cost adjusting queries to the responsiveness of the ser-vice and the user’s preferences. These preferences formalize the trade-off between qual-ity and quantqual-ity by specifying a transformation function between search cost and search times.
-4000 -2000 0 2000 4000 6000 8000 10000
0 20000 40000 60000 80000 100000 120000
utility (u)
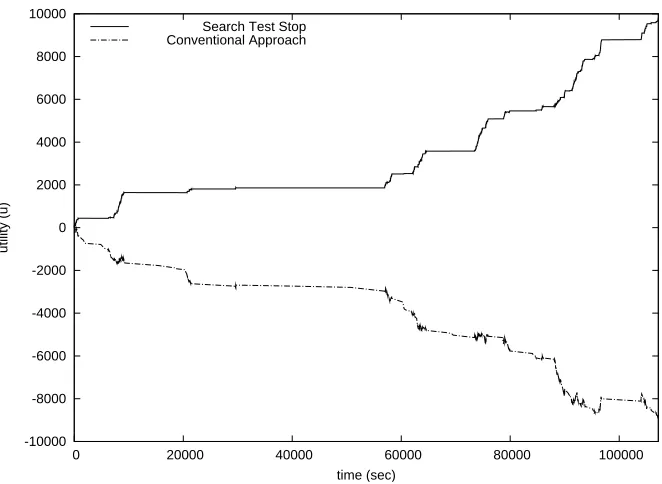
time (sec) Search Test Stop
Conventional Approach
Fig. 5.Search test stop versus conventional decision logic for Swoogle (˜t=1.6;σ2tr>10000).
STS therefore optimizes the agent’s behavior in terms of user utility. This doesnot
mean that STS minimizes resource usage. Instead STS dynamically adjusts the resource utilization based on the cost of searching (cs) and testing (ct), providing the user with optimal results in terms of accuracyandresponse times.
5.2 Web Services
In this section we will simulate the effect of STS on the performance of real world Web services, using search costs as measured during the Web service timing (compare Section 2).
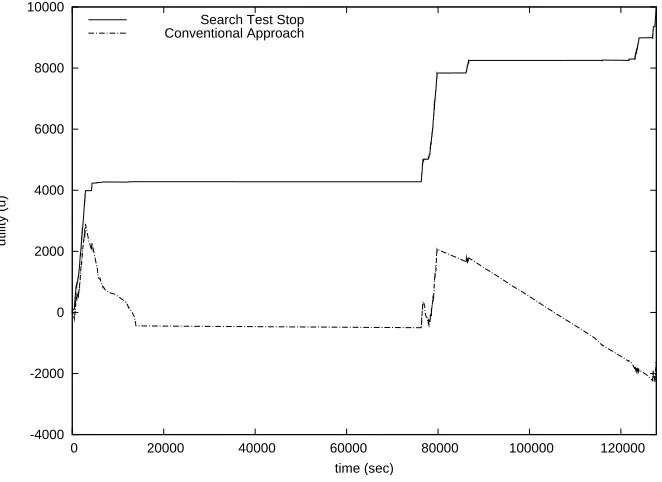
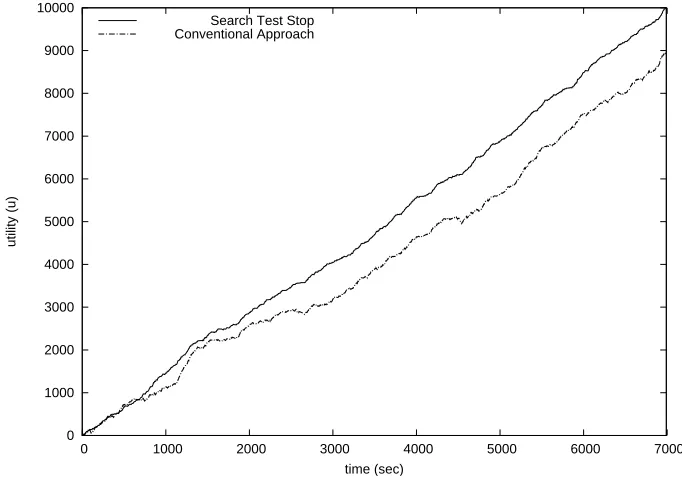
The simulation facilitates the cost and common probability mass functions from Section 5. The figures 5-7 compare the tagger’s performance when providing tagged documents corresponding to a utility score of 10,000 based on three different Web ser-vices (Swoogle, Google, GeoNames) with a minimum utility (umin)of four.
In all three use cases STS performs well, because the search times are adjusted ac-cording to the service’s responsiveness. GeoNames and Swoogle experience the highest performance boost, due to high variances in the search cost, leading to negative utility for the conventional query strategy. Using Google as external resource yields the fastest
0 1000 2000 3000 4000 5000 6000 7000 8000 9000 10000
0 1000 2000 3000 4000 5000 6000 7000
utility (u)
time (sec) Search Test Stop
Conventional Approach
Fig. 6.Search test stop versus the conventional decision logic for Google (˜t=0.2;σt2r=0.2).
processing time. The algorithm is able to provide documents with the required quality level in around 8,300 seconds in contrast to more than 107,000 seconds for GeoNames and more than 129,000 seconds for Swoogle.
Services with low variances (σ2tr) in their response times as for instance Google,
-10000 -8000 -6000 -4000 -2000 0 2000 4000 6000 8000 10000
0 20000 40000 60000 80000 100000
utility (u)
time (sec) Search Test Stop
Conventional Approach
Fig. 7.Search test stop versus the conventional decision logic for GeoNames (˜t=0.1;σ2tr=771.4).
6
Outlook and Conclusions
This work presents an approach for optimizing access to third party remote resources. Optimizing the clients resource access strategy yields higher query performance and spares remote resources by preventing unnecessary queries.
The main contributions of this paper are (i) applying the search test stop model to value driven information gathering, extending its usefulness to domains where one or more testings steps allow refining the estimated utility of the answer set; (ii) demon-strating the use of this approach to semantic tagging, and (iii) evaluating how the search test stop model performs in comparison to a solely value based approach.
The experiments show that search test stop and value driven information gathering perform especially well in domains with highly variable search cost.
Acknowledgment
The author wishes to thank Prof. Wolfgang Janko for his valuable feedback and sug-gestions. The project results have been developed in the IDIOM (Information Diffu-sion across Interactive Online Media; www.idiom.at) project funded by the Austrian Ministry of Transport, Innovation & Technology (BMVIT) and the Austrian Research Promotion Agency (FFG).
References
1. Gupta, C., Bhowmik, R., Head, M.R., Govindaraju, M., Meng, W.: Improving performance of web services query matchmaking with automated knowledge acquisition. In: Web Intelli-gence, IEEE Computer Society (2007) 559–563
2. Grass, J., Zilberstein, S.: A value-driven system for autonomous information gathering. Journal of Intelligent Information Systems14(March 2000) 5–27(23)
3. Kukulenz, D., Ntoulas, A.: Answering bounded continuous search queries in the world wide web. In: WWW ’07: Proceedings of the 16th international conference on World Wide Web, New York, NY, USA, ACM (2007) 551–560
4. Ipeirotis, P.G., Agichtein, E., Jain, P., Gravano, L.: Towards a query optimizer for text-centric tasks. ACM Trans. Database Syst.32(4) (2007) 21
5. Software Engineering Standard Committe of the IEEE Computer Society: IEEE std 830-1999: IEEE recommended practice for software requirements specifications (1998) 6. International Standards Organization JTC 1/SC 7: ISO/IEC 9126-1, 2001. software
engi-neering – product quality – part 1: Quality model (2001)
7. Horvitz, E.J., Breese, J.S., Henrion, M.: Decision theory in expert systems and artificial intelligence. International Journal of Approximate Reasoning2(1988) 247–302
8. MacQueen, J.: Optimal policies for a class of search and evaluation problems. Management Science10(4) (1964) 746–759
9. Hartmann, J.: Wirtschaftliche Alternativensuche mit Informationsbeschaffung unter Un-sicherheit. PhD thesis, Universit¨at Fridericiana Karlsruhe (1985)
10. Lehmann, E.L., Romano, J.P.: Testing Statistical Hypotheses. 3rd edition edn. Springer, New York (2005)
11. Scharl, A., Weichselbraun, A., Liu, W.: Tracking and modelling information diffusion across interactive online media. International Journal of Metadata, Semantics and Ontologies2(2) (2007) 136–145
12. Strunk, J.D., Thereska, E., Faloutsos, C., Ganger, G.R.: Using utility to provision storage systems. In: FAST’08: Proceedings of the 6th USENIX Conference on File and Storage Technologies, Berkeley, CA, USA, USENIX Association (2008) 1–16
13. Verma, A., Jain, R., Ghosal, S.: A utility-based unified disk scheduling framework for shared mixed-media services. Trans. Storage3(4) (2008) 1–30
14. Yeo, C.S., Buyya, R.: Pricing for utility-driven resource management and allocation in clus-ters. International Journal of High Performance Computing Applications21(4) (November 2007) 405–418
15. Amitay, E., Har’El, N., Sivan, R., Soffer, A.: Web-a-where: geotagging web content. In: SI-GIR ’04: Proceedings of the 27th annual international ACM SISI-GIR conference on Research and development in information retrieval, New York, NY, USA, ACM (2004) 273–280 16. Liu, W., Weichselbraun, A., Scharl, A., Chang, E.: Semi-automatic ontology extension