Open Access
Research article
Joint distribution approaches to simultaneously quantifying benefit
and risk
Michele L Shaffer*
1and Kristi L Watterberg
2Address: 1Departments of Health Evaluation Sciences and Pediatrics, Penn State College of Medicine, Hershey, PA, USA and 2Department of
Pediatrics/Neonatology, University of New Mexico, Albuquerque, NM, USA
Email: Michele L Shaffer* - [email protected]; Kristi L Watterberg - [email protected] * Corresponding author
Abstract
Background: The benefit-risk ratio has been proposed to measure the tradeoff between benefits and risks of two therapies for a single binary measure of efficacy and a single adverse event. The ratio is calculated from the difference in risk and difference in benefit between therapies. Small sample sizes or expected differences in benefit or risk can lead to no solution or problematic solutions for confidence intervals.
Methods: Alternatively, using the joint distribution of benefit and risk, confidence regions for the differences in risk and benefit can be constructed in the benefit-risk plane. The information in the joint distribution can be summarized by choosing regions of interest in this plane. Using Bayesian methodology provides a very flexible framework for summarizing information in the joint distribution.
Results: Data from a National Institute of Child Health & Human Development trial of hydrocortisone illustrate the construction of confidence regions and regions of interest in the benefit-risk plane, where benefit is survival without supplemental oxygen at 36 weeks postmenstrual age, and risk is gastrointestinal perforation. For the subgroup of infants exposed to chorioamnionitis the confidence interval based on the benefit-risk ratio is wide (Benefit-risk ratio: 1.52; 90% confidence interval: 0.23 to 5.25). Choosing regions of appreciable risk and acceptable risk in the benefit-risk plane confirms the uncertainty seen in the wide confidence interval for the benefit-risk ratio – there is a greater than 50% chance of falling into the region of acceptable risk – while visually allowing the uncertainty in risk and benefit to be shown separately. Applying Bayesian methodology, an incremental net health benefit analysis shows there is a 72% chance of having a positive incremental net benefit if hydrocortisone is used in place of placebo if one is willing to incur at most one gastrointestinal perforation for each additional infant that survives without supplemental oxygen.
Conclusion: If the benefit-risk ratio is presented, the joint distribution of benefit and risk also should be shown. These regions avoid the ambiguity associated with collapsing benefit and risk to a single dimension. Bayesian methods allow even greater flexibility in simultaneously quantifying benefit and risk.
Published: 12 October 2006
BMC Medical Research Methodology 2006, 6:48 doi:10.1186/1471-2288-6-48
Received: 15 August 2006 Accepted: 12 October 2006
This article is available from: http://www.biomedcentral.com/1471-2288/6/48
© 2006 Shaffer and Watterberg; licensee BioMed Central Ltd.
Background
When comparing the effects of a new therapy with an existing therapy, it is not uncommon for the new therapy to show increased risks along with increased benefits. We consider the case of a single binary measure of efficacy and a single binary measure of risk or adverse event (absent/present, ever/never) and address the questions:
1. How do you appropriately measure the tradeoff between the benefit and risk of two therapies?
2. When should you conclude the increased benefit of a new therapy outweighs the potential increased risk?
Rather than focusing on hypothesis testing and control-ling the type I error rate, our interest is in jointly quantify-ing benefit and risk.
The benefit-risk ratio
One method that has been suggested for measuring the tradeoff between a binary measure of benefit and a binary measure of risk is the risk ratio [1]. The benefit-risk ratio is the ratio of the difference in benefit to differ-ence in risk, or equivalently, the ratio of Number Needed to Harm (NNH) to Number Needed to Treat (NNT):
where pE and pc are the probabilities of benefit in the experimental treatment and control arms, respectively, and qE and qc are the probabilities of risk in the experimen-tal treatment and control arms, respectively.
The benefit-risk ratio can be interpreted as the increase in the number of expected patients who will benefit for each additional adverse event that is incurred from using the experimental treatment rather than the control. The ratio also can be viewed in the benefit-risk plane as the slope of the line that passes through the origin and point defined by the observed difference in risk and difference in benefit as shown in Figure 1. The benefit-risk ratio is similar to the incremental cost-effectiveness ratio (ICER), which meas-ures the tradeoff between the cost and effectiveness of two therapies. The ICER is defined as the ratio of the mean treatment difference in cost to the mean treatment differ-ence in effectiveness for two therapies:
where γE and γC are average costs of the experimental and control conditions, respectively, and εEand εC are average effectiveness measures of the experimental and control
conditions, respectively. One can similarly view the ICER in the cost-effectiveness plane. Distributional assump-tions may differ for the benefit-risk ratio and cost-effec-tiveness ratio with cost generally considered a continuous measure. And while effectiveness appears in the denomi-nator of the ICER, benefit is in the numerator of the ben-efit-risk ratio. Furthermore, although the current discussion focuses on a single binary measure of risk, con-solidating multiple risks into a single measure may be more problematic than combining costs.
There is some ambiguity in reducing the difference in ben-efit and difference in risk to a single measure. As differing magnitudes of benefit and risk can result in the same ratio, control therapy could show more benefit and more risk and yield the same ratio as a new therapy which shows more benefit and more risk. Note in Figure 1 that any observed difference in benefit and observed difference in risk that falls on the line shown through the origin will produce the same benefit-risk ratio. For example, suppose the difference in benefit favors the new therapy over con-trol and is 0.30, but the new therapy also increases the adverse event rate by 0.20; the resulting benefit-risk ratio is 1.5. However, if the difference in benefit favors control over the new therapy and is -0.30, but the new therapy reduces the adverse event rate by 0.20, then the resulting benefit risk ratio also is 1.5. When deciding whether the new therapy is acceptable, it is unlikely that these two
sce-R p p q q
NNH NNT
E C
E C
= −
− =
ICER E C
E C
= −
−
γ γ
ε ε
The benefit-risk ratio in the benefit-risk plane Figure 1
The benefit-risk ratio in the benefit-risk plane. The benefit-risk ratio is the slope of the line which passes through the origin and the point defined by the observed difference in risk and observed difference in benefit.
(-) Difference in Risk (+)
(-) Difference in Benefit (+)
NE Benefit-risk ratio NW
Experimental therapy dominates
SW Benefit-risk ratio
narios would be considered equivalent. In the first sce-nario we are weighing increased benefit against increased risk, while in the latter we are weighing decreased benefit against decreased risk. Heitjan et al. highlighted similar complications for estimation of the ICER [2].
Confidence intervals can be constructed for the benefit-risk ratio using methods similar to those used to compute confidence intervals for cost-effectiveness ratios [3-5]. Assuming bivariate normality, Willan et al. showed that Fieller's theorem can be used to compute confidence intervals where the variance of the bivariate normal distri-bution is given by
where "hats" indicate the observed values of population parameters and bE and bC are the probabilities of simulta-neous benefit and risk in the same subject for the experi-mental treatment and control arms, respectively [1]. The
variance is estimated ( ) by replacing the population parameters with the observed values. Calculation of the confidence limits by Fieller's theorem involves matrix manipulation which can be done in several packages including PROC IML in SAS (SAS Institute, Inc., Cary, NC), Mathematica (Wolfram Research, Inc., Champaign, IL), S-PLUS (Insightful Corporation, Seattle, WA), or the free software R [6]. Alternatively, the bootstrap can be used to construct confidence intervals using the percentile method [7].
Difficulties can arise in using either Fieller's theorem or the bootstrap methods to construct confidence intervals [1,8,4,2,9]. Intractable or problematic solutions can result using Fieller's theorem because of small sample sizes and/ or small expected differences in benefit and/or risk. As shown in Figure 2, the confidence limits of the benefit-risk ratio also can be represented as slopes of lines in the ben-efit-risk plane, and there is a discontinuity in the distribu-tion of the benefit-risk ratio when the difference in risk is 0. For the bootstrap method, it may be unclear how to order estimates from the bootstrap samples when they fall in multiple quadrants. Heitjan et al. proposed reordering the bootstrap samples for the ICER (modified percentile bootstrap), taking into account the quadrant in which the ratio falls [4]. A more complete solution by Heitjan et al. uses Bayesian methodology and treats the ICER as a two-dimensional parameter composed of the ICER value and the quadrant in which the effectiveness difference and
cost difference fall [2]. This methodology has been extended to handle censored effectiveness data [9].
Other simultaneous measures of benefit and risk
Other measures have been suggested to summarize differ-ences in benefit and risk. An early example is the work by Tallarida et al. on a severity scale developed through phy-sician interviews which synthesizes information on dis-ease severity and adverse drug reactions so that these considerations can be quantitatively incorporated into a benefit-risk analysis [10]. Chuang-Stein et al. presented three ratio measures that require assigning weights to cat-egories of the form: (1) benefit without adverse event, (2) benefit with adverse event, (3) no benefit and no adverse event, (4) no benefit with adverse event, and (5) unac-ceptable adverse event leading to withdrawal [11]. While these ratios are more general than the benefit-risk ratio, specifying weights that reflect the relative importance of the categories may be difficult. Later work by Chuang-Stein discounts benefit by risk using consolidated safety data [12,13]. As noted by Holden, these approaches do not clearly delineate benefit and risk which makes their interpretation more complicated than the traditional ben-efit-risk ratio [14].
( )
E C
ˆ ˆ
−
( )
V q q p p
q q
n
q q
n
b p q
n b p E C E E E C C C
E E E
E
C C
([ˆ ˆ , ] )
( ) ( )
′ =
− + − − + −
1 1 qq
n
b p q
n
b p q
n p p n p p n C C
E E E
E
C C C
C E E E C C C − + − − + − 1 1 − ˆ V
Confidence limits in the benefit-risk plane Figure 2
Confidence limits in the benefit-risk plane. The confi-dence limits of the benefit-risk ratio can be represented as slopes of lines (dotted) which pass through the origin. A dis-continuity exists when the difference in risk is 0.
(-) Difference in Risk (+)
(-) Difference in Benefit (+)
Methods
Confidence regions
Rather than collapsing the difference in benefit and differ-ence in risk into a single dimension, the joint density of benefit and risk can be represented in the benefit-risk plane. Similar methods have been proposed for cost-effec-tiveness analyses [15,16]. Confidence regions can be con-structed either under the bivariate normal assumption or using the bootstrap and nonparametric density estima-tion. Assuming bivariate normality, the confidence region is an ellipse. To construct a nonparametric confidence region, we draw repeated (bootstrap) samples with replacement and compute a benefit difference and risk difference for each of the samples. Next we obtain a two-dimensional kernel density estimate using the set of boot-strap estimates and find a contour of the kernel density estimate that includes (1 - α) × 100% of the bootstrap esti-mates [17]. Two-dimensional kernel density estimation methods are available for S-PLUS or R.
In addition to plotting the confidence region in the bene-fit-risk plan, we also can partition the benebene-fit-risk plane into chosen regions of interest, e.g.,
1. Appreciable risk
2. No appreciable benefit
3. No conclusion ("gray region")
4. Experimental therapy superior
and look at the proportion of bootstrap estimates that fall into each region. These regions may be easier to specify for the clinician than the weights needed for the weighted benefit-risk ratios proposed by Chuang-Stein et al. [11].
Bayesian methods
As an alternative to the confidence region approach, using asymptotic theory, Bayesian inference can be based on the posterior distribution of the difference in benefit and dif-ference in risk, assuming that the prior distribution is locally uniform (or continuous and nonzero) near the true difference in risk and difference in benefit [18]. Using the posterior distribution,
the posterior probability of falling into the chosen regions can be computed [19]. The integration required can be carried out using the numerical integration function N
Integrate in Mathematica or similar software. The
proba-bility interpretation of the Bayesian analysis is more straightforward than the confidence interpretation associ-ated with the bootstrapping approach.
Decision analysis also can be conducted under the Baye-sian framework using linear combinations of the form
f(A, B) = A(pE - pC) - B(qE - qC)
Point estimates and probability intervals for these linear combinations can be computed by taking a large number of draws from the posterior distribution and computing f(A, B) for each draw. The median of the draws can be used as a point estimate of f(A, B), and the 100α/2 and 100(1 - α/2) centiles of these draws form a 100(1 - α)% interval estimate.
These linear combinations also can be used to conduct benefit-risk analyses analogous to the incremental net health benefit (INHB)approach used in cost-effectiveness analyses [20,21]. In the cost-effectiveness setting, the
INHB of an experimental treatment compared to a control
is defined as
INHB(λ) = (εE - εC) - (γE - γC)/λ
where λ can be thought of as the maximum society is will-ing to pay for an incremental gain in health [20]. One obvious advantage of this approach is that INHB is meas-ured in units of effectiveness so the quadrant ambiguity of the cost-effectiveness approach is no longer an issue.
Analogously, in the benefit-risk setting, we'll define an incremental health benefit of the experimental therapy compared to the control as
INHBBR(δ) = (pE - pC) - (qE - qC)/δ
where δ can be thought of as the maximum number of adverse events one is willing to incur for each subject that benefits. Alternatively, and perhaps more meaningfully, one can interpret 1/δ as the minimum number of subjects who should benefit for each additional adverse event. Integration over the posterior distribution of the risk dif-ference and benefit difdif-ference can be used to compute
Pr[INHBBR(δ) > 0] for a particular δ value or one can look at a plot of Pr[INHBBR(δ) > 0] over a range of δ values.
Although we have used large sample theory to assume the posterior distribution of the difference in risk and differ-ence in benefit is bivariate normal, this assumption is not necessary for these Bayesian methods. As long as it is pos-sible to simulate draws from the posterior distribution, these point estimates and probability intervals can be cal-culated under other distributional assumptions. Simula-tion approximaSimula-tions to the integraSimula-tion required to compute the posterior probabilities, Pr[INHBBR(δ) > 0], are obtained by computing the percentage of simulation draws for which INHBBR(δ) exceeds 0. Similar simulation
approximations to integration can be used to compute posterior probabilities of falling into chosen regions of interest in the benefit-risk plane.
Results and discussion
The PROPHET study is a multicenter, randomized clinical trial comparing placebo (n = 180) to low-dose hydrocor-tisone therapy (n = 180) in the first two weeks of life in extremely low birth weight babies (500–999 grams) to prevent chronic lung disease sponsored by National Insti-tute of Child Health & Human Development [22]. Enroll-ment was stopped at 360 babies because of an increase in spontaneous gastrointestinal (GI) perforation in the hydrocortisone-treated group. The primary benefit out-come for the study was survival without supplemental oxygen at 36 weeks postmenstrual age. While low-dose hydrocortisone did not significantly improve survival without supplemental oxygen in the overall study popula-tion, within the subgroup of babies exposed to chorioam-nionitis (an a priori subgroup of interest), the hydrocortisone-treated group had significantly higher sur-vival without supplemental oxygen. A benefit-risk analy-sis allows further examination of the relationship between survival without supplemental oxygen and GI perforation in the chorioamnionitis subgroup. Table 1 shows the pro-portion of babies exposed to chorioamnionitis in each treatment group that showed benefit or experienced a GI perforation.
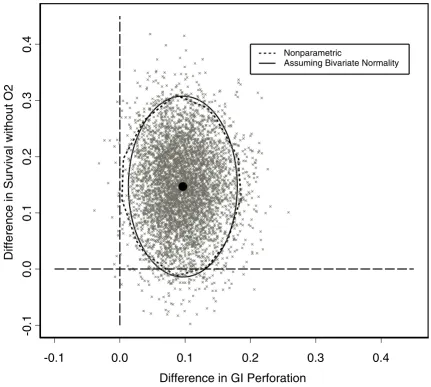
Using Fieller's theorem, the benefit-risk ratio for the chor-ioamnionitis subgroup is 1.52 (90% confidence interval: 0.23 to 5.25). Thus, about 3 additional babies will survive without supplemental oxygen for every 2 GI perforations incurred from using hydrocortisone instead of placebo. We note in this case that the confidence interval is wide and is not inconsistent with as many as 5 babies benefit-ing for each additional adverse event incurred when hydrocortisone is used in place of placebo. The 90% con-fidence ellipse assuming bivariate normality and 90% nonparametric confidence region based on 5000 boot-strap samples are shown in Figure 3. The bootboot-strap esti-mates for the 5000 samples also are shown. Despite the small expected cell counts for GI perforations in the pla-cebo and hydrocortisone groups, for this example the nonparametric and bivariate normal regions are very sim-ilar.
As a hypothetical example of choosing regions of interest for the PROPHET study, we separate the benefit-risk plane into the following regions:
1. Appreciable Risk: Risk difference > 0.10
2. Acceptable Risk: Risk difference ≤ 0.10
a. Hydrocortisone Superior: Benefit difference > 0.20
b. No Conclusion: 0.10 ≤ Benefit difference ≤ 0.20
c. No Appreciable Benefit: Benefit difference < 0.10
Estimates of the probabilities of falling into the selected regions are given in Table 2. The bootstrap proportions and posterior probabilities are similar and show that there is a greater than 50% chance of falling into the region of acceptable risk. However, within the acceptable risk region there is still a substantial chance that no conclusion can be reached.
Alternatively, Figure 4 shows a plot of the probability the incremental net health benefit (INHBBR) of hydrocorti-sone compared to placebo exceeds zero over a range of 1/
δ, which can be interpreted here as the minimum number of babies who should survive without supplemental oxy-gen for each additional GI perforation incurred. If the threshold is one additional survivor without supplemen-tal oxygen for each additional GI perforation, the proba-bility INHBBR(1)exceeds zero is approximately 0.72. This probability quickly drops off and falls below 50% when the threshold is approximately 1.5 additional survivors without supplemental oxygen for each additional GI per-foration.
These findings are not conclusive and demonstrate the need for additional study to determine how hydrocorti-sone therapy might be used to provide benefit in these extremely low birth weight infants without increasing risk of GI perforation. One area of potential investigation is related to indomethacin therapy's role in the develop-ment of GI perforation. There is evidence in the PROPHET study of an interaction between hydrocortisone and early indomethacin therapy, although indomethacin was not randomized in this trial. In the absence of early indometh-acin, low-dose hydrocortisone therapy administered as
Table 1: Survival without supplemental oxygen and GI perforation rates in the PROPHET study by treatment
Placebo (n = 76) Hydrocortisone (n = 73)
Survival without O2 18/76 (24%) 28/73 (38%)
GI Perforation 1/76 (1%) 8/73 (11%)
described for this study has not previously been associated with increased incidence of GI perforation [23]. For this analysis S-PLUS was used to construct the confidence
ellipse and nonparametric region. The two-dimensional kernel density estimation function kde and the ellipse-drawing function ellipse for S-PLUS or R are available from
Table 2: Estimated probabilities of falling into selected regions of interest
Region Proportion of Bootstrap Estimates Posterior Probability
Appreciable risk 0.44 0.46
Hydrocortisone superior 0.14 0.13
No conclusion 0.27 0.27
No appreciable benefit 0.15 0.14
Total 1 1
Confidence regions and bootstrap estimates for the PROPHET study Figure 3
Confidence regions and bootstrap estimates for the PROPHET study. 90% confidence regions and bootstrap esti-mates for the PROPHET study.
-0.1
0.0
0.1
0.2
0.3
0.4
Difference in GI Perforation
-0.1
0.0
0.1
0.2
0.3
0.4
Difference in Survival without O2
Nonparametric
StatLib [24]. Mathematica was used to compute the bene-fit-risk ratio and associated confidence interval and all posterior probabilities, but these computations also can be done using S-PLUS or R.
Conclusion
It is less ambiguous to jointly look at the difference in risk and difference in benefit in the benefit-risk plane than to collapse information by computing a benefit-risk ratio. If the benefit-risk ratio is reported, the joint distribution of benefit and risk also should be presented. When looking at the joint distribution, uncertainty in benefits and risks can be represented by confidence ellipses based on the assumption of bivariate normality or plots of estimates from bootstrap samples with or without a nonparametric confidence region. To quantify the probability of falling into regions of interest, the proportion of bootstrap esti-mates or posterior probabilities can be computed for par-ticular regions. Bayesian methods provide a flexible framework in which to summarize the joint distribution of benefit and risk. Using the Bayesian framework allows
one to easily conduct benefit-risk analyses similar to the incremental net health benefit analyses used for cost-effectiveness research. As this approach is based on linear combinations of benefit and risk, many of the inferential problems associated with ratios are avoided.
We have chosen to focus on the comparison of two thera-pies for a binary measure of benefit and a binary measure of risk, as the motivating PROPHET study had a binary primary benefit outcome and an increased rate of a single adverse event, spontaneous GI perforation, which resulted in an early stop of the trial. However, the Baye-sian methods easily generalize to allow for other distribu-tions of benefit and risk, provided one can simulate samples from the posterior distribution of interest. The Bayesian methods also allow prior information to be incorporated into the inference if such information is available. When it is of interest to compare more than two therapies, the benefit-risk approaches shown can be con-ducted in a pairwise fashion.
PR[INHBBR(δ) > 0] over a range of 1/δ values for the PROPHET study Figure 4
PR[INHBBR(δ) > 0] over a range of 1/δvalues for the PROPHET study. Posterior probabilities that the incremental net health benefit (INHBBR) of hydrocortisone compared to placebo exceeds zero as a function of the minimum number of babies who should survive without supplemental oxygen for each additional GI perforation.
0 0.5 1 1.5 2 2.5 3 3.5 4 4.5 5 5.5 6
Minimum number to benefit for each additional adverse event 1∆ 0
0.1 0.2 0.3 0.4 0.5 0.6 0.7 0.8 0.9 1
Probability
INHB
BR
∆
greater
than
Publish with BioMed Central and every scientist can read your work free of charge "BioMed Central will be the most significant development for disseminating the results of biomedical researc h in our lifetime."
Sir Paul Nurse, Cancer Research UK
Your research papers will be:
available free of charge to the entire biomedical community
peer reviewed and published immediately upon acceptance
cited in PubMed and archived on PubMed Central
yours — you keep the copyright
Submit your manuscript here:
http://www.biomedcentral.com/info/publishing_adv.asp
BioMedcentral
Competing interests
The authors declare that they have no competing interests.
Authors' contributions
MS developed and conducted the statistical analysis and drafted the manuscript. KW conceived of and led the PROPHET study which serves as the illustrative example. All authors participated in the interpretation of the analy-sis and read and approved the final manuscript.
Acknowledgements
Partial support for this research was provided under Grant No. R01 HD038540 from the National Institute of Child Health & Human Develop-ment. The authors would like to thank three reviewers for helpful com-ments that improved the manuscript.
References
1. Willan AR, O'Brien BJ, Cook DJ: Benefit-risk ratios in the assess-ment of the clinical evidence of a new therapy. Control Clin Tri-als 1997, 18:121-130.
2. Heitjan DF, Moskowitz AJ, Whang W: Bayesian estimation of cost-effectiveness ratios from clinical trials. Health Econ 1999, 8:191-201.
3. Willan AR, O'Brien BJ: Confidence intervals for cost-effective-ness ratios: an application of Fieller's theorem. Health Econ 1996, 5:297-305.
4. Heitjan DF, Moskowitz AJ, Whang W: Problems with interval estimates of the incremental cost-effectiveness ratio. Med Decis Making 1999, 19:9-15.
5. Glick H, Polsky D: Evaluating stochastic uncertainty in cost-effectiveness analysis. 2003 [http://www.uphs.upenn.edu/ dgimhsr]. [Society for Medical Decision Making short course] 6. The R Project for Statistical Computing
[http://www.r-project.org]
7. Efron B: The jackknife, the bootstrap and other resampling plans SIAM [Society for Industrial and Applied Mathematics]; 1982.
8. Briggs AH, Wonderling DE, Mooney CZ: Pulling cost-effective-ness analysis up by its bootstraps: a non-parametric approach to confidence interval estimation. Health Econ 1997, 6:327-340.
9. Heitjan DF, Kim CY, Li H: Bayesian estimation of cost-effective-ness from censored data. Stat Med 2004, 23:1297-1309. 10. Tallarida RJ, Murray RB, Eiben C: A scale for assessing the
sever-ity of diseases and adverse drug reactions. Clin Pharmacol Ther 1979, 25:381-390.
11. Chuang-Stein C, Mohberg NR, Sinkula MS: Three measures for simultaneously evaluating benefits and risks using categori-cal data from clinicategori-cal trials. Stat Med 1991, 10:1349-1359. 12. Chuang-Stein C, Mohberg NR, Musselman DM: Organization and
analysis of safety data using a multivariate approach. Stat Med 1992, 11:1075-1089.
13. Chuang-Stein C: A new proposal for benefit-less-risk analysis in clinical trials. Control Clin Trials 1994, 15:30-43.
14. Holden WL: Benefit-risk analysis: a brief review and proposed quantitative approaches. Drug Saf 2003, 26:853-862.
15. van Hout BA, Al MJ, Gordon GS, Rutten FF: Costs, effects and C/ E-ratios alongside a clinical trial. Health Econ 1994, 3:309-319. 16. Noyes K, Holloway RG: Evidence from cost-effectiveness
research. NeuroRx 2004, 1:348-355.
17. Hall P: On the bootstrap and likelihood-based confidence regions. Biometrika 1987, 74:481-493.
18. Gelman A, Carlin JB, Stern HS, Rubin DB: Bayesian Data Analysis Lon-don: Chapman & Hall; 1995.
19. Berger JO: Statistical Decision Theory and Bayesian Analysis Second edi-tion. New York: Springer; 1985.
20. Stinnett AA, Mullahy J: Net health benefits: a new framework for the analysis of uncertainty in cost-effectiveness analysis. Med Decis Making 1998, 18:S68-S80.
21. Willan AR: Analysis, sample size, and power for estimating incremental net health benefit from clinical trial data. Control Clin Trials 2001, 22:228-237.
22. Watterberg KL, Gerdes JS, Cole CH, Aucott SW, Thilo EH, Mammel MC, Couser RJ, Garland JS, Rozycki HJ, Leach CL, Backstrom C, Shaf-fer ML: Prophylaxis of early adrenal insufficiency to prevent bronchopulmonary dysplasia: a multicenter trial. Pediatrics 2004, 114:1649-1657.
23. Watterberg KL, Gerdes JS, Gifford KL, Lin HM: Prophylaxis against early adrenal insufficiency to prevent chronic lung disease in premature infants. Pediatrics 1999, 104:1258-1263. 24. StatLib – Software and extensions for the S (Splus) language
[http://lib.stat.cmu.edu/S]
Pre-publication history
The pre-publication history for this paper can be accessed here: