R E S E A R C H
Open Access
Air concentrations of volatile compounds near
oil and gas production: a community-based
exploratory study
Gregg P Macey
1, Ruth Breech
2, Mark Chernaik
3, Caroline Cox
4, Denny Larson
2, Deb Thomas
5and David O Carpenter
6*Abstract
Background:Horizontal drilling, hydraulic fracturing, and other drilling and well stimulation technologies are now used widely in the United States and increasingly in other countries. They enable increases in oil and gas production, but there has been inadequate attention to human health impacts. Air quality near oil and gas operations is an underexplored human health concern for five reasons: (1) prior focus on threats to water quality; (2) an evolving understanding of contributions of certain oil and gas production processes to air quality; (3) limited state air quality monitoring networks; (4) significant variability in air emissions and concentrations; and (5) air quality research that misses impacts important to residents. Preliminary research suggests that volatile compounds, including hazardous air pollutants, are of potential concern. This study differs from prior research in its use of a community-based process to identify sampling locations. Through this approach, we determine concentrations of volatile compounds in air near operations that reflect community concerns and point to the need for more fine-grained and frequent monitoring at points along the production life cycle.
Methods:Grab and passive air samples were collected by trained volunteers at locations identified through systematic observation of industrial operations and air impacts over the course of resident daily routines. A total of 75 volatile organics were measured using EPA Method TO-15 or TO-3 by gas chromatography/mass spectrometry. Formaldehyde levels were determined using UMEx 100 Passive Samplers.
Results:Levels of eight volatile chemicals exceeded federal guidelines under several operational circumstances. Benzene, formaldehyde, and hydrogen sulfide were the most common compounds to exceed acute and other health-based risk levels.
Conclusions:Air concentrations of potentially dangerous compounds and chemical mixtures are frequently present near oil and gas production sites. Community-based research can provide an important supplement to state air quality monitoring programs.
Keywords:Benzene, Community monitoring, Formaldehyde, Grab and passive samples, Hydraulic fracturing, Hydrogen sulfide, Oil and gas
* Correspondence:[email protected] 6
Institute for Health and the Environment, University at Albany, Rensselaer, New York, USA
Full list of author information is available at the end of the article
© 2014 Macey et al.; licensee BioMed Central Ltd. This is an Open Access article distributed under the terms of the Creative Commons Attribution License (http://creativecommons.org/licenses/by/4.0), which permits unrestricted use, distribution, and reproduction in any medium, provided the original work is properly credited. The Creative Commons Public Domain Dedication waiver (http://creativecommons.org/publicdomain/zero/1.0/) applies to the data made available in this article, unless otherwise stated.
Background
New drilling and well stimulation technologies have led to dramatic shifts in the energy market. The Energy Information Administration forecasts that by the 2030s, the United States will become a net exporter of petro-leum liquids such as shale oil [1]. Already an exporter of natural gas, the U.S. will retrieve nearly half of its gas from shale formations by that time [2]. Reserves such as shale oil and gas are referred to as “unconventional” be-cause fuels within them do not readily flow to the surface [3]. Instead, they are distributed among tight sandstone, shale, and other geologic strata. Intensive practices are used to retrieve them, such as directional drilling (many kilometres underground and one or more kilometres hori-zontally through a formation) and hydraulic fracturing to break up the formation and ensure movement through source rock (using millions of gallons of water mixed with chemicals and sand, or“proppants”) [4]. These technolo-gies present public health challenges, including threats to air quality [5-7].
Unconventional oil and gas (hereinafter “UOG”) de-velopment and production involve multiple sources of physical stressors (e.g., noise, light, and vibrations) [6], toxicants (e.g., benzene, constituents in drilling and hydraulic fracturing fluids) [8], and radiological materials (e.g., technologically-enhanced, naturally-occurring radio-active material) [9], including air emissions [10,11]. Air quality near UOG sites is an underexplored human health concern for several reasons. For a time, environmental scientists and regulators were primarily interested in po-tential impacts to surface and groundwater quality. High-profile impacts and the subsurface nature of technologies (e.g., hydraulic fracturing) encouraged this research tra-jectory [12]. This was true despite the fact that UOG de-velopment brings to the surface, in the case of natural gas, methane (78.3%), non-methane hydrocarbons (17.8%), ni-trogen (1.8%), carbon dioxide (1.5%), and hydrogen sulfide (0.5%) [13]. These constituents, as well as emissions from combustion processes at the surface, are released to the air throughout the life cycle of a productive well [14].
Air emissions from UOG operations have been ge-nerally understood for some time – volatile organic compounds (VOCs), polycyclic aromatic hydrocarbons (PAHs), and criteria air pollutants such as NOx and PM2.5 can be released at the wellhead, in controlled burns (flaring), from produced water storage pits and tanks, and by diesel-powered equipment and trucks, among other sources [15]. Yet the full range of emis-sions from drilling, well completion, and other activities remains elusive. New source categories are discovered, emissions from life cycle stages such as transmission and well abandonment have yet to be determined, and even stages such as drilling continue to present uncertainty [16]. We do not understand the extent of drilling-related
air emissions as pockets of methane, propane, and other constituents in the subsurface are disturbed and released to the atmosphere [17]. Emissions measurements during flowback vary by orders of magnitude [18]. These and other data gaps limit the accuracy of state and federal emissions inventories, which compile and track known emissions sources. Inventories are also limited by self-reporting and data collection, and rely in some cases on outmoded emissions factors [15]. Flawed inventories constrain human health risk assessment and other re-search [7] and slow the identification of phenomena such as photochemical ozone production during winter months [19].
State pollution monitoring networks also constrain re-search on the air impacts of UOG development. His-torically, air quality monitoring targeted urban areas, and criteria air pollutants such as particulate matter and ozone precursors were the primary chemicals of concern [10]. Monitoring stations were designed to ensure compliance with National Ambient Air Quality Standards (NAAQS) for a half-dozen pollutants. Even networks that focus on oil and gas emissions, such as one operated by public health officials in Garfield County, Colorado, do not target individual well pads. The Garfield County network encompasses five sites to monitor a suite of VOCs and (at three sites) particulate matter, in a jurisdiction that covers nearly 3,000 square miles of complex terrain [20]. The Texas Commission on Environmental Quality has arguably the most extensive monitoring network for UOG air emissions in oil and gas regions. Its monitors were sited to minimize urban source impacts and target loca-tions where the public might be exposed to air emissions [21]. Still, its networks can be sparse; there are five per-manent monitoring stations in the Eagle Ford Shale re-gion, where 7,000 oil and gas wells have been drilled since 2008 [22]. These and other limited networks potentially mask local hot spots, the effects of unique topography, and fugitive emissions at certain well pads.
improvements in technology, and regulatory changes; (6) the effects of wind, complex terrain, and microclimates; and (7) considerable differences among states in permit-ting, leak detection and repair, and other requirements [10,16,23-25]. Wind, for example, can influence outdoor and indoor concentrations of air pollutants. Brown et al. found that local air movement and mixing depth contri-bute to peak exposure to VOCs one mile from a compres-sor station [25]. Colborn et al. noted the role of wind and topography in higher VOC concentrations during winter months, when inversions trap air near ground level [10]. Fuller et al. identified wind speed and wind direction as significant predictors of indoor particulate matter levels near highways [26]. Similar variation can be found within and across geologic formations. Unconventional wells in the Barnett Shale play, for example, differ considerably in terms of reservoir quality, production rates, and recover-able gas [27]. Domestic shale gas plays exhibit even greater diversity, including depth and thickness of recoverable re-sources, the amount and range of chemicals present in produced water, and the presence of constituents such as bromide, naturally occurring radioactive material, hydro-gen sulfide, and other toxic elements [23,28].
These and other sources of variability, and the adaptive drilling and well completion techniques they encourage, complicate the design of setback and well spacing rules that are protective of the public. They also explain why air quality studies carried out in UOG re-gions yield conflicting results. For example, McKenzie et al. [11] found greater cumulative cancer risks and higher non-cancer hazard indices for residents living less than 0.5 miles from certain well pads in Colorado, while Bunch et al. [21] analyzed data from monitors focused on regional atmospheric concentrations in the Barnett Shale region and found no exceedance of health-based comparison values. Colborn et al. [10] gathered weekly, 24-hour samples 0.7 miles from a well pad in Garfield County, and noted a “great deal of variability across sampling dates in the numbers and concentrations of chemicals detected.” Eapi et al. [29] found substantial variation in fenceline concentrations of methane and hydrogen sulfide, which could not be explained by pro-duction volume, number of wells, or condensate volume at natural gas development sites.
Institutional factors also influence research on ambient air quality near UOG sites. Congressional exemption of oil and gas operations from provisions of the Clean Air Act, Clean Water Act, Safe Drinking Water Act, Emergency Planning and Community Right-to-Know Act, and other statutes limits data collection on the impacts of oil and gas development [30,31]. In addition, the peer-reviewed litera-ture is divided between“top-down”and“bottom-up” treat-ments of air quality. The first set of studies explores the impact of UOG operations on regional air quality, with a
concern for methane emissions and ozone precursors in re-gions such as the Green River Basin in Wyoming [32], the Uintah Basin in northeastern Utah [33], and the Denver-Julesburg Basin, home of the Wattenberg Field in north-eastern Colorado [34]. These studies rely on airborne and tower measurements, and are at times supplemented by ground measurements such as mobile monitoring.
For example, Petron et al. [35] found a strong alkane signature downwind from the Denver-Julesburg Basin, based on samples taken at a 300-m tall tower (the National Oceanic and Atmospheric Administration Boulder Atmospheric Observatory) and a mobile monitoring unit. In the Uintah Basin, where winter ozone levels exceeded the NAAQS 68 times in 2010, Helmig et al. [36] carried out vertical profiling of ozone precursors at a tower at the northern edge of a gas field. They found levels of at-mospheric alkanes during temperature inversion events in 2013 that were 200–300 times greater than regional back-ground. These and other“top-down”studies are also used to estimate methane leakage, which is helpful in com-paring the climate-forcing impact of UOG to the use of coal-fired power plants. Loss rate estimates for methane and other hydrocarbons vary considerably by study, from 17% [37] (Los Angeles Basin) to 8.9% [38] (Uintah Basin) (6.2-11.7%, 95% C.I.) to 4% [35] (Denver-Julesburg Basin) (2.3-7.7%, 95% C.I.). A number of studies share the finding that EPA underestimates methane leakage rates across the life cycle (their estimate was 1.65% in 2013) [16], but others, extrapolating from emissions factors and/or direct measurement, produce estimates as low as 0.42% [18]. None of these studies attempts to characterize air concen-trations within residential or publicly-accessible areas near UOG operations.
Other studies follow a “bottom-up” approach to air quality, which is limited by access to well pads and other infrastructure, the availability of a power source for mo-nitoring equipment, the stage of operation underway, scheduled or unscheduled flashing, flaring, and fugitive releases, or movement of truck traffic and equipment at or near a well pad during a given sampling period. Thus, bottom-up studies vary in terms of distance to site, sample frequency, and chemicals targeted. This helps explain the range of findings in the published literature. Nevertheless, existing research gives support to resident reports of acute and long-term health symptoms and other reductions in quality of life. Even as they offer conflicting evidence of the relative importance of one stage of production or another to air emissions [10,11], or differ in their ultimate conclusion regarding the existence [10,11,14,35,36,39] or lack [21,40,41] of hu-man health threats from air emissions, they find VOC concentrations in ambient air considerable distances from well pads, including in residential areas and public spaces.
Maceyet al. Environmental Health2014,13:82 Page 3 of 18
The research questions that guide existing studies create a final barrier to our ability to characterize air emissions in UOG regions. Top-down studies are motivated by questions such as identifying sources of regional nonat-tainment of ozone standards, or estimating methane and other hydrocarbon leakage rates from UOG operations. Bottom-up research gathers data from one or a limited number of well pads, chosen for reasons such as access or cooperation by owners and operators. The data are used to discuss general exposure conditions for an often-hypothetical community, or used to derive a risk factor. In either mode of study, resident exposure does not directly motivate the sampling protocol. Rather, it is considered obliquely in a study’s choice of sample location (e.g., a one that is “near a small community”), assumed in measure-ments of concentrations within a certain distance of UOG activity, or ignored. What are missing from these studies are protocols grounded in a community’s experience of air quality impacts of UOG operations.
Our multi-state air quality monitoring study uses a community-based, participatory research (CBPR) design to explore conditions near UOG operations [42]. Its sampling protocol is based not on access to a well pad, data needs conditioned by an existing averaging stand-ard, or regional policy concerns. Rather, we partnered with residents in UOG regions to measure air quality under circumstances that, given local knowledge of operations (e.g., emissions from particular equipment or intermittent practices) gained through daily routines (e.g., regular observation of well pads) and use of public and private spaces nearby (e.g., livestock movement, farming) were viewed by community members as poten-tial threats to human health. Existing studies often lack a data set suitable for statistical analysis. When such ana-lyses are occasionally imposed on bottom-up data sets, they explain only a fraction of the variance in air quality outcomes. For example, the highest R2values in a study of 66 sites, which, due to the study’s broad spatial range was limited to measurements of methane and hydrogen sulfide, were 0.26 (H2S concentration vs. condensate vo-lume nearby) and 0.17 (H2S and number of wells nearby) [29]. CBPR studies, by comparison, are place-based – they begin with the experience of a population in order to identify environmental stressors and explore the heterogeneity of circumstances under which they arise [43,44]. Rather than discount these circumstances for lack of statistical power, they can be used to define the scope of confirmatory studies, tailor air quality monito-ring networks and studies, or suggest novel pollution control measures and best management practices.
Methods
We explore air quality at a previously neglected scale: near a range of UOG development and production sites
that are the focus of community concern. Residents con-ducted sampling in response to operational conditions, odor events, and a history of the onset of acute symp-toms. Residents selected sampling sites after they com-pleted a training program run by Global Community Monitor (GCM), an organization that has developed and modified community-based sampling protocols for more than twenty years. Sampling is designed to obtain accu-rate readings of public exposure near UOG development in the part-per-billion range [45]. Training sessions followed a written manual on proper sampling protocol and included instruction by experienced members of GCM in a classroom setting for five hours. In addition, samplers were trained in the field to properly demonstrate Quality Assurance/Quality Control (QA/QC) methods, such as use of data sheets and chain of custody records, sampling procedures including not taking samples in the presence of vehicle traffic or other sources of VOCs, and protocols for storage and delivery to an analytic laboratory [45]. Chain of Custody forms provided by the laboratory were explained and filled out in exercises in which each sampler participated. The trainings for community-based air sampling and related QA/QC measures were deve-loped in conjunction with the Environmental Protection Agency under the federal Environmental Monitoring for Public Access and Community Tracking (EMPACT) pro-gram, and refined in cooperation with agencies including the Health Services Department of Contra Costa County, California and the Delaware Department of Natural Re-sources [46,47]. Any sample that did not meet QA/QC criteria was not included in the final data set.
Community monitors gauged industrial activity using field log sheets (“pollution logs”) that allow each resident to record what they see, hear, feel, smell, and taste in areas downwind of industrial activity as they go about their daily routines. Each community monitor partici-pated voluntarily in data collection for this study. They provided consent to use data gathered with question-naires that they co-designed as well as grab and passive samplers. Residents documented activity including: (a) visible emissions drifting off-site; (b) odors that appear to derive from a site; (c) acute health symptoms that occur while in proximity to a site or during a specific in-dustrial activity; (d) audible sounds of particular equip-ment in use within the boundaries of an operating well pad or related infrastructure; and (e) visible activity on-site, including the number and types of heavy trucks and tanks, vehicle traffic, workers present and job categories, and physical changes such as noise and vibrations near cer-tain equipment. Similar to a neighborhood police watch, each resident determined locations that they would con-tinue to observe and potentially return to for sampling.
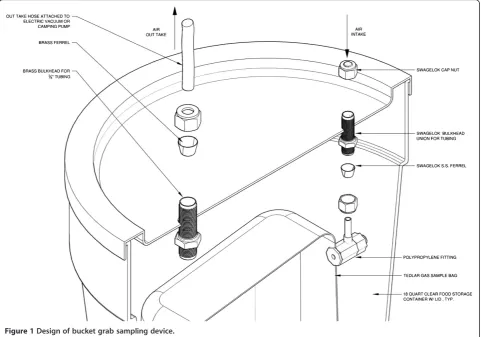
O’Rourke and Macey [48] and Larson et al. [49] using an evacuated sampling (“bucket”) vessel modelled after the Summa canister [50]. The bucket is inexpensive, portable, and consists of a 10-liter Tedlar bag and vac-uum to take a grab sample of air for two to three mi-nutes (Figure 1). Air is collected using a battery-operated pump that forces air out of the bucket. Nega-tive pressure created inside the sealed bucket by the ex-ternal vacuum pump opens the bag when a stainless steel bulkhead is opened. After taking the sample, the Tedlar bag is sealed and sent to an analytical laboratory. The bucket sampler operates on the same principle that Summa canisters employ. Rather than collect a sample in a stainless steel can, the bucket contains a special bag made of Tedlar to hold the sample. Bags are obtained from the laboratory that processes the sample and purged three times with pure nitrogen by the laboratory prior to use. GCM’s founder developed the sampling program under a project for Communities for a Better Environment, a non-profit organization founded in 1978 that provides legal, scientific, and technical assistance to heavily polluted communities. The device has been sub-jected to numerous validation tests organized by go-vernment agencies and independent laboratories [51-54].
Refinements include the use of field duplicates, which demonstrate no significant variation in results across comparison studies [45].
Residents collected 35 grab samples at locations of com-munity concern, under conditions that would lead them to register a complaint with relevant authorities such as a county public health department or state oil and gas com-mission. Health symptoms contributed to the decision to take a grab sample on 29 occasions. The most common symptoms reported by samplers were headaches (17 re-ports), dizziness or light-headedness (13 rere-ports), irritated, burning, or running nose (12 reports), nausea (11 reports), and sore or irritated throat (11 reports). Further details regarding each sample are provided in Additional file 1 (Tables S1 through S5).
In addition to grab samples, 41 formaldehyde badges were deployed in the five states targeting production facilities and compressor stations based on the results of pollution patrols. UMEx100 Passive Samplers for For-maldehyde are manufactured by SKC Inc. Samplers were placed near operating compressor stations and produc-tion facilities for a minimum of eight hours.
Samples were ultimately collected near production pads, compressor stations, condensate tank farms, gas
Figure 1Design of bucket grab sampling device.
Maceyet al. Environmental Health2014,13:82 Page 5 of 18
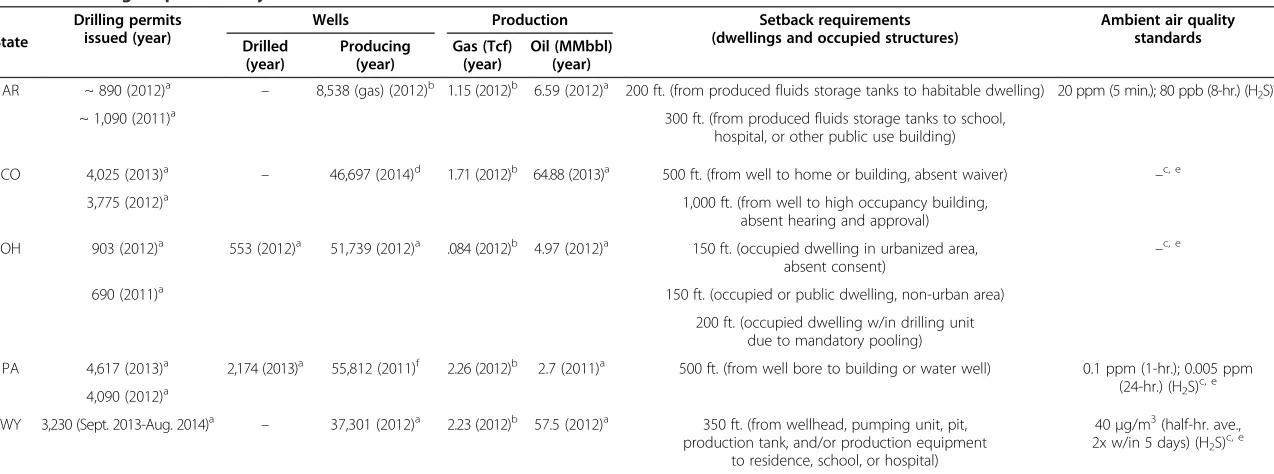
processing stations, and wastewater and produced water impoundments in five states (Arkansas, Colorado, Ohio, Pennsylvania, and Wyoming). The states were chosen to reflect a diverse range of urban and rural communities, operations (e.g., number of wells permitted and deve-loped), history of development, and stages of production (see Table 1).
Air samples were analyzed for 75 volatile organic com-pounds (VOCs), including benzene, ethylbenzene, acrylo-nitrile, methylene chloride, toluene, hexane, heptane, and xylene by ALS Laboratories (Simi Valley, CA 93065) using EPA Method TO-15 or TO-3 (methane) by gas chromato-graph/mass spectrometer interface to a whole air precon-centrator. Formaldehyde samples were analyzed using EPA Method TO-11A, modified for the sampling device by high performance liquid chromatography with UV de-tection. Samples were also analyzed for 20 sulfur com-pounds by ASTM D 5504–08 using a gas chromatograph equipped with a sulfur chemiluminescence detector. All compounds with the exception of hydrogen sulfide and carbonyl sulfide were quantitated against the initial cali-bration curve for methyl mercaptan. Chemicals of concern were compared to U.S. Agency for Toxic Substances and Disease Registry (ATSDR) minimal risk levels (MRLs) and EPA Integrated Risk Information System (IRIS) cancer risk levels. MRLs are estimates of daily human exposure that can occur without appreciable risk of human health effects. They are derived for acute (1–14 days), interme-diate (15–364 days), or chronic (365 days or longer) pe-riods of exposure. The laboratory is certified by ten state departments of health or environment, the American Industrial Hygiene Association, and the U.S. Department of Defense.
Results
Table 1 shows the diverse range of operation, including number of wells permitted and developed and setbacks from housing and other occupied structures, in UOG re-gions where grab and passive air samples were collected through partnership with community-based organizations.
Air contaminants
We identified unique chemical mixtures at each sample location (see Tables S1 through S5 in Additional file 1). In addition, we identified eight volatile compounds at concentrations that exceeded ATSDR minimal risk le-vels (MRLs) or EPA Integrated Risk Information System (IRIS) cancer risk levels (see Table 2). Although our sam-ples represent a single point in time, we compared con-centrations to acute as well as chronic risk levels as many of the activities that generate volatile compounds near UOG operations are long-duration (the life cycle of an unconventional natural gas well can span several decades) [16]. Residents chose sample locations where
odors and symptoms were the“norm”for the area, not a one-time event. In addition, a growing body of research suggests that peak (e.g., 1-hr. maximum), rather than average exposure to air emissions may better capture certain risks to human health [55-57].
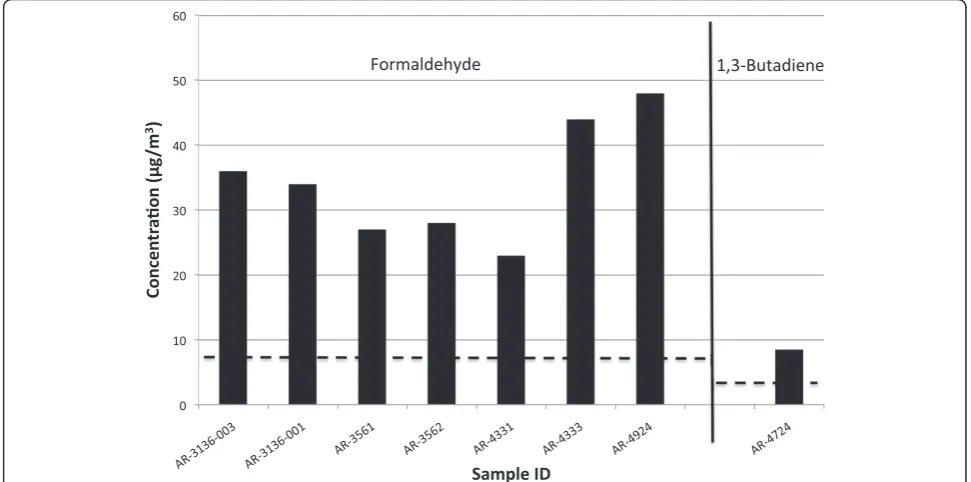
Sixteen of the 35 grab samples, and 14 of the 41 passive samples, had concentrations of volatiles that exceeded ATSDR and/or EPA IRIS levels. ATSDR MRLs and EPA IRIS levels for chemicals of concern are provided in Table 2. The chemicals that most commonly exceeded these levels were hydrogen sulfide, formaldehyde, and benzene. Background levels for these chemicals are 0.15μg/m3for hydrogen sulfide, 0.25μg/m3for formalde-hyde, and 0.15 μg/m3 for benzene [58-60]. Our samples that exceeded health-based risk levels were 90–66,000× background levels for hydrogen sulfide, 30-240× back-ground levels for formaldehyde, and 35–770,000× back-ground levels for benzene. Details of our results are presented in Tables 3, 4, and 5 and in Figures 2, 3, and 4 (greater detail is provided in Additional file 1). A state-by-state summary follows.
Wyoming (Park County)
Nine of the ten grab samples contained volatiles above ATSDR MRLs or EPA IRIS risk levels. Seven contained high concentrations of hydrogen sulfide (one was over 600× the ATSDR acute MRL) and three contained high levels of benzene, including one over 12,000× the ATSDR acute MRL. The sample with the highest benzene concentrations also contained 480,000 micrograms per cubic meter of heptane, 3,100,000 micrograms per cubic meter of pentane, and 4,100,000 micrograms per cubic meter of butane, all hydrocarbons that are frequently asso-ciated with methane. These hydrocarbon concentrations exceeded occupational health standards (NIOSH recom-mended exposure limits). Four of the seven samples with high levels of hydrogen sulfide were taken in northeast Park County (near Deaver), and three of the four samples with high benzene levels were taken in northwest Park County (near Clark). One of the five passive samples con-tained formaldehyde at levels that exceeded ATSDR MRLs and the 1/10,000 cancer risk level (Table 3, Figure 2).
Wyoming (Fremont County)
Table 1 Oil and gas operations by state
State
Drilling permits issued (year)
Wells Production Setback requirements
(dwellings and occupied structures)
Ambient air quality standards Drilled
(year)
Producing (year)
Gas (Tcf) (year)
Oil (MMbbl) (year)
AR ~ 890 (2012)a – 8,538 (gas) (2012)b 1.15 (2012)b 6.59 (2012)a 200 ft. (from produced fluids storage tanks to habitable dwelling) 20 ppm (5 min.); 80 ppb (8-hr.) (H2S) c
~ 1,090 (2011)a 300 ft. (from produced fluids storage tanks to school,
hospital, or other public use building)
CO 4,025 (2013)a – 46,697 (2014)d 1.71 (2012)b 64.88 (2013)a 500 ft. (from well to home or building, absent waiver) –c, e
3,775 (2012)a 1,000 ft. (from well to high occupancy building,
absent hearing and approval)
OH 903 (2012)a 553 (2012)a 51,739 (2012)a .084 (2012)b 4.97 (2012)a 150 ft. (occupied dwelling in urbanized area,
absent consent) –
c, e
690 (2011)a 150 ft. (occupied or public dwelling, non-urban area)
200 ft. (occupied dwelling w/in drilling unit due to mandatory pooling)
PA 4,617 (2013)a 2,174 (2013)a 55,812 (2011)f 2.26 (2012)b 2.7 (2011)a 500 ft. (from well bore to building or water well) 0.1 ppm (1-hr.); 0.005 ppm (24-hr.) (H2S)
c, e 4,090 (2012)a
WY 3,230 (Sept. 2013-Aug. 2014)a
– 37,301 (2012)a 2.23 (2012)b 57.5 (2012)a 350 ft. (from wellhead, pumping unit, pit, production tank, and/or production equipment
to residence, school, or hospital)
40μg/m3(half-hr. ave., 2x w/in 5 days) (H2S)
c, e
a
State agency data.
b
U.S. Energy Information Administration data.
c
In addition to National Ambient Air Quality Standards for criteria air pollutants and federal emissions standards–new source performance standards (40 C.F.R. §§ 60.5360 - 60.5430) and national emission standards for hazardous air pollutants (40 C.F.R. §§ 63.760 - 63.777)–applicable to the oil and gas industry.
d
Personal communication with state agency.
e
In addition to state emissions standards (e.g., VOC emissions from glycol dehydrators; green completions; valve requirements for pneumatic devices). See, for example, Colorado Department of Public Health and Environment’s revised Air Quality Control Commission Regulation Numbers 3, 6, and 7 (adopted 23 February 2014).
f
Earthworks data.
Macey
et
al.
Environme
ntal
Health
2014,
13
:82
Page
7
o
f
1
8
http://ww
w.ehjourna
l.net/content
Table 2 ATSDR minimal risk levels and EPA IRIS cancer risk levels for chemicals of concern (all data inμg/m3)
Chemical ATSDR MRLs IRIS cancer risk levels
Acute Intermediate Chronic 1/1,000,000 1/100,000 1/10,000
Benzene 29 20 10 .45 4.5 45
1,3 butadiene 0.03 0.3 3
Ethylbenzene 21,700 8,680 260
Formaldehyde 49 37 10 0.08 0.8 8
N-hexane 2,115
Hydrogen sulfide 98 28
Toluene 3,750 300
Xylenes 8,680 2,604 217
Table 3 Concentrations of volatile compounds exceeding health-based risk levels in samples collected in Wyoming
State/ID County Nearest infrastructure Chemical Concentration
(μg/m3) ATSDR MRLsexceeded EPA IRIS cancerrisk exceeded
WY-4586 Fremont 5 m from separator Hydrogen sulfide 590 I, A n/a
WY-4586 Fremont 5 m from separator Benzene 2,200 C, I, A 1/10,000
WY-4586 Fremont 5 m from separator Toluene 1,400 C n/a
WY-4586 Fremont 5 m from separator Ethylbenzene 1,200 C n/a
WY-4586 Fremont 5 m from separator Mixed xylenes 4,100 C, I n/a
WY-4586 Fremont 5 m from separator n-hexane 22,000 C n/a
WY-1103 Fremont 20 m from separator benzene 31 C, I, A 1/100,000
WY-2069 Fremont 110 m from work-over riga Hydrogen sulfide 30 I n/a
WY-4861 Fremont 5 m from separator Benzene 230 C, I, A 1/10,000
WY-4861 Fremont 5 m from separator Mixed xylenes 317 C n/a
WY-4861 Fremont 5 m from separator n-hexane 2,500 C n/a
WY-4478 Park 25 m from separator Hydrogen sulfide 91 I n/a
WY-4478 Park 25 m from separator Benzene 110,000 C, I, A 1/10,000
WY-4478 Park 25 m from separator Toluene 270,000 C, A n/a
WY-4478 Park 25 m from separator Mixed xylenes 135,000 C, I, A n/a
WY-4478 Park 25 m from separator n-hexane 1,200,000 C n/a
WY-129 Park 55 m from separator benzene 100 C, I, A 1/10,000
WY-3321 Park 5 m from compressor benzene 35 C, I, A 1/100,000
WY-4883-005 Park 5 m from compressor Formaldehyde 46 C, I 1/10,000
WY-4864 Park 5 m from discharge canal Hydrogen sulfide 210 I, A n/a
WY-4865 Park 10 m from discharge canal Hydrogen sulfide 1,200 I, A n/a
WY-4496 Park 20 m from well pad Hydrogen sulfide 6,100 I, A n/a
WY-106 Park Adjacent to discharge canal Hydrogen sulfide 5,600 I, A n/a
WY-184 Park 15 m from discharge canal Hydrogen sulfide 240 I, A n/a
WY-187 Park 15 m from discharge canal Hydrogen sulfide 66,000 I, A n/a
WY-187 Park 15 m from discharge canal Benzene 23 C, I 1/100,000
C = chronic; A = acute; I = intermediate.
a
volatiles at concentrations that exceeded ATSDR MRLs or EPA IRIS cancer risk levels (Table 3, Figure 2).
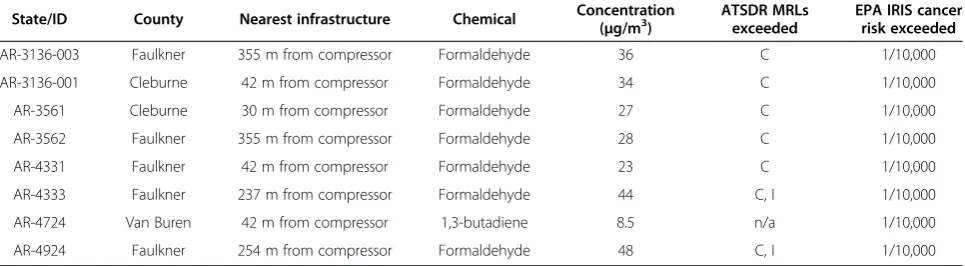
Arkansas (Cleburne, Faulkner, and Van Buren Counties) One of the 8 grab samples, and 7 of the 13 passive sam-ples, contained volatiles above ATSDR MRLs or EPA IRIS risk levels. One of the passive samples (taken at a residence) had formaldehyde levels that were close to the ATSDR MRL and exceeded EPA’s 1/10,000 cancer risk level (Table 4, Figure 3).
Pennsylvania (Susquehanna County)
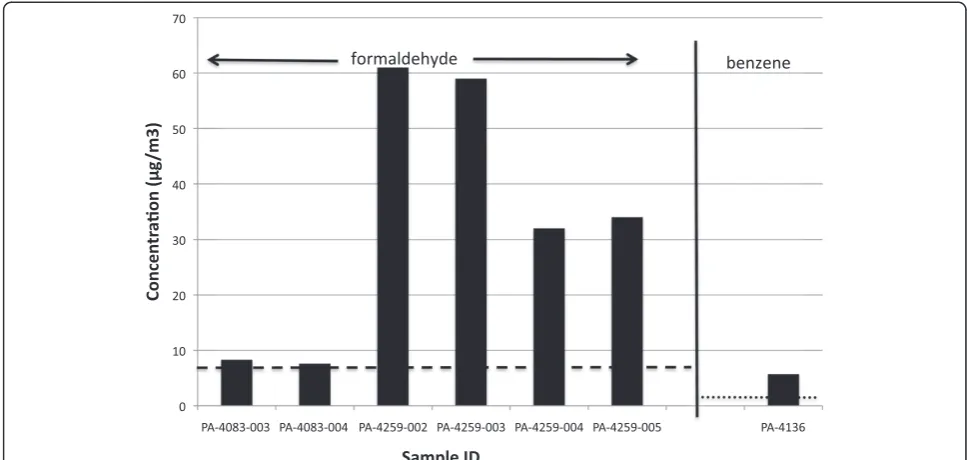
One of the four grab samples contained benzene at con-centrations that exceeded the EPA 1/100,000 cancer risk level. Six of the ten passive samples contained formal-dehyde at levels that exceeded ATSDR MRLs or EPA IRIS risk levels. Two of the samples exceeded both the acute MRL and the 1/10,000 cancer risk level (Table 5, Figure 4).
Colorado (Boulder and Weld Counties)
One of the five grab samples contained 41 micrograms per cubic meter of hydrogen sulfide and exceeded the
ATSDR intermediate MRL. None of the passive samples had volatiles exceeding the ATSDR MRLs or EPA IRIS risk levels.
Ohio (Athens, Carroll, and Trumbull Counties)
None of the four grab samples or five passive samples contained volatiles at concentrations that exceeded the ATSDR MRLs or EPA IRIS risk levels.
State air quality monitoring survey
We reviewed air quality monitoring by state agencies in the five states covered by our sampling. We reviewed one study in Arkansas, seven in Colorado, one in Ohio, four in Pennsylvania, and one in Wyoming. Most of the studies measured VOC levels, two included hydrogen sulfide, and seven included methane and/or other hydro-carbons. Sampling durations ranged from four hours to 24 months; five of the studies lasted more than four weeks. Target compounds were detected in all studies that have been completed, including mixtures of 42 non-methane VOCs. None of the studies concluded that de-tected compounds posed significant human health risk (Table 6).
Table 4 Concentrations of volatile compounds exceeding health-based risk levels in samples collected in Arkansas
State/ID County Nearest infrastructure Chemical Concentration(
μg/m3) ATSDR MRLsexceeded EPA IRIS cancerrisk exceeded
AR-3136-003 Faulkner 355 m from compressor Formaldehyde 36 C 1/10,000
AR-3136-001 Cleburne 42 m from compressor Formaldehyde 34 C 1/10,000
AR-3561 Cleburne 30 m from compressor Formaldehyde 27 C 1/10,000
AR-3562 Faulkner 355 m from compressor Formaldehyde 28 C 1/10,000
AR-4331 Faulkner 42 m from compressor Formaldehyde 23 C 1/10,000
AR-4333 Faulkner 237 m from compressor Formaldehyde 44 C, I 1/10,000
AR-4724 Van Buren 42 m from compressor 1,3-butadiene 8.5 n/a 1/10,000
AR-4924 Faulkner 254 m from compressor Formaldehyde 48 C, I 1/10,000
C = chronic; I = intermediate.
Table 5 Concentrations of volatile compounds exceeding health-based risk levels in samples collected in Pennsylvania
State/ID County Nearest infrastructure Chemical Concentration
(μg/m3) ATSDR MRLsexceeded EPA IRIS cancerrisk exceeded
PA-4083-003 Susquehanna 420 m from compressor Formaldehyde 8.3 1/10,000
PA-4083-004 Susquehanna 370 m from compressor Formaldehyde 7.6 1/100,000
PA-4136 Washington 270 m from PIG launcha Benzene 5.7 1/100,000
PA-4259-002 Susquehanna 790 m from compressor Formaldehyde 61 C, I, A 1/10,000
PA-4259-003 Susquehanna 420 m from compressor Formaldehyde 59 C, I, A 1/10,000
PA-4259-004 Susquehanna 230 m from compressor Formaldehyde 32 C 1/10,000
PA-4259-005 Susquehanna 460 m from compressor Formaldehyde 34 C 1/10,000
C = chronic; A = acute; I = intermediate.
a
Launching station for pipeline cleaning or inspection tool.
Maceyet al. Environmental Health2014,13:82 Page 9 of 18
Discussion
We identified significant concentrations of four well-characterized chemicals: benzene, formaldehyde, hexane, and hydrogen sulfide. Benzene was detected at sample locations in Pennsylvania and Wyoming. Concentrations exceeded health-based risk levels by as many as several or-ders of magnitude. Previous studies similarly found ben-zene concentrations near oil and gas development [10,11]. Our monitors detected benzene at higher concentrations
(5.7 –110,000 μg/m3) than those found in the published literature. The results are of concern given their proximity to subdivisions, homes, and farms. In Wyoming, multiple samples with high benzene concentrations were taken on residential property 30–350 yards from the nearest well, or on farmland along the perimeter of a well pad. Equipment included separators, compressor stations, discharge canals, and pipeline cleaning operations. The results suggest that existing regulatory setback distances from wells to Figure 2Concentrations of volatile compounds exceeding health-based risk levels in samples collected in Wyoming.Note log scale on y-axis. Dashed lines represent ATSDR intermediate-term MRLs. Dotted lines represent ATSDR chronic MRLs (not displayed: toluene, ethylbenzene, and formaldehyde).
residences may not be adequate to reduce human health risks [61]. Setbacks from wellheads to homes and other occupied structures cluster around the 150 to 500 feet range in the five states (see Table 1). We found high concentrations of volatile compounds at greater distances, including formaldehyde (up to 2,591 feet) and benzene (up to 885 feet). High levels of benzene near oil produc-tion wells indicate that EPA should revisit the extent to which oil wells are addressed in its new source perfor-mance standards [62].
Benzene is a known human carcinogen. Chronic expos-ure to benzene increases the risk of leukemia [63]. The in-creased risk occurs at low levels of exposure with no evidence of threshold level [64]. Benzene exposure in-creases risk of birth defects [65], including neural tube and other defects found near natural gas development [24]. Respiratory effects include pulmonary edema, acute granular tracheitis, laryngitis, and bronchitis [60].
UOG fields present multiple sources and exposure routes for benzene. Benzene occurs naturally in shale and other hydrocarbon deposits, and is vented, flared, or released as fugitive emissions along numerous points of production, such as wells, production tanks, compressors, and pipelines [6]. It can volatize and disperse from flowback and pro-duced water at drilling sites and remain in the air for sev-eral days [66]. It was among the first pollutants found in air samples near shale gas operations [67]. Previous studies found benzene to be the largest contributor to excess life-time cancer risk near gas fields [12]. Residents exposed to VOCs including benzene experience immediate health symptoms and illness. Within days after a flaring event at a
Texas City refinery, children exhibited altered blood pro-files, liver enzymes, and somatic symptoms [68]. Future re-search is needed to determine whether the concentrations of benzene we measured are due to continuous releases or flaring, fugitive emissions, or facility upsets.
Formaldehyde is another volatile compound that ex-ceeded health-based risk levels near compressor stations in Arkansas, Pennsylvania, and Wyoming. As with ben-zene, there are known sources of formaldehyde emis-sions along the production chain. Formaldehyde is a product of incomplete combustion emitted by natural gas-fired reciprocating engines at compressor stations [69]. Formaldehyde is also formed from methane in the presence of sunlight, which may be an important source given significant amounts of methane that are known to escape from UOG sites [70]. But air monitoring studies, particularly in shale gas regions, either do not measure for formaldehyde [12,14] or find it at lower concentra-tions. For example, the Barnett Shale Energy Education Council [71] found levels that did not pose a risk to hu-man health. Colborn et al. [10] found formaldehyde and acetaldehyde in each of 46 samples with a mean of 1.0 part per billion by volume. In contrast, our CBPR frame-work resulted in the targeting of compressor stations for passive sampling, where diesel emissions likely account for the higher levels that we found. Our results are simi-lar to the Fort Worth Natural Gas Air Quality Study, which found formaldehyde concentrations in areas with multiple large compressor engines [72]. We found high concentrations of formaldehyde near fourteen compres-sor stations in three states.
Figure 4Concentrations of volatile compounds exceeding health-based risk levels in samples collected in Pennsylvania.Dashed line represents EPA IRIS 1/10,000 cancer risk for formaldehyde. Dotted line represents EPA IRIS 1/100,000 cancer risk for benzene.
Maceyet al. Environmental Health2014,13:82 Page 11 of 18
ADEQ (2011) VOCs (total) NO NO2
PID (fixed) PID (handheld)
4 compressor stations 6 drilling sites 3 well sites (fracking)
1 upwind
1 d (4–6 hrs.)
VOCs“almost always below or near detection limits” VOCs at drilling sites elevated (ave. 38–678 ppb; max. 350–5,321 ppb)
NO/NO2rarely exceed detection limits
CDPHE (2012) NMOCs (78) Methane
Canister 1 well pad (Erie) 3 wks. Detects = 42 of 78 compounds in >75% of samples Benzene“well within EPA’s acceptable cancer risk range”
Acute and chronic HQs“well below”1
CDPHE (2009) NMOCs (78) VOCs PM2.5
Canister PID (handheld) Filter (handheld)
8 wells (4 drilling, 4 completion)
1 d Total NMOC ave. 273–8,761 ppb at 8 sites Total VOC ave. 6–3,023 ppb at 8 sites
PM2.5ave. 7.3 - 16.7μg/m 3
at 8 sites
CDPHE, GCPHD (2007) VOCs (43) PM10 Canister Filter 14 sites 7 sites
24 mos. Detects = 15 of 43 compounds Benzene ave. 28.2μg/m3, max 180μg/m3(grab) Toluene ave. 91.4μg/m3, max 540μg/m3(grab)
CDPHE (2003–2012)
NMOCs Carbonyls
Canister 5 sites (2003)
6 sites (2006) 3+ sites (2012)
2 mos. Methane ave. 2,535 ppb (Platteville) vs. (1,780 ppb Denver) Top NMOCs in Platteville = ethane, propane, butane
Benzene, toluene higher in Platteville
CDPHE (2002) VOCs (42) SO2 NO, NO2
Canister Continuous
2 well sites 1 residential 1 active flare 2 up-, down-valley
1 background
1 mo. Detects = 6 of 42 VOCs
Benzene in 6 of 20 (2.2-6.5μg/m3) Toluene in 18 of 20 (1.5-17μg/m3)
OEPA (2014) VOCs (69) VOCs PM10/PM2.5
H2S CO
Canister GC/MS
Filter
1 well site 1 remote site
12 mos. Ongoing; data update provided in February 2014 Detects include BTEX, alkanes (e.g., ethane, hexane), H2S
Second site planned near processing plant
PA DEP (2010) VOCs (48) Alkanes Leak detection Canister OP-FTIR GC/MS FLIR
2 compressor stations 1 condensate tank 1 wastewater impoundment
1 background
5 wks. Detects include methane, ethane, propane, benzene (max. 758 ppb) No conc.’s“that would likely trigger air-related health issues”
Fugitive gas stream emissions
PA DEP (2011) VOCs (48) Alkanes Leak detection Canister OP-FTIR GC/MS FLIR
2 compressor stations 1 completed well 1 well site (fracking) 1 well (tanks, separator)
1 background
4 wks. Detects include BTEX (benzene max. 400 ppb), methylbenzenes No conc.’s“that would likely trigger air-related health issues”
Fugitive emissions from condensate tanks, piping
PA DEP (2011) VOCs (48) Alkanes
Canister OP-FTIR GC/MS
2 compressor stations 1 well site (flaring) 1 well site (drilling) 1 background
4 wks. Detects include benzene (max. 400 ppb), toluene, ethylbenzene Natural gas constituent detects near compressor stations Conc.’s“do not indicate a potential for major air-related health issues”
PA DEP (2012) Criteria VOCs/HAPs
Methane H2S
“Full suite” 1 gas processing 2 large compressor stations
1 background
12 mos. Ongoing; report due in 2014
Table 6 Five-state survey of air quality monitoring studies, unconventional oil and gas operations(Continued)
WDEQ (2013) VOCs/NMHCs Ozone Methane NO, NO2 PM10/PM2.5
Canister UV Photometric
FID Chemiluminescence
Beta Attenuation
7 permanent stations (e.g., Boulder, Juel Spring, Moxa) 3 mesonet stations (Mesa, Paradise Warbonnet) 2 mobile trailer locations (Big Piney, Jonah Field)
Ongoing WDEQ mobile monitors placed at locations w/ oil & gas development Mini-SODAR also placed adjacent to Boulder permanent station
“Relatively low concentrations”of VOCs found in canister samples VOCs“consistently higher”at Paradise site (near oil & gas sources)
BTEX = benzene, toluene, ethylbenzene, and xylenes; FID = flame ionization detector; FLIR = forward looking infrared; GC/MS = gas chromatography/mass spectrometry; HAP = hazardous air pollutant; NAAQS = National Ambient Air Quality Standard; NMHC = non-methane hydrocarbon; NMOC = non-methane organic compound; OP-FTIR = open-path Fourier transform infrared; PID = photoionization detector; VOC = volatile organic compound.
Macey
et
al.
Environme
ntal
Health
2014,
13
:82
Page
13
of
18
http://ww
w.ehjourna
l.net/content
Formaldehyde is a suspected human carcinogen [73]. It can affect nearly every tissue in the human body, leading to acute (dermal allergies, asthma) and chronic (neuro-, reproductive, hematopoietic, genetic and pulmonary tox-icity and cellular damage) health effects [74]. The science of childhood exposure to formaldehyde is progressing rap-idly [75]. State agencies and international organizations continue to lower exposure limit values and guidelines for formaldehyde [76]. Our results exceed those guidelines. Symptoms reported by community members mirror the effects of acute formaldehyde exposure, which causes irri-tation of the eyes, nose, throat, and skin.
Other volatiles of concern included hexane and hydrogen sulfide. Hexane detects were most prevalent near oil and gas operations in Wyoming near well pads, compressor stations, separators, and produced water discharges. Other studies in oil and gas regions found hexane, but at low con-centrations [10,12]. The circumstances under which high concentrations of hexane were found in Wyoming suggest a combination of leaks, spills, and fugitive emissions as po-tential causes. Acute exposure to hexane affects the central nervous system, causing dizziness, nausea, and headache. Chronic effects include neurotoxicity [77].
We also found elevated levels of hydrogen sulfide in Wyoming along the chain of production (pump jacks, produced water discharge impoundments, discharge ca-nals) and near a well pad in Colorado. Hydrogen sulfide is a broad-spectrum toxicant that can impact most organ systems [78]. As such, it contributes to a range of short-and long-term neurological, upper respiratory, short-and blood-related symptoms, including those that were prevalent among community samplers in Wyoming (headaches, dizziness, eye irritation, fatigue) [79]. Hydrogen sulfide is a natural component of crude oil and natural gas [5] and is released during many industrial processes. In addition, five samples from Wyoming exceeded ATSDR health-based risk levels for toluene and xylenes.
Health-based risk levels provide only a limited sense of potential human health impacts from air emissions. They do not fully account for vulnerable subpopulations, and toxicity values are available for a comparatively small number of compounds. The levels that we found for the above chemicals of concern suggest that state monitoring studies are incomplete. Recent state-funded projects found air volatiles at UOG sites that were either near detection limits or within acceptable limits to pro-tect the public [80-82]. One area of agreement between our community-based and state monitoring studies con-cerns the presence of complex chemical mixtures. These mixtures demonstrate the contingent nature of ambient air quality near UOG infrastructure.
For example, one sample, taken midday in early winter near a well pad in Wyoming with clicking pneumatic pumps, found high concentrations of hydrogen sulfide,
hexane, benzene, and xylenes. It also captured cyclohexane, heptane, octane, ethylbenzene, nonane, 1,2,4-trimethyl-benzene, and 15 tentatively identified compounds (TICs). TICs are compounds that a device or analytic process is not designed to measure. Total VOC concentrations in the sample exceeded 1.6 million μg/m3, excluding me-thane. While toxicity values are not available for every TIC in our samples, they exceeded reference concentra-tions available for related compounds such as hexane [77]. Another sample taken in Arkansas, during autumn in the afternoon near a compressor station, captured 17 volatile compounds and five TICs. A third sample, near a separ-ator shed in Wyoming in late autumn at midday, showed spikes in hydrogen sulfide, benzene, and hexane, 19 ad-ditional VOCs, and 15 TICs, with total VOC concentra-tions exceeding 25 million μg/m3, excluding methane. These and other complex mixtures are provided in Additional file 1.
The mixtures that we identified are related to sources commonly used in well pad preparation, drilling, well completion, and production, such as produced water tanks, glycol dehydrators, phase separators, compressors, pipelines, and diesel trucks [14]. They can be released during normal operating conditions and persist near ground level, especially in regions where topography encourages air inversions [83]. The toxicity of some con-stituents is well known, while others have little or no toxicity information available. Our findings of chemical mixtures are of clinical significance, even absent spikes in chemicals of concern. The chemical mixtures that we identified should be further investigated for their pri-mary emissions sources as well as their potential cumu-lative and synergistic effects [84]. Clinical and subclinical effects of hydrocarbons such as benzene are increasingly found at low doses [85]. Chronic and subchronic ex-posure to chemical mixtures is of particular concern to vulnerable subpopulations, including children, pregnant women, and senior citizens [86].
The continuous monitors wirelessly transmitted data at five-second intervals over a four- to six-hour period (see Table 6). In addition, Arkansas Department of Environ-mental Quality (ADEQ) personnel carried handheld versions of the AreaRAE along the perimeter of the sites every one or two hours. While the study did not identify individual VOCs, it found that total VOC emissions at the edge of a well pad fluctuate wildly over a five-hour period. The agency concluded,“The spatial and temporal distribution of VOC concentrations at most drilling sites was significantly affected by monitor location, wind, and the interaction between location and wind direction” [81]. Other studies noted similar variation, although the extent to which short-term spikes and unique chemical mixtures might pose a risk to human health was not considered.
Community-based research can improve the spatial and temporal resolution of air quality data [87] while ad-hering to established methods. Our findings can inform and calibrate state monitoring and research programs. Additional file 1: Table S6 gives a more in-depth over-view of community monitoring in action, including sample site selection factors, sources of public health concern at each site, and the range of infrastructure present and life cycle stage when samples were taken. For example, grab samples in Wyoming with some of the highest VOC concentrations were collected during production, as opposed to well completion (see Table S6, Additional file 1). The timing and location of our sam-ples were driven by two primary factors: local knowledge gleaned from daily routines, and a history of chronic or subchronic symptoms reported by nearby residents. For example, a separator shed was targeted because of sub-chronic symptoms (dizziness, nausea, tight chest, nose and throat problems, metallic taste, and sweet smell) and loud sounds nearby (“hissing, clicking, and whooshing”). Well pads were selected based on impacts to livestock, pasture degradation from produced water, and observa-tions of residents and farmers. Other samples were driven by observations of fugitive emissions, including vapor clouds, deposition, discoloration, and sounds (see Table S6 in Additional file 1).
Community-based research can identify mixtures, and their potential emissions sources, to prioritize for study of their additive, cumulative, and synergistic effects [88]. The mixtures can be used to determine source signa-tures [14] and isolate well pads for more intensive moni-toring. Symptom-driven samples can define the proper length of a sampling period, which is often limited to days or weeks. They can inform equipment placement for continuous monitoring and facilitate a transition from exploratory to more purposive sampling. Testing informed by human health impacts, and more precise knowledge of the mix and spacing of sources that may
contribute to them, contrasts with state efforts, which are limited by access to property, sources of electrical power, fixed monitoring sites, and the cooperation of well pad owners and operators. In these ways, community-based monitoring can extend the reach of limited public resources.
Conclusions
Community-based monitoring near unconventional oil and gas operations demonstrates elevations in concen-trations of hazardous air pollutants under a range of circumstances. Of special concern are high concentra-tions of benzene, hydrogen sulfide, and formaldehyde, as well as chemical mixtures linked to operations with observed impacts to resident quality of life.
Additional file
Additional file 1:Contains six tables, including complete results from grab and passive sampling (Tables S1 through S5) and data on sample location selection in Wyoming (Table S6).
Abbreviations
ADEQ:Arkansas Department of Environmental Quality; ATSDR: Agency for Toxic Substances and Disease Registry; BTEX: benzene, toluene,
ethylbenzene, and xylenes; CBPR: community-based participatory research; CDPHE: Colorado Department of Public Health and Environment; EMPACT: Environmental Monitoring for Public Access and Community Tracking; EPA: Environmental Protection Agency; FID: flame ionization detector; FLIR: forward looking infrared; GCM: Global Community Monitor; GC/MS: gas chromatography/mass spectrometry; GCPHD: Garfield County Public Health Department; HAP: hazardous air pollutant; IRIS: Integrated Risk Information System; MRL: minimal risk level; NAAQS: National Ambient Air Quality Standard; NIOSH: National Institute for Occupational Safety and Health; NMHC: non-methane hydrocarbon; NMOC: non-methane organic compound; OEPA: Ohio Environmental Protection Agency; OP-FTIR: open path Fourier transform infrared; PA DEP: Pennsylvania Department of Environmental Protection; PAH: polycyclic aromatic hydrocarbon; PID: photoionization detector; QA/QC: Quality Assurance/Quality Control; TIC: tentatively identified compound; UOG: unconventional oil and gas; VOC: volatile organic compound; WDEQ: Wyoming Department of Environmental Quality.
Competing interests
The authors declare they have no competing financial interest. Ruth Breech, Mark Chernaik, Caroline Cox, Denny Larson, and Deb Thomas are employed by non-profit organizations whose mission is to reduce exposure to toxic chemicals.
Authors’contributions
GPM provided study design and project management, a survey of state-sponsored air quality monitoring studies, data analysis, and initial drafts of the Background, Methods, Discussion, and Tables 1 and 6, and Additional file 1: Tables S1 through S6. RB managed air quality monitoring teams and provided an initial draft of the Methods. MC provided data analysis and interpretation of grab and passive samples. CC provided data analysis and interpretation of grab and passive samples and initial drafts of the Results, Tables 2, 3, 4, 5 and Figures 2, 3 and 4. DL developed the protocol for community-based air sampling and provided an initial draft of the Methods. DT managed air quality monitoring teams in Wyoming and provided an initial draft of Additional file 1: Table S6. DOC provided study design and guidance, data analysis, and initial drafts of the Background and Discussion. All authors participated in the study design, data analysis and interpretation, and drafting of the manuscript. All authors read and approved the final manuscript.
Maceyet al. Environmental Health2014,13:82 Page 15 of 18
Acknowledgements
Support provided by the V. Kann Rasmussen Foundation, the Center for Health, Science, and Public Policy, and the Institute for Health and the Environment. We thank Tom Bengera, Rod Brueske, Dirk DeTurck, Paul Feezel, Catherine Fenton, John Fenton, Frank Finan, Jessica Hendricks, Christine Hughes, Caitlin Kennedy, April Lane, Emily Lane, Evelyn Meisenbacher, Doug McMullin, Genie McMullin, Ansje Miller, Teresa Mills, Angie Nordstrum, Jen Palazzolo, Sharyle Patton, Sharon Proudfoot, Molly Rauch, Rebecca Roter, Andrea Roy, Deborah Sonderman, Steve Taylor, Ellen Webb, and John Williams, and the following organizations for their contributions to this article: Appalachia Resist, ArkansasFracking.org, Athens County Fracking Action Network, Breathe Easy Susquehanna County, Buckeye Forest Council, Carroll County Concerned Citizens, Center for Environmental Health, Center for Health, Environment & Justice, Coming Clean Inc., Commonweal, Erie Rising, Frack Free Mahoning Valley, Global Community Monitor, Moms Clean Air Force, and Powder River Basin Resource Council. We sincerely thank three reviewers for their detailed comments and suggestions.
Author details
1Center for Health, Science, and Public Policy, Brooklyn Law School, Brooklyn,
New York, USA.2Global Community Monitor, Richmond, California, USA. 3Environmental Law Alliance Worldwide, Eugene, Oregon, USA.4Center for
Environmental Health, Oakland, California, USA.5Powder River Basin Resource Council, Clark, Wyoming, USA.6Institute for Health and the Environment, University at Albany, Rensselaer, New York, USA.
Received: 16 July 2014 Accepted: 10 October 2014 Published: 30 October 2014
References
1. USEIA:Annual Energy Outlook 2013.Washington, DC: United States Energy Information Administration; 2013 [http://www.eia.gov/forecasts/aeo/pdf/ 0383 (2013).pdf]
2. USEIA:Annual Energy Outlook 2012.Washington, DC: United States Energy Information Administration; 2012 [http://www.eia.gov/forecasts/aeo/pdf/ 0383 (2012).pdf]
3. USEIA:Glossary of Terms.Washington, DC: United States Energy Information Administration; 2014 [http://www.eia.gov/tools/glossary/]
4. Finkel ML, Law A:The rush to drill for natural gas: a public health cautionary tale.Am J Public Health2011,101:784–785.
5. Colborn T, Kwiatkowski C, Schultz K, Bachran M:Natural gas operations from a public health perspective.Hum Ecol Risk Assess Int J2011,17:1039–1056. 6. Witter RZ, McKenzie L, Stinson KE, Scott K, Newman LS, Adgate J:The use
of health impact assessment for a community undergoing natural gas development.Am J Public Health2013,103:1002–1010.
7. Adgate JL, Goldstein BD, McKenzie LM:Potential public health hazards, exposures and health effects from unconventional natural gas development.Environ Sci Technol. in press.
8. Jackson RB, Vengosh V, Darrah TH, Warner NR, Down A, Poreda RJ, Osborn SG, Zhao K, Karr JD:Increased stray gas abundance in a subset of drinking water wells near Marcellus shale gas extraction.Proc Nat Acad Sci2013,110:11250–11255.
9. Brown VJ:Radionuclides in fracking wastewater: managing a toxic blend.
Environ Health Perspect2014,122:A50–A55.
10. Colborn T, Schultz K, Herrick L, Kwiatkowski C:An exploratory study of air quality near natural gas operations.Hum Ecol Risk Assess Int J2013,20:86–105. 11. McKenzie LM, Witter RZ, Newman LS, Adgate JL:Human health risk
assessment of air emissions from development of unconventional natural gas resources.Sci Total Environ2012,424:79–87.
12. Shonkoff SB, Hays J, Finkel ML:Environmental public health dimensions of shale and tight gas development.Environ Health Perspect. in press. 13. Skone TJ, Littlefield J, Marriott J:Life Cycle Greenhouse Gas Inventory of
Natural Gas Extraction, Delivery and Electricity Production.Pittsburgh, PA: United States Department of Energy, National Energy Technology Laboratory; 2011.
14. Gilman JB, Lerner BM, Kuster WC, Gouw JA:Source signature of volatile organic compounds from oil and natural gas operations in northeastern Colorado.Environ Sci Technol2013,47:1297–1305.
15. Field RA, Soltis J, Murphy S:Air quality concerns of unconventional oil and natural gas production.Environ Sci Process Impacts2014,16:954–969.
16. Moore CW, Zielinska B, Petron G, Jackson RB:Air impacts of increased natural gas acquisition, processing, and use: a critical review.Environ Sci Technol. in press.
17. Jiang M, Griffin WM, Hendrickson C, Jaramillo P, VanBriesen J, Venkatesh A: Life cycle greenhouse gas emissions of Marcellus shale gas.Environ Res Lett2011,6:034014.
18. Allen DT, Torres VM, Thomas J, Sullivan DW, Harrison M, Hendler A, Herndon SC, Kolb CE, Fraser MP, Hill AD, Lamb BK, Miskimins J, Sawyer RF, Seinfeld JH:Measurements of methane emissions at natural gas production sites in the United States.Proc Nat Acad Sci2013,110:17768–17773. 19. Schnell RC, Oltmans SJ, Neely RR, Endres MS, Molenar JV, White AB:Rapid
photochemical production of ozone at high concentrations in a rural site during winter.Nat Geosci2009,2:120–122.
20. Witter R, McKenzie L, Towle M, Stonson K, Scott K, Newman L, Adgate J:
Health Impact Assessment for Battlement Mesa, Garfield County Colorado.
Aurora, CO: Colorado School of Public Health; 2010.
21. Bunch AG, Perry CS, Abraham L, Wikoff DS, Tachovsky JA, Hixon JG, Urban JD, Harris MA, Haws LC:Evaluation of impact of shale gas operations in the Barnett Shale region on volatile organic compounds in air and potential human health risks.Sci Total Environ2013,468:832–842. 22. Morris J, Song L, Hasemyer D:Big Oil, Bad Air: Fracking the Eagle Ford Shale
of South Texas.Washington, DC: Center for Public Integrity; 2014. 23. Goldstein BD, Brooks BW, Cohen SD, Gates AE, Honeycutt ME, Morris JB,
Orme-Zavaleta J, Snawder J:The role of toxicological science in meeting the challenges and opportunities of hydraulic fracturing.Toxicol Sci2014,139:271–283. 24. McKenzie LM, Guo R, Witter RZ, Savitz DA, Newman LS, Adgate JL:Birth
outcomes and maternal residential proximity to natural gas development in rural Colorado.Environ Health Perspect. in press. 25. Brown D, Weinberger B, Lewis C, Bonaparte H:Understanding exposure
from natural gas drilling puts current air standards to the test.Rev Environ Health. in press.
26. Fuller CH, Brugge D, Williams PL, Mittleman MA, Lane K, Durant JL, Spengler JD: Indoor and outdoor measurements of particle number concentration in near-highway homes.J Expo Sci Environ Epidemiol2013,23:506–512. 27. Rogers H:Shale gas-the unfolding story.Oxford Rev Econ Pol’y2011,27:117–143. 28. Steinzor N, Subra W, Sumi L:Investigating links between shale gas
development and health impacts through a community survey project in Pennsylvania.New Solutions2013,23:55–83.
29. Eapi GR, Sabnis MS, Sattler ML:Mobile measurement of methane and hydrogen sulfide at natural gas production site fence lines in the Texas Barnett Shale.J Air Waste Manag Assoc. in press.
30. Kargbo DM, Wilhelm RG, Campbell DJ:Natural gas plays in the Marcellus Shale: challenges and potential opportunities.Environ Sci Technol2010, 44:5679–5684.
31. Beusse R, Dunlap C, Good K, Hauck E, McGhee-Lenart R, Narimatsu J:EPA Needs to Improve Air Emissions Data for the Oil and Natural Gas Production Sector.Washington, DC: Office of the Inspector General of the United States, Environmental Protection Agency, Report 13-P-0161; 2013.
32. Rappenglueck B, Ackermann L, Alvarez S, Golovko J, Buhr M, Field R, Slotis J, Montague DC, Hauze B, Adamson S, Risch D, Wilkerson G, Bush D, Stoeckenius R, Keslar C:Strong wintertime ozone events in the Upper Green River Basin, Wyoming.Atmos Chem Phys2014,14:4909–4934. 33. Oltmans S, Schnell RC, Johnson B, Petron G, Mefford T, Nelly RN:Anatomy
of wintertime ozone associated with oil and natural gas extraction activity in Wyoming and Utah.Elementa2014. in press.
34. Swarthout RF, Russo RS, Zhou Y, Hart AH, Sive BC:Volatile organic compound distributions during the NACHTT campaign at the Boulder Atmospheric Observatory: influence of urban and natural gas sources.
J Geophys Res-Atmos2013,118:10614–10637.
35. Petron G, Frost G, Miller BR, Hirsch AI, Montzka SA, Karion A, Trainer M, Sweeney C, Andrews AE, Miller L, Kofler J, Bar-Ilan A, Dlugokencky EJ, Patrick L, Moore CT Jr, Ryerson TB, Siso C, Kolodzey W, Lang PM, Conway T, Novelli P, Masarie K, Hall B, Guenther D, Kitzis D, Miller J, Wlesh D, Wolfe D, Neff W, Tans P:Hydrocarbon emissions characterization in the Colorado Front Range: a pilot study.J Geophys Res-Atmos2012,117:1–19.
36. Helmig D, Thompson CR, Evans J, Boylan P, Hueber J, Park JH:Highly elevated atmospheric levels of volatile organic compounds in the Uintah Basin, Utah.Environ Sci Technol. in press.
38. Karion A, Sweeney C, Petron G, Frost G, Hardesty R, Kofler J, Miller BR, Newberger T, Wolter S, Banta R, Brewer A, Dlugokencky E, Lang P, Montzka SA, Schnell R, Tans P, Trainer M, Zamora R, Conley S:Methane emissions estimate from airborne measurements over a western United States natural gas field.Geophys Res Lett2013,40:4393–4397.
39. Litovitz A, Curtright A, Abramzon S, Burger N, Samaras C:Estimation of regional air-quality damages from Marcellus Shale natural gas extraction in Pennsylvania.Environ Res Lett2013,8:014017.
40. Zielinska B, Fujita E, Campbell D:Monitoring of Emissions from Barnett Shale Natural Gas Production Facilities for Population Exposure Assessment.Reno, NV: Desert Research Institute; 2010.
41. Levi MA:Comment on“Hydrocarbon emissions characterization in the Colorado Front Range: a pilot study”by Gabrielle Petron et al.J Geophys Res Atmos2012,117:D21203.
42. Shepard PM, Northridge ME, Parkesh S, Stover G:Advancing environmental justice through community-based participatory research.Environ Health Perspect2002,110:139.
43. Minkler M:Linking science and policy through community-based participatory research to study and address health disparities.Am J Public Health2010, 100:81–87.
44. Keeler GJ, Dvonch T, Yip FY, Parker EA, Israel BA, Marsik FJ, Morishita M, Barres JA, Robins TG, Brakefield-Caldwell W, Sam M:Assessment of personal and community-level exposures to particulate matter among children with asthma in Detroit, Michigan.Environ Health Perspect2002,110:173–181. 45. Hobson J, Fishman S:Quality Assurance Program Plan for the“Bucket Brigade”
Community Air Sampling Pilot Project, Approved by EPA Region IX and Contra Costa County Health Services; 1998.
46. Plate MC:Region 9 Summary of Quality Assurance Planning for the“Bucket Brigade” Community Air Sampling Project, Contra Costa County, California.San Francisco, CA: United States Environmental Protection Agency Region Nine; 2001. 47. Hobson J, Fishman S:In Kind Donation of Analysis to the Contra Costa Bucket
Brigade.San Francisco, CA: Letter from Project Coordinator, Contra Costa County Health Services to Brenda Bettencourt, Lab Director, EPA Region IX Laboratory; 1998.
48. O’Rourke D, Macey GP:Community environmental policing: assessing new strategies for public participation in environmental regulation.
J Pol'y Analysis Manag2003,22:383–414.
49. Larson D, Breech R, Hendricks J, Chernaik M, Mall A, Smith F:Gassed: Citizen Investigation of Toxic Air Pollution from Natural Gas Development.El Cerrito, CA: Global Community Monitor; 2011.
50. NDEP:Summa Canister Sampling.Carson City, NV: State of Nevada Division of Environmental Protection; 2011 [http://www.ndep.nv.gov/fallon/summa/pdf] 51. USEPA:Laboratory Case Narrative, Case Number R98X02.Richmond, CA:
United States Environmental Protection Agency Region IX; Nov. 1998. 52. USEPA:Laboratory Case Narrative, Case Number R99X02.Richmond, CA:
United States Environmental Protection Agency Region IX; Jan. 1999. 53. USEPA:Laboratory Case Narrative, Case Number R99X02.Richmond, CA:
United States Environmental Protection Agency Region IX; May 1999. 54. USEPA:Laboratory Case Narrative, Case Number R99X02.Richmond, CA:
United States Environmental Protection Agency Region IX; Jun. 1999. 55. Darrow LA, Klein M, Sarnat JA, Mulholland JA, Strickland MJ, Sarnat SE,
Russell AG, Tolbert PE:The use of alternative pollutant metrics in time-series studies of ambient air pollution and respiratory emergency department visits.J Exp Sci Environ Epi2011,21:10–19.
56. Delfino R, Zeiger RS, Seltzer JM, Street DH, McLaren CE:Association of asthma symptoms with peak particulate air pollution and effect modification by anti-inflammatory medication use.Environ Health Perspect
2002,110:A607–A617.
57. Mills NL, Tornqvist H, Gonzalez MC, Vink E, Robinson SD, Soderberg S, Boon NA, Donaldson K, Sandstrom T, Blomberg A, Newby DE:Ischemic and thrombotic effects of dilute diesel-exhaust inhalation in men with coronary heart disease.N Engl J Med2007,357:1075–1082.
58. USATSDR:Toxicological Profile for Hydrogen Sulfide.Atlanta, GA: United States Agency for Toxic Substances and Disease Registry Division of Toxicology and Environmental Medicine/Applied Toxicology Branch; 2006. 59. USATSDR:Toxicological Profile for Formaldehyde.Atlanta, GA: United States
Agency for Toxic Substances and Disease Registry Division of Toxicology and Environmental Medicine/Applied Toxicology Branch; 1999.
60. USATSDR:Toxicological Profile for Benzene.Atlanta, GA: United States Agency for Toxic Substances and Disease Registry Division of Toxicology and Environmental Medicine/Applied Toxicology Branch; 2007.
61. Testa BM:Home on the shales.Mech Eng2013,135:30–35.
62. USEPA:Oil and natural gas sector: new source performance standards and national emission standards for hazardous air pollutants reviews.
Fed Reg2014,77:49490–49600. Washington, DC: United States Environmental Protection Agency.
63. Vlaanderen J, Lan Q, Kromhout H, Rothman N, Vermeulen R:Occupational benzene exposure and the risk of lymphoma subtypes: a meta-analysis of cohort studies incorporating three study quality dimensions.Environ Health Perspect2011,119:159–167.
64. Smith MT:Advances in understanding benzene health effects and susceptibility.Ann Rev Public Health2010,31:133–148.
65. Lupo PJ, Symanski E, Waller DK, Chan W, Langlois PH, Canfield MA, Mitchell LE: Maternal exposure to ambient levels of benzene and neural tube defects among offspring: Texas, 1999–2004.Environ Health Perspect2011,119:397–402. 66. Gross SA, Avens HJ, Banducci AM, Sahmel J, Panko JM, Tvermoes BE:
Analysis of BTEX groundwater concentrations from surface spills associated with hydraulic fracturing operations.J Air Waste Manag Assoc
2013,63:424–432.
67. Wolf Eagle Environmental:Town of Dish, Texas Ambient Air Monitoring Analysis Final Report.Flower Mound, TX: Wolf Eagle Environmental; 2009 [http://townofdish.com/objects/DISH_-_final_report_revised.pdf]. 68. D’Andrea MA, FACRO, Reddy GK:Health effects of benzene exposure
among children following a flaring incident at the British Petroleum refinery in Texas City.Pediatr Hematol Oncol2014,31:1–10.
69. USEPA:Natural Gas-Fired Reciprocating Engines, Volume AP-42 Section 3.2. Washington, DC: United States Environmental Protection Agency; 2000. [http://www.epa.gov/ttn/chief/ap42/ch03/final/c03s02.pdf]
70. Ingraffea AR, Wells MT, Santoro RL, Shonkoff SBC:Assessment and risk analysis of casing and cement impairment in oil and gas wells in Pennsylvania, 2000–2012.Proc Nat Acad Sci. in press.
71. Barnett Shale Energy Education Council:Air Quality and the Barnett Shale.
Fort Worth, TX; 2011 [http://www.bseec.org/content/air-quality-and-barnett-shale]
72. Eastern Research Group:City of Fort Worth Natural Gas Air Quality Study.
Morrisville, NC; 2011 [http://fortworthtexas.gov/uploadedFiles/Gas_Wells/ AirQualityStudy_final.pdf]
73. USATSDR:Report on Carcinogens, Twelfth Edition.Research Triangle Park, NC: United States Agency for Toxic Substances and Disease Registry, National Toxicology Program; 2011.
74. Kim K, Jahan SA, Lee J:Exposure to formaldehyde and its potential human health hazards.J Environ Sci Health Part C Environ Carcinog Ecotoxicol Rev2011,29:277–299.
75. McGwin G, Lienert J, Kennedy JI:Formaldehyde exposure and asthma in children: a systematic review.Environ Health Perspect2010,118(3):313–317. 76. Wolkoff P, Nielsen GD:Organic compounds in indoor air—their relevance
for perceived indoor air quality.Atmos Environ2001,35:4407–4417. 77. USEPA:Integrated Risk Information System, n-Hexane.Washington, DC:
United States Environmental Protection Agency; 2005.
78. Legator MS, Morris DL, Philips DL, Singleton CR:Health effects from chronic low-level exposure to hydrogen sulfide.Arch Environ Health2001, 56:123–131.
79. USATSDR:Addendum to the Toxicological Profile for Hydrogen Sulfide.Atlanta, GA: United States Agency for Toxic Substances and Disease Registry, Division of Toxicology and Environmental Medicine/Applied Toxicology Branch; 2012. 80. CDPHE:Air Emissions Case Study Related to Oil and Gas Development in Erie.
Denver, CO: Colorado Department of Public Health and Environment; 2012. 81. ADEQ:Emissions Inventory and Ambient Air Monitoring of Natural Gas
Production in the Fayetteville Shale Region.North Little Rock, AR: Arkansas Department of Environmental Quality; 2011.
82. PADEP:Southwestern Pennsylvania Marcellus Shale Short-Term Ambient Air Sampling.Harrisburg, PA: Pennsylvania Department of Environmental Protection, Bureau of Air Quality; 2010.
83. Sexton K, Westberg H:Nonmethane hydrocarbon composition of urban and rural atmospheres.Atmos Environ1984,18:1125–1132.
84. Carpenter DO, Arcaro K, Spink DC:Understanding the human health effects of chemical mixtures.Environ Health Perspect2002,110:25–42. 85. Lan Q, Zhang L, Li G, Vermeulen R, Weinberg RS, Dosemeci M, Rappaport
SM, Shen M, Alter BP, Wu Y, Kopp W, Waidyanatha S, Rabkin C, Guo W, Chanock S, Hayes RB, Linet M, Kim S, Yin S, Rotham N, Smith MT: Hematotoxicity in workers exposed to low levels of benzene.Sci2004, 306:1774–1776.
Maceyet al. Environmental Health2014,13:82 Page 17 of 18