S O F T W A R E
Open Access
SV-STAT accurately detects structural
variation via alignment to reference-based
assemblies
Caleb F. Davis
1,2,3,4*, Deborah I. Ritter
2,4, David A. Wheeler
1,3,4, Hongmei Wang
2, Yan Ding
4, Shannon P. Dugan
4,
Matthew N. Bainbridge
1,4, Donna M. Muzny
4, Pulivarthi H. Rao
2, Tsz-Kwong Man
1,2,3, Sharon E. Plon
2,3,4,
Richard A. Gibbs
1,3,4and Ching C. Lau
1,2,3Abstract
Background:Genomic deletions, inversions, and other rearrangements known collectively as structural variations (SVs) are implicated in many human disorders. Technologies for sequencing DNA provide a potentially rich source of information in which to detect breakpoints of structural variations at base-pair resolution. However, accurate prediction of SVs remains challenging, and existing informatics tools predict rearrangements with significant rates of false positives or negatives.
Results:To address this challenge, we developed‘Structural Variation detection by STAck and Tail’(SV-STAT) which implements a novel scoring metric. The software uses this statistic to quantify evidence for structural variation in genomic regions suspected of harboring rearrangements. To demonstrate SV-STAT, we used targeted and genome-wide approaches. First, we applied a custom capture array followed by Roche/454 and SV-STAT to three pediatric B-lineage acute lymphoblastic leukemias, identifying five structural variations joining known and novel breakpoint regions. Next, we detected SVs genome-wide in paired-end Illumina data collected from additional tumor samples. SV-STAT showed predictive accuracy as high as or higher than leading alternatives. The software is freely available under the terms of the GNU General Public License version 3 at https://gitorious.org/svstat/svstat.
Conclusions:SV-STAT works across multiple sequencing chemistries, paired and single-end technologies, targeted or whole-genome strategies, and it complements existing SV-detection software. The method is a significant advance towards accurate detection and genotyping of genomic rearrangements from DNA sequencing data.
Keywords:Algorithm, Genome, Sequencing, Structural variation, Genotype, Translocation, Cancer
Background
Structural variants (SVs) such as deletions, duplica-tions, inversions, and translocations are implicated in a wide range of human diseases and are used as diagnos-tic and prognosdiagnos-tic markers in lymphomas, leukemias, and sarcomas. For example, detection of interchromo-somal translocations routinely guides the choice of
treatment in pediatric patients with B-lineage acute lymphoblastic leukemia (B-ALL). Traditionally, these translocations [t(4;11), t(12;21), t(1;19), and t(9;22)] are detected with low-resolution methods such as fluores-cencein situ hybridization, leaving them uncharacterized at the base-pair level, and limiting our understanding of their biological impact. Targeted deep-sequencing tech-nologies provide a potentially rich source of informa-tion with which to detect breakpoints of clinically relevant genomic rearrangements [1–4], but accurate prediction of SVs with existing informatics tools re-mains challenging [5–7].
* Correspondence:[email protected]
1
Structural and Computational Biology and Molecular Biophysics (SCBMB) Program, Baylor College of Medicine, Houston, TX 77030, USA
2Texas Children’s Cancer Center, Baylor College of Medicine, Houston, TX
77030, USA
Full list of author information is available at the end of the article
The most widely available deep-sequencing instru-ments provide the sequences of nucleotides (reads) along both (paired) ends of size-selected fragments of sheared DNA. Some leading algorithms (e.g. BreakDancer) use prior knowledge of this size distribution plus the mapped locations and orientations of the read pairs in the reference genome to detect SVs. This is called the“ paired-end”method (PE). Other leading algorithms (e.g. CREST) discard paired information. Given an unpaired read, these algorithms typically search for non-overlapping sub-sequences mapping uniquely to different locations (breakpoint regions) in the reference genome [8–11]. This approach is commonly known as the “split-read” method (SR). Given the limited accuracies of PE and SR and the computational challenges ofde novo assem-bly (DN), we explored methods for quantifying support for nucleotide-resolved breakpoints of SVs without PE, SR, or DN and applied our approach to recover SVs from target-enriched deep-sequencing data. Next, we appended our approach to PE for analysis of whole-genome sequencing data.
Implementation
Generate library of candidate SVs
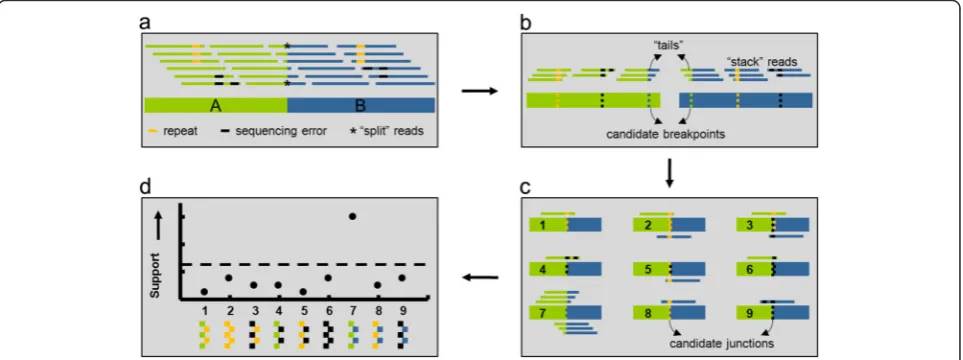
Figure 1 illustrates how in addition to split reads (*), other chimeric reads that map to only one genomic location can provide corroborative evidence for a SV connecting the breakpoint regions A (green) and B (blue) in the test sam-ple (box 1a). In the first step of our approach, all reads are aligned to the reference genome. Reads with repetitive
sequence (orange), DNA sequencing errors (black), or support for SVs (green & blue) align partially to the reference genome. Recurrent alignment stop or start coordinates indicate candidate breakpoints (box 1b). Bases aligned to the reference comprise the “stacks” while the remaining unaligned (soft-clipped) bases make up the“tails.”Next, candidate breakpoint regions are paired with each other to form a sequence “library” of candidate junctions (box 1c).
Measure support for each candidate SV
Stack reads are then aligned to the library of candidate SVs, and evidence for each candidate junction (C) is cal-culated based on 1) the number of bases in the tails aligned to the partner region, and 2) the quality scores of the alignments. Specifically, the support (S) for each
C is the summation of the product of these two values in all the stacked reads aligned toCaccording to the fol-lowing equation:
S¼X
n
i¼1
QiminflA;i;lB;ig
where Qi is the quality score and min{lA,i,lB,i} is the
lesser of the number of bases aligned to the i-th read (i = 1,2,…,n) in A or B.
Based on this strategy, we developed a software tool for Structural Variation detection by STAck and Tail (SV-STAT). The tool predicts the presence of structural variations in test samples relative to a reference gen-ome. SV-STAT quantifies the amount of evidence for
Fig. 1Use of chimeric and split reads to detect structural variation. Structural variation in the sample is depicted in box 1aas a fusion between
junctions of SVs at base-pair resolution and predicts SVs scoring above a user-defined threshold of support (box 1d).
Results and Discussion
Evaluation on targeted deep-sequencing data
We applied SV-STAT to Roche/454 sequencing data acquired from a custom hybridization array spanning 8 genomic regions recurrently rearranged in B-ALL (total of 1.3 Mb; see Additional file 1 for details). This array was applied to diagnostic samples of three patients with B-ALL (4, 65C, and 96C). Given only the sequence aligned to the reference genome, and the canonical orders and orientations of the breakpoint regions in the transloca-tions (in Additional file 1: Figure S1), SV-STAT identified base-pair resolved breakpoints of reciprocal t(1;19) and t(4;11) translocations in samples 65C and 4, respectively. This result agreed with the cytogenetic analysis; however, no translocation was identified by SV-STAT in sample 96C, which was diagnosed with t(4;11)(q21;q23). We adjusted the input to SV-STAT to consider candidate inversions within the q arm of chromosome 11, which revealed a 1 Mb inversion connecting lysine-specific methyltransferase 2A (MLL) and ubiquitin specific peptidase 2 (USP2), a novel fusion partner for MLL. Overall, our analysis showed a total of five SVs, all of which were confirmed by amplification of genomic DNA across the junctions with polymerase chain reac-tion (PCR; in Addireac-tional file 1: Figure S9).
To compare SV-STAT against the leading algorithms for mapping assembly of SVs, we first tried to detect SVs in the same dataset with CREST, which uses local de novo
assembly of reads from candidate breakpoint regions followed by split-read mapping to match partnering break-points [10]. CREST identified four of the five SVs identi-fied by SV-STAT, and no additional SVs. Derivative chromosome 11 from the t(4;11) reciprocal translocation in sample 4 was not detected by CREST. R453Plus1Tool-box, a split-read mapping assembler trained to detect balanced translocations in target-enriched unpaired 454 deep-sequencing data [11], identified the same set of SVs as SV-STAT.
We used simulated target-enriched deep-sequencing data to evaluate further the predictive accuracies of each algorithm. These data were generated (see Supplemental methods in Additional file 1) based on translocations pre-viously detected in B-ALL cases by conventional methods (e.g. Sanger sequencing). First, we divided the simulated data into a training set (4 samples; 7 translocations) and a test set (23 samples; 31 translocations). We used the train-ing set to define the threshold, above which SV-STAT would predict SVs. This threshold (2.985045) was the average between the support scores of the lowest-scoring true positive (3.02119) and the false positive immediately
below it (2.9489) (in Additional file 1: Table S3). We also trained SV-STAT to collapse similar predictions into a single SV (see “SV-STAT post-processing” in Additional file 1). Given the same training data, input parameters for CREST were also chosen for highest predictive accuracy. R453Plus1Toolbox did not accept any optional parameters.
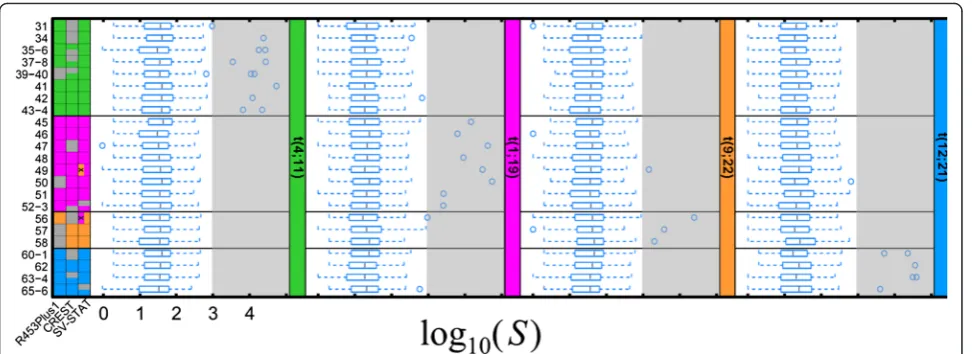
Next, we used the algorithms to predict which of the four possible types of translocations (t(1;19), t(4;11), t(9;22), or t(12;21)) was present in 23 additional test samples. None of the algorithms produced a false posi-tive. SV-STAT successfully predicted the translocation type correctly for all 23 samples, which was significantly more accurate than the predictions of both R453Plus1-Toolbox (19/23 (83 %); p< 0.05), and CREST (18/23 (78 %);p< 0.005).
At the level of the individual translocations, there were 31 translocated and 153 normal chromosomes (23 sam-ples and 8 chromosomes per sample). SV-STAT achieved a sensitivity and positive predictive value (PPV) of 29/31 (93.5 %; Fig. 2). If the user chooses a threshold of 100 % PPV in SV-STAT, sensitivity would be 90.3 %. Transloca-tions 52 and 65 in samples 52-3 and 65-6 were not pre-dicted by SV-STAT because the corresponding junction-spanning reads aligned to candidate junctions with only one correct breakpoint region. However, both of these translocations occurred in samples with two reciprocal rearrangements, and in each case SV-STAT correctly predicted the second SV. Moreover, using BLAST instead of BWA to align stacked reads to libraries in samples 52-3 and 65-6 produced the correct alignments for translocations 52 and 65. Predictions of incorrect translocation types in samples 49 and 56 were accom-panied with higher-scoring predictions of correct types of translocations (in Additional file 1: Table S4). In comparison, CREST’s sensitivity and specificity were 20/31 (64.5 %) and 20/20 (100 %), respectively, while R453Plus1Toolbox also achieved 100 % PPV with a sensitivity of 26/31 (83.9 %).
Application to Illumina paired-end whole-genome sequencing data
orders and orientations of the flanking regions as sug-gested by pairs of discordant reads within 1 Kb, 3) used a linear function to adjust SV-STAT’s score for variable coverage, and 4) excluded highly repetitive regions with excessive coverage. Otherwise, SV-STAT proceeded with-out significant modification.
SVs predicted by SV-STAT and CREST calls were compared using a window of 500 bp on either side of the SV event. Custom filters were applied to the raw outputs of CREST (see Additional file 1). The average number of calls per tumor sample was roughly similar (SV-STAT: 673+/-91, CREST: 750+/-170), as was the average intersection of SV events (SV-STAT: 85 %+/-2 %, CREST: 86 %+/-3 %). Of the SV events called solely by SV-STAT (n= 606), the deletions (n= 414) and insertions (n= 104) were spread evenly across all chromosomes (fraction of SVs/fraction of genome: 1.0+/-0.3). We used Integrated Genome Viewer [14] to randomly inspect events called uniquely by each algorithm, and found con-sistent patterns. Specifically, CREST did not consider paired-end information; therefore it tended to miss events with the bulk of the soft-clipping at only one of the break-points. Similarly, SV-STAT suffered from false negatives within repetitive regions where the majority of the reads aligned with single-nucleotide mismatches instead of soft-clipping.
While the accuracy demonstrated by SV-STAT is compelling, we have not addressed the detection of novel insertions longer than or approaching the lengths of the analyzed reads. Furthermore, the time complex-ity of SV-STAT’s underlying algorithm is polynomial, as
opposed to the linear time complexities of split-read and paired-end methods. However, the algorithm is readily appended to paired-end analysis, and, in on-going studies, we routinely deploy it for concurrent analysis of larger numbers (>100) of whole-genomes. Furthermore, we built SV-STAT with usability and extensibility in mind. The code is freely available with unit tests, and the software performs checks for its minimal dependencies when launched without parameters.
With further development, we expect to generalize SV-STAT for routine genotyping and discovery of clinic-ally relevant SVs across a wider range of human diseases. In particular, we will extend the software for capability to distinguish germline from somatic SVs. Complex SVs such as those generated by replication-fork stalling [15] where multiple breakpoints occur in close proximity could also be detected with recursive application of SV-STAT when additional soft-clipping remains following alignment of the stacked reads to the SV. Lastly, as a timesaving measure for this study, we used BreakDancer for the initial pairs of candidate breakpoints, but we will remove this dependency in the future, relying instead on the discordant read pairs obtained directly from the alignments.
Conclusions
Similar approaches to measure support for candidate junctions in unpaired deep-sequencing data were re-ported [16–18]. SV-STAT extends these methods by adjusting a chimeric read’s support of an SV by 1) the number of its soft-clipped bases and 2) the quality of its
Fig. 2SV-STAT is more accurate than alternative methods for determining base-pair resolved breakpoints of translocations given unpaired Roche/
alignment to the junction. Our results demonstrate the current version of SV-STAT is valuable in conjunction with DNA sequencing and existing tools for accurate genotyping and discovery of recurrent and novel SVs, respectively. In particular, SV-STAT’s scoring metric is applicable to alignments of test reads given any collection of suspected SVs, regardless of the method of assembly. Furthermore, detecting the inversion in 454/Roche data and the insertions and deletions genome-wide in Illumina data illustrates the capability of SV-STAT to interrogate a wide range of target sizes and to predict a diversity of candidate junction types across multiple platforms.
Availability and requirements
Project name: SV-STAT
Project home page:https://gitorious.org/svstat/svstat Operating system(s): Unix-based
Programming language: Perl, Python, and bash
Other requirements: cdbfasta, bwa, picard, samtools, bioperl, and bedtools
License: GPLv3
Additional file
Additional file 1:Supplemental implementation, methods, figures, and
tables. (DOCX 1382 kb)
Acknowledgements
We thank the patients and families who contributed to this study. This work was supported by the following grants from the NIH: National Institute of General Medical Sciences (K12 GM084897 to DIR), and a training fellowship from the Keck Center for Interdisciplinary Bioscience Training of the Gulf Coast Consortia (T15 LM007093 to CFD).
Authors’contributions
CFD, DIR, and MNB carried out the bioinformatics analysis. HW, YD, and SPD performed the molecular validation. DAW and CFD conceived of the algorithm. CFD wrote the code. DMM performed the experiments. CFD and CCL wrote the manuscript. CCL, RAG, and CFD conceived of the study, and participated in its design and coordination. All authors read and approved the final manuscript.
Competing interests
The authors declare that they have no competing interests.
Author details
1Structural and Computational Biology and Molecular Biophysics (SCBMB)
Program, Baylor College of Medicine, Houston, TX 77030, USA.2Texas
Children’s Cancer Center, Baylor College of Medicine, Houston, TX 77030, USA.3W. M. Keck Center for Interdisciplinary Bioscience Training, Houston, TX
77005, USA.4Human Genome Sequencing Center, Baylor College of
Medicine, One Baylor Plaza, N1621, Houston, TX 77030, USA.
Received: 11 February 2015 Accepted: 29 March 2016
References
1. Meyer M, Stenzel U, Myles S, Prufer K, Hofreiter M. Targeted high-throughput sequencing of tagged nucleic acid samples. Nucleic Acids Res. 2007;35(15):e97. 2. Albert TJ, Molla MN, Muzny DM, Nazareth L, Wheeler D, Song X, Richmond
TA, Middle CM, Rodesch MJ, Packard CJ, Weinstock GM, Gibbs RA. Direct
selection of human genomic loci by microarray hybridization. Nat Methods. 2007;4(11):903–5.
3. Grossmann V, Kohlmann A, Klein HU, Schindela S, Schnittger S, Dicker F, Dugas M, Kern W, Haferlach T, Haferlach C. Targeted next-generation sequencing detects point mutations, insertions, deletions and balanced chromosomal rearrangements as well as identifies novel leukemia-specific fusion genes in a single procedure. Leukemia. 2011;25(4):671–80. 4. Talkowski ME, Ernst C, Heilbut A, Chiang C, Hanscom C, Lindgren A, Kirby A,
Liu S, Muddukrishna B, Ohsumi TK, Shen Y, Borowsky M, Daly MJ, Morton CC, Gusella JF. Next-generation sequencing strategies enable routine detection of balanced chromosome rearrangements for clinical diagnostics and genetic research. Am J Hum Genet. 2011;88(4):469–81.
5. Alkan C, Coe BP, Eichler EE. Genome structural variation discovery and genotyping. Nat Rev Genet. 2011;12(5):363–76.
6. Alkan C, Sajjadian S, Eichler EE. Limitations of next-generation genome sequence assembly. Nat Methods. 2011;8(1):61–5.
7. Treangen TJ, Salzberg SL. Repetitive DNA and next-generation sequencing: computational challenges and solutions. Nat Rev Genet. 2011;13(1):36–46. 8. Ye K, Schulz MH, Long Q, Apweiler R, Ning Z. Pindel: a pattern growth
approach to detect break points of large deletions and medium sized insertions from paired-end short reads. Bioinformatics. 2009;25(21):2865–71. 9. Suzuki S, Yasuda T, Shiraishi Y, Miyano S, Nagasaki M. ClipCrop: a tool for
detecting structural variations with single-base resolution using soft-clipping information. BMC Bioinformatics. 2011;12 Suppl 14:S7.
10. Wang J, Mullighan CG, Easton J, Roberts S, Heatley SL, Ma J, Rusch MC, Chen K, Harris CC, Ding L, Holmfeldt L, Payne-Turner D, Fan X, Wei L, Zhao D, Obenauer JC, Naeve C, Mardis ER, Wilson RK, Downing JR, Zhang J. CREST maps somatic structural variation in cancer genomes with base-pair resolution. Nat Methods. 2011;8(8):652–4.
11. Klein HU, Bartenhagen C, Kohlmann A, Grossmann V, Ruckert C, Haferlach T, Dugas M. R453Plus1Toolbox: an R/Bioconductor package for analyzing Roche 454 Sequencing data. Bioinformatics. 2011;27(8):1162–3. 12. Reid JG, Carroll A, Veeraraghavan N, Dahdouli M, Sundquist A, English A,
Bainbridge M, White S, Salerno W, Buhay C, Yu F, Muzny D, Daly R, Duyk G, Gibbs RA, Boerwinkle E. Launching genomics into the cloud: deployment of Mercury, a next generation sequence analysis pipeline. BMC Bioinformatics. 2014;15(30):1471–2105.
13. Plon SE, Wheeler DA, Strong LC, Tomlinson GE, Pirics M, Meng Q, Cheung HC, Begin PR, Muzny DM, Lewis L, Biegel JA, Gibbs RA. Identification of genetic susceptibility to childhood cancer through analysis of genes in parallel. Cancer Genet. 2011;204(1):19–25.
14. Robinson JT, Thorvaldsdottir H, Winckler W, Guttman M, Lander ES, Getz G, Mesirov JP. Integrative genomics viewer. Nat Biotechnol. 2011;29(1):24–6. 15. Lee JA, Carvalho CM, Lupski JR. A DNA replication mechanism for
generating nonrecurrent rearrangements associated with genomic disorders. Cell. 2007;131(7):1235–47.
16. Maher CA, Kumar-Sinha C, Cao X, Kalyana-Sundaram S, Han B, Jing X, Sam L, Barrette T, Palanisamy N, Chinnaiyan AM. Transcriptome sequencing to detect gene fusions in cancer. Nature. 2009;458(7234):97–101.
17. Lam HY, Mu XJ, Stutz AM, Tanzer A, Cayting PD, Snyder M, Kim PM, Korbel JO, Gerstein MB. Nucleotide-resolution analysis of structural variants using BreakSeq and a breakpoint library. Nat Biotechnol. 2010;28(1):47–55. 18. Kidd JM, Sampas N, Antonacci F, Graves T, Fulton R, Hayden HS, Alkan C,