www.biogeosciences.net/12/713/2015/ doi:10.5194/bg-12-713-2015
© Author(s) 2015. CC Attribution 3.0 License.
Technical Note: Maximising accuracy and minimising cost of a
potentiometrically regulated ocean acidification simulation system
C. D. MacLeod1, H. L. Doyle2, and K. I. Currie2,3
1Department of Zoology, University of Otago, Dunedin, New Zealand 2Department of Chemistry, University of Otago, Dunedin, New Zealand
3National Institute of Water and Atmospheric Research (NIWA), Dunedin, New Zealand Correspondence to: C. D. MacLeod ([email protected])
Received: 17 March 2014 – Published in Biogeosciences Discuss.: 28 May 2014 Revised: 30 October 2014 – Accepted: 14 November 2014 – Published: 5 February 2015
Abstract. This article describes a potentiometric ocean acid-ification simulation system which automatically regulates pH through the injection of 100 % CO2 gas into
temperature-controlled seawater. The system is ideally suited to long-term experimental studies of the effect of acidification on bi-ological processes involving small-bodied (10–20 mm) cal-cifying or non-calcal-cifying organisms. Using hobbyist-grade equipment, the system was constructed for approximately USD 1200 per treatment unit (tank, pH regulation apparatus, chiller, pump/filter unit). An overall tolerance of±0.05 pHT
units (SD) was achieved over 90 days in two acidified treat-ments (7.60 and 7.40) at 12◦C using glass electrodes cal-ibrated with synthetic seawater buffers, thereby preventing liquid junction error. The performance of the system was val-idated through the independent calculation of pHT (12◦C)
using dissolved inorganic carbon and total alkalinity data taken from discrete acidified seawater samples. The system was used to compare the shell growth of the marine gas-tropod Zeacumantus subcarinatus infected with the trema-tode parasite Maritrema novaezealandensis with that of un-infected snails at pH levels of 7.4, 7.6, and 8.1.
1 Introduction
The carbon dioxide (CO2)produced by human activity since
1850 has reduced average surface oceanic pH from approx-imately 8.2 to 8.1, while current CO2emission projections
predict that oceanic pH will reach 8.06–7.77 by 2100 and ap-proximately 7.41 by 2300 (IPCC, 2014). The mechanism re-sponsible for this process is the sequestration of atmospheric
CO2 by the global ocean and a subsequent increase in
hy-drogen ion activity caused by a series of chemical reactions initiated by the dissolution of CO2into seawater:
CO2(aq)+H2O(l)H2CO3(aq) (R1)
H2CO3(aq)HCO−3(aq)+H +
(aq) (R2)
HCO−3(aq)CO32−(aq)+H+(aq) (R3)
CO23−(aq)+H(+aq)HCO−3(aq) (R4) where H2CO3is carbonic acid and HCO−3 and CO
2−
3 are the
bicarbonate and carbonate ions, respectively. The global re-duction of ocean pH has become known as ocean acidifica-tion (OA), although the term also refers to changes in the concentration of carbonic acid and bicarbonate and carbon-ate ions, in addition to increased hydrogen ion activity (Re-actions R1–R4).
The altered chemical speciation of seawater caused by OA poses a variety of challenges to all marine species, e.g. the maintenance of intra- and extra-cellular acid–base homeosta-sis in a more acidic environment (Pörtner et al., 2004) or the synthesis and dissolution of calcium carbonate (CaCO3)
in areas of naturally elevated acidity have already been re-ported (e.g. Gruber et al., 2012). To date, the majority of experimental research into the effects of OA has focussed on single marine species in an attempt to identify those with or without the ability to adapt to acidified conditions within a single generation. The identification of such phenotypic plasticity in response to stressors associated with OA is vi-tal, as evolutionary adaptation may not occur at a sufficient rate to protect some species from changing marine condi-tions (Bell and Collins, 2008). However, it is now accepted that OA research must move beyond single-species experi-ments and begin investigating the effects of combined abi-otic factors, such as pH and temperature (Boyd, 2011), and the potential effects of OA on biological interactions such as competition (Hoffman et al., 2012), predation (Dixon et al., 2010; Allan et al., 2013), and parasitism (MacLeod and Poulin, 2012). This paradigm does not negate the importance of single-species/single-factor experiments but rather broad-ens the scope of OA research. A thorough investigation of a species’ response to novel abiotic stressors should begin with single-factor manipulations and then introduce increas-ing levels of complexity to fully document potential syner-gistic reactions between parameters. Given the current rate of ocean acidification (∼0.0018 pH units yr−1, Feely et al., 2009), the identification of species and species’ interactions that are vulnerable to OA, alone or in combination with other abiotic factors, should be urgently addressed; lab-based sim-ulations will play an important role in achieving this goal (Widdecombe et al., 2010).
This article provides a detailed description of a low-cost, easy set-up OA simulation system that reliably mimics the effects of elevated atmospheric CO2on seawater chemistry
by controlling temperature, salinity, pH, and total alkalin-ity (AT). In addition, we suggest goal tolerances, i.e. the
variability around target parameter values expressed as stan-dard deviations, for the control of these parameters: tem-perature (±0.5◦C), salinity (±0.6), pH (±0.05), and AT
(±10 µmol kg−1). We believe these tolerance values repre-sent realistic and achievable goals for OA simulation sys-tems, as they can be met with relatively inexpensive apratus and cause minimal changes to calculated carbonate pa-rameters (Table 3).
2 OA simulation systems 2.1 Review
OA simulation systems must be able to reliably manipulate the carbonate chemistry of seawater, which is characterised by seven parameters: (1) temperature (◦C); (2) salinity (re-ported on the Practical Salinity Scale); (3) depth (metres); (4) pH:
pH= −log[H+] (1)
(5) total alkalinity (ATµmol kg−1):
AT= [HCO−3] +2[CO32−] + [B(OH)−4] + [OH−] (2)
+ [HPO24−] +2[PO43−] + [SiO(OH)−3] + [NH3]
+ [HS−]−[H+]−[HSO−4]−[HF]−[H3PO4]. . .
(6) dissolved inorganic carbon concentration (DIC-µmol kg−1):
DIC= [CO2] + [H2CO3] + [HCO−3] + [CO23−] (3)
(7) partial pressure of seawater CO2(pCO2-µatm):
p(CO2)=x(CO2)P (4)
wherex(CO2)represents the mole fraction of CO2 in the
gas phase in equilibrium with seawater andP represents the total pressure. For detailed definitions of the analytical pa-rameters used to characterise seawater carbonate chemistry, please see Dickson et al. (2007). Of the seven variables listed above, temperature, salinity, depth (if applicable), and two of the four analytical parameters must be known, in addition to appropriate equilibrium constants, to fully characterise the carbonate chemistry of the modified seawater and quantify variables central to the effects of OA, e.g. saturation states of calcium carbonate polymorphs or concentrations of HCO−3 and CO23−. Accordingly, one must control salinity, temper-ature, and two of the four analytical parameters described above to manipulate the carbonate chemistry of seawater in experimental OA simulation systems.
Riebesell et al. (2010) compiled a detailed guide for the standardisation of methodology used in the manipulation and measurement of carbonate chemistry (The Guide to Best
Practices for Ocean Acidification Research and Data Re-porting). Since the publication of the guide, there have been
several published descriptions of OA simulation systems which use a variety of techniques to acidify seawater: gas injection (CO2/O2/N2 – Bockmon et al. (2013); 100 %
CO2 – Wilcox-Freeburg et al., 2013), the addition of CO2
-enriched seawater (McGraw et al., 2010), and the addition of HCl (Riebesell et al., 2000). Despite the many differences between experimental approaches, almost all simulation sys-tems are regulated through the measurement of pH as a mas-ter variable.
the reduced degree of precision, potentiometric measurement of pH is the central component of most OA simulation sys-tems designed to explore the effects of reduced pH on bio-logical organisms (Easley and Byrne, 2012). Indeed, in the 2013 special OA issue of the journal Marine Biology (Au-gust, Volume 160, Issue 8), 31 out of 32 (97 %) experimental articles used manipulation techniques controlled by, or mon-itored through, the potentiometric measurement of pH.
The regulation of temperature, salinity, and AT is often
not discussed in detail in the OA literature, despite the cen-tral role of these variables in the control of carbonate chem-istry. Temperature is typically controlled by actively heat-ing or coolheat-ing the acidified seawater to a target value usheat-ing a variety of commonly available lab equipment, e.g. chiller units, temperature-controlled rooms, or heating coils. Salin-ity is often monitored but not controlled, as many simulation systems are supplied with seawater from a large reservoir or permanent connection to the ocean or passively controlled through the regular replacement of seawater. The AT of an
OA simulation system can be altered by the biological ac-tivity of experimental organisms. Consequently,ATis often
also regulated through the replacement of seawater or with a flow-through system. Possibly as a consequence of the com-monplace (temperature) or passive (salinity and AT)
meth-ods of regulation, tolerances of these parameters are often not reported in OA literature. In the 2013 special OA issue of the journal Marine Biology, 14 studies used temperature, salinity, pH, and AT to control and describe seawater
car-bonate chemistry. Six of these studies reported no measure of temperature variance, 8 reported no salinity variance, and 5 reported no AT variance. In addition, some articles gave
parameter tolerances as standard error (SE), with or without the corresponding sample size, making comparisons of toler-ance levels between studies difficult. As the measurement of pH is subject to many sources of uncertainty, the tolerances of temperature, salinity, andAT should be stated explicitly
and clearly in the description of OA simulation systems. 2.2 Described system
2.2.1 Overview
The described system manipulates the carbonate chemistry of seawater through the pH-controlled injection of 100 % CO2 gas. The use of pH as a controlling variable and CO2
gas as an acidifying agent has two key advantages over other acidification techniques. First, the addition of CO2gas more
realistically mimics the effects of increased atmospheric CO2
on seawater chemistry than the addition of an acid (Hurd et al., 2009, Schulz et al., 2009). Second, the pH-controlled ad-dition of CO2gas reduces pH variation when compared to the
injection of gas–air mixes at a fixed rate; the latter can result in unwanted fluctuations in pH caused by biological activity, changes in temperature, or increases in ambient atmospheric CO2 (Wilcox-Freeburg et al., 2013). In this system,
[image:3.612.310.549.66.221.2]seawa-24 1
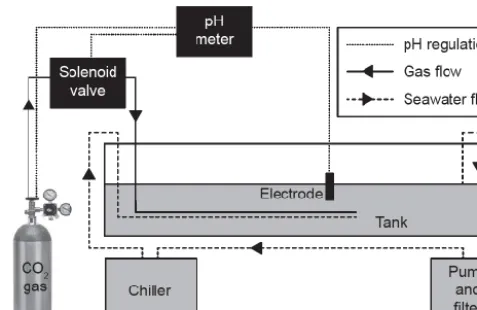
Figure 1Schematic of one OA simulation unit. Dashed lines indicate gas flow, solid lines indicate seawater 2
flow, and dotted lines indicate electrical connections between components of pH regulation apparatus. 3
4 5 6 7
Figure 1. Schematic of one OA simulation unit. Solid lines indicate
gas flow, dashed lines indicate seawater flow, and dotted lines in-dicate electrical connections between components of pH regulation apparatus.
ter temperature was actively maintained at 12.6±0.5◦C, while salinity (31.6±0.6) and AT (2375±10 µmol kg−1)
were passively controlled through the regular replacement of seawater.
2.2.2 Apparatus
The described experimental apparatus consists of three iden-tical units (Fig. 1), each capable of independently mimicking the effects of increased atmospheric CO2on seawater, i.e.
el-evatedpCO2and DIC and reduced pH. The pH of culture
tank seawater was constantly monitored potentiometrically and automatically regulated through the injection of 100 % food-grade CO2 gas. In each tank, 80 L of seawater was
contained in a 120 L open-top tank (870 mm (L)×600 mm (W)×295 mm (H), food-grade low-density polyethylene, Stowers Containment Solutions, NZ). Unamended seawa-ter was supplied by the Portobello Marine Research Sta-tion, Dunedin, New Zealand, and was high-pressure filtered through sand prior to use. The unamended seawater had a total alkalinity of 2354×10 µmol kg−1(n=6), and a salin-ity of 31.5±0.5. pH in each culture tank was regulated us-ing TUNZE™pH/CO2controller systems (glass electrodes,
pH meter, solenoid switch unit, and a pressure reducer) con-nected to 33 kg gas cylinders containing 100 % food grade CO2 (BOC). The TUNZE™ system automatically allowed
CO2 gas to flow from the pressurised cylinders through the
meters have no automatic temperature compensation func-tion), seawater was pumped through a 1/5 hp refrigeration unit (Hailea HC-150A) using an aquarium pump–filter sys-tem (Aqua One®, Aquis700) at a rate of approximately 400 L h−1. To minimise changes in salinity andAT caused
by evaporation, calcification, shell dissolution, or respiration, 20 L of seawater was removed from each tank every 48 h and gradually (30 L h−1) replaced with unamended seawa-ter. Each culture tank was also aerated with ambient air by an aquarium bubbler (AquaOne 9500), and oxygen satura-tion (measured daily with a YSI ProODO) was greater than 95 % for the duration of the experimental period.
2.2.3 Measurement of analytical parameters
As noted in Easley and Byrne (2012), there are a number of challenges inherent in the potentiometric measurement of pH: calibration buffers must be of similar ionic strength to samples to avoid liquid junction error (see the Discus-sion section for a complete description of liquid junction er-ror) (Millero et al., 1993; Waters, 2012); preparing saltwater buffers in the lab can lead to pH variation due to human error; post-preparation, the pH of buffers can be altered through contact with ambient atmospheric CO2; electrode function
can degrade over time and result in a deviation from the ideal Nernstian slope required to convert volts to pH units; and all electrodes are subject to a certain degree of drift over time (Dickson et al., 2007).
In the described system, pH meters were calibrated us-ing homemade saltwater buffers
(2-amino-2-hydroxy-1,3-propanediol (TRIS) and 2-aminopyridine (AMP)) prepared
in accordance with Dickson et al. (2007). Buffer salinity was slightly higher than that of seawater in the culture tanks (35 vs.∼32); however, the consequent error was assumed to be less than 0.005 pH units (Dickson et al., 2007). In case of small deviations of buffer pH caused by human error dur-ing preparation, buffers were analysed with an Agilent 8453 spectrophotometer using pure meta-Cresol Purple (mCP) (provided by the laboratory of Professor Robert H. Byrne, University of South Florida) at 25◦C, and pHT was
calcu-lated from a measured mCP spectrum using the calibration of Liu et al. (2011). After preparation, saltwater buffers were aliquoted into 100 mL borosilicate Schott bottles in front of an air pump modified to produce CO2-depleted air, thus
minimising the effect of ambient CO2 on buffer pH. With
[image:4.612.312.545.108.164.2]appropriate storage protocols, saltwater buffers prepared in this way have proved stable for up to one year, and subse-quent degradation is approximately 0.0005 pH units per year (Nemzer and Dickson, 2005).
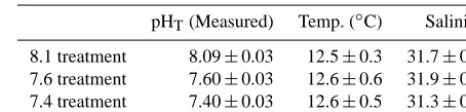
Table 1. Average values (±SD,n=64) for pHT, temperature, and
salinity, recorded over a 90-day period in three pH treatment tanks during the culture of Z. subcarinatus.
pHT(Measured) Temp. (◦C) Salinity
8.1 treatment 8.09±0.03 12.5±0.3 31.7±0.6 7.6 treatment 7.60±0.03 12.6±0.6 31.9±0.6 7.4 treatment 7.40±0.03 12.6±0.5 31.3±0.6
In addition to frequent calibration of pH electrodes to com-pensate for drift, TRIS and AMP buffers were used to en-sure that all electrode responses were within 0.2–0.3 % of the ideal Nernst value (0.05916 V) at 25◦C (Dickson et al., 2007; Millero et al., 1993):
Electrode response = EMFAMP−EMFTRIS/pHTRIS−pHAMP (5) where EMF refers to electromotive force, measured in volts. Variability in culture tank pH was minimised through a two-stage monitoring process. Seawater pH in each tank was constantly measured with electrodes connected to the CO2 delivery system (TUNZE™, two-point calibration,
±0.01 pH units). As individual electrodes are prone to drift even with frequent calibration (Dickson et al., 2007), an inde-pendent, hand-held pH meter (Denver Instrument Company AP50, two-point calibration,±0.002 pH units) was also used to measure culture tank pH daily. If the Denver pH meter de-tected deviations from the target pH, the TUNZE™apparatus was adjusted, allowing for centralised control of pH using the most precise meter available.
The performance of the potentiometric apparatus was also validated with the calculation of pHT (12◦C) based on AT and DIC data taken from culture tank seawater, using
SWCO2 Software (Hunter, 2007) and the dissociation con-stants of Mehrbach et al. (1973) refit by Dickson and Millero (1987). Total alkalinity was measured with a closed-cell po-tentiometric apparatus, based on the system described by Dickson et al. (2007), while DIC was measured using infra-red analyses of CO2evolved from an acidified sample
(AIR-ICA DIC analyser (Automated Infra Red Inorganic Carbon Analyzer), by MARIANDA). Measurements ofATand DIC
were calibrated using certified reference materials (CRM) from the lab of Professor Andrew Dickson, University of California San Diego. Seawater taken from culture tanks was stored in 1000 mL borosilicate Schott bottles and fixed with a saturated solution of mercuric chloride prior toATand DIC
analysis (per recommendations of Riebesell et al., 2010).
3 Assessment
3.1 Carbonate parameters
(Zeacumantus subcarinatus), collected from Otago Harbour, Dunedin, New Zealand. During the experimental period, temperature, salinity, and pH were measured daily (Table 1), while AT and DIC were analysed from samples taken
ap-proximately every 18 days (Table 2). Table 2 also lists other relevant carbonate parameters calculated using DIC andAT
as measured variables.
pHT (12◦C), measured both potentiometrically and
cal-culated from DIC andATdata, varied by±0.03–0.04 units
(SD) in all three culture tanks over the 90-day period (measured: 7.40±0.03, 7.60±0.04; calculated: 7.45±0.04, 7.64±0.04) (Fig. 2). While the calibration of all electrodes occurred weekly, there was very little drift in the electrodes connected to the CO2 regulation apparatus. Temperature,
controlled by the chiller units, was also stable across all culture tanks, while salinity and AT showed minimal
vari-ation (Table 1). However, there was a greater relative uncer-tainty in salinity (approximately 2 %) thanAT(< 0.5 %) over
the experimental period. We assume that this was due to a greater variability in salinity over the entire 90-day period, detected by more frequent sampling (n=64) compared to
AT (n=6). As expected, DIC (measured) andpCO2
(calcu-lated) increased in all culture tanks after the injection of CO2
gas (Hansen et al., 2013; Campbell and Fourqueran, 2011; Findlay et al., 2008), while AT remained unchanged in all
treatments (Table 2).
Sources of error in our measurement of pH include the following: spectrophotometric measurement of buffer pH (±0.004, Carter et al., 2013); differences between buffer salinity and seawater salinity (< 0.005, Dickson et al., 2007); and the potentiometric measurement of seawater pH (±0.01– 0.002, pH meter specifications).
In addition, while the variability of temperature, salinity, andAT was relatively minor, measurement errors or
incor-rect calibrations (“offsets”) in these parameters will result in offsets in the calculated parameters central to the study of the effects of OA on marine organisms. Table 3 contains exam-ples of the offsets in calculated carbonate parameters caused by values of uncertainty found in this study. The uncertainty in calculated pH resulting from uncertainties in measuredAT
(10 µmol kg−1)and DIC (10 µmol kg−1), and uncertainty in the dissociation constants (pK) of H2CO3(0.01) and HCO−3
(0.02), gives an uncertainty in calculated pHT of
approxi-mately 0.05 pH (Dickson and Riley, 1978). Thus, this error estimate in pH is in good agreement with the difference be-tween our measured and calculated values for seawater pH; measured pH was between 0.03 and 0.05 lower than calcu-lated pH in all pH treatments.
3.2 Culture of biological organisms
To investigate the potential interaction of infection stress and stressors associated with OA on the growth of Z.
subcar-inatus, 180 snails (average length, 14.4±1.3 mm; average
mass, 0.22±0.05 g) were distributed evenly between three
pH treatments: 8.1, 7.6, and 7.4. Of the 60 snails in each treatment, 30 were infected with the marine trematode par-asite Maritrema novaezealandensis and 30 had no parasitic infection. Each group of 30 snails was further subdivided into groups of 5 and placed in mesh chambers which allowed the flow-through of seawater. Prior to exposure to acidified sea-water, all snails were soaked for 24 h in a saltwater solution of calcein, a soluble fluorochrome which is incorporated into growing calcified structures and produces a fluorescent band which can be treated as a baseline for subsequent growth (Ri-ascos et al., 2007). The snails were maintained in the three pH treatments for a total of 90 days, although during that time each tank was assigned a particular pH for only 30 days. During the reassignment of tank pH, snails from the con-trol (8.1 pH) culture tank were first removed and placed in a second aerated container. The now vacant tank was then acidified to 7.6 pH and snails transferred from the tank previ-ously assigned that treatment. This process was repeated for the snails in the 7.4 pH treatment, and the tank originally as-signed 7.4 pH was allowed to re-equilibrate with atmospheric CO2before the “control” snails were replaced. This stepwise
changeover removed the potential for tank effect to bias ex-perimental data and reduced any variation in pH conditions experienced by the snails.
After 90 days, all snails were removed from the cul-ture tanks and the growing edge of their shell imaged un-der UV light (Leica camera (DFC320) and dissecting scope (MZFL11), 6.4×magnification). New shell growth, visible beyond the fluorescent band, was measured with ImageJ software, and these data were analysed with a two-factor ANOVA (analysis of variance) to test the effects of pH and infection on shell growth. Analysis of variance showed that there was significantly reduced growth under acidified con-ditions in infected and uninfected snails (Fig. 3) and that in-fected snails grew more than uninin-fected individuals in all pH treatments. The complete details of this study and the bio-logical interpretations of the findings will be published else-where.
4 Discussion and recommendations 4.1 Overview
This article describes an OA simulation system that main-tained temperature, salinity, pH, and AT within goal
tol-erances in three 80 L seawater culture tanks over 90 days. The system was used to culture the New Zealand mud snail,
Zeacumantus subcarinatus, to investigate the effects of
re-duced pH on individuals infected with the marine trematode
M. novaezealandensis relative to uninfected conspecifics. All
Table 2. Average values (±SD,n=6) forATand DIC (measured) and pHTandpCO2(calculated) recorded over a 90-day period in three pHTtreatments during the culture of Z. subcarinatus.
Alkalinity (µmol kg−1) DIC (µmol kg−1) pHT(calculated) pCO2(calculated)
8.1 treatment 2361±10 2138±11 8.12±0.03 365±30
7.6 treatment 2389±7 2351±16 7.64±0.04 1304±115
[image:6.612.101.534.206.494.2]7.4 treatment 2375±12 2397±13 7.45±0.04 1980±110
Table 3. A comparison of the offsets resulting in calculated carbonate parameters by offsets or calibration errors in measured variables. The
top line shows calculated values for DIC,pCO2,a, andc, calculated based on the average oceanic values for temperature, salinity, pH, andATreported in Riebesell et al. (2010). Text in bold indicates the parameter that was varied.
Measured parameters Calculated parameters
Temperature (◦C) Salinity pH
T AT(µmol kg−1) DIC (µmol kg−1) pCO2(µatm) a c
Oceanic average (2010) 18.7 34.8 8.062 2305 2050 384 2.83 4.38 Temperature (±0.5◦C) 18.2–19.2 34.8 8.062 2305 2054–2045 384–384 2.79–2.88 4.31–4.45 Salinity (±0.6) 18.7 34.2–35.4 8.062 2305 2054–2046 386–382 2.81–2.86 4.35–4.41 pHT(±0.05) 18.7 34.8 8.012–8.112 2305 2075–2022 440–334 2.58–3.11 3.99–4.80
AT(±10 µmol kg−1) 18.7 34.8 8.062 2295–2315 2040–2058 381–384 2.83–2.85 4.37–4.41
Temp. and salinity 18.2–19.2 34.2–35.4 8.062 2305 2057–2041 385–381 2.77–2.91 4.29–4.48 Temp., salinity, andAT 18.2–19.2 34.2–35.4 8.062 2295–2315 2048–2050 383–382 2.76–2.92 4.27–4.50
Temp., salinity,AT, and pHT 18.2–19.2 34.2–35.4 8.012–8.112 2295–2315 2074–2023 440–334 2.51–3.19 3.88–4.92
Liquid junction error (±0.065 pH) 18.7 34.8 7.997–8.127 2305 2083–2014 458–320 2.51–3.19 3.88–4.93
25 1
Figure 2 pHT recorded over the course of a 90-day experiment in which snails were maintained in three 2
culture tanks: 8.1 (green), 7.6 (blue), 7.4 (red) pHT. Coloured lines represent pHT data recorded on 3
Denver AP50 hand held pH meter and black lines represent ±0.05 error around target pHT values. 4
5 6 7
Figure 2. pHTrecorded over the course of a 90-day experiment in
which snails were maintained in three culture tanks: 8.1 (green), 7.6 (blue), 7.4 (red) pHT. Coloured lines represent pHTdata recorded on Denver AP50 hand-held pH meter, and black lines represent ±0.05 error around target pHTvalues.
The design of OA simulation systems is under constant development and review (e.g. Findlay et al., 2008; McGraw et al., 2010; Wilcox-Freeburg et al., 2013). The system de-scribed here improves the tolerance and repeatability of the potentiometric measurement and regulation of pH in an OA simulation system by (a) using two synthetic seawater buffers to calibrate glass electrodes and report pH on the total hydro-gen ion scale (pHT) and (b) measuring two additional,
non-pH, carbonate parameters to independently validate pH and monitor changes to seawater chemistry caused by the culture of calcifying organisms. This article also includes an evalua-tion of offsets in calculated carbonate parameters caused by 1
Figure 3 Average shell growth (± SE, sample size as indicated) of infected and uninfected snails in three 2
pH treatment: 7.4, 7.6, 8.1. 3
4
5
6
Figure 3. Average shell growth (±SE, sample size as indicated) of
infected and uninfected snails in three pH treatment: 7.4, 7.6, 8.1.
potential offsets and calibration errors in our measurement of temperature, salinity, pHT, andAT(Table 3). We recommend
that this type of assessment is carried out by all researchers working with OA simulation systems.
4.2 Calibration buffers
To date, the most commonly used buffers for the calibration of electrodes used in OA simulation systems are defined by the National Bureau of Standards (NBS), now known as the National Institute of Standards and Technology (NIST), and report pH on the NBS scale (pHNBS). NBS buffers are
[image:6.612.53.303.217.487.2] [image:6.612.308.544.322.501.2]to facilitate ease of electrode calibration. In the 2013 special OA issue of the journal Marine Biology, 18 out of 32 (56 %) experimental articles used these buffers and reported pH on the NBS scale. However, NBS/NIST buffers have a low ionic strength compared to seawater (0.1 vs. 0.7 M, Waters, 2012; Hurd et al., 2009) and are not recommended for the measure-ment of seawater pH (Zeebe and Gladrow, 2001; Dickson, 1984; Millero, 1986).
When measuring pH with potentiometric apparatus, the use of calibration buffers with a different ionic strength from sampled media leads to an error based on a fundamental as-sumption of potentiometric theory, i.e. that the difference in electric potential between the electrode solution and buffer solution is the same as that between the electrode solution and sample solution (Covington, 1985). This error is re-ferred to as liquid junction error and has been discussed in several articles describing the potentiometric measurement of pH (Dickson et al., 2007; Illingworth, 1981; Easley and Byrne, 2012). The pH scale is essentially a quantification of the difference in electric potential between an ion-selective electrode and a sample solution. If the difference in ionic strength between the calibration buffer and sample is great, the electrode will not accurately report the difference in elec-tric potential or provide repeatable measurements (Zeebe and Gladrow, 2001; Wedborg et al., 2009). Liquid junction error has been reported to cause uncertainties of±0.01–0.14 units in the measurement of seawater pH when using electrodes calibrated with low ionic strength buffers (Dickson, 1993; Easley and Byrne, 2012).The use of NBS buffers not only compromises the repeatability of potentiometrically regu-lated OA simulation experiments, this error is also propa-gated through calculations of other important seawater char-acteristics commonly reported in the OA literature, e.g. the saturation states of aragonite (a) and calcite (c). If we apply an error of ±0.065 pH units (the median of reported liquid junction error values) to a andc in the software program SWCO2, we generate errors of 19 and 15 % respec-tively (Table. 3). The saturation states of aragonite and cal-cite are particularly vulnerable to this degree of error, as the current range of these variables is 1.2–5.4 (a) and 1.9–9.2 (c) (Riebesell et al., 2010), andvalues less than 1.0, com-monly achieved in OA simulation systems, indicate that the dissolution of these CaCO3 polymorphs is
thermodynami-cally favoured (Andersson et al., 2007). This type of error could prevent the correct interpretation of data sets generated in OA experimental studies, as they may indicate a dissolu-tion of calcified structures at saturadissolu-tion states greater than 1.0.
An additional consideration when reporting data generated by an OA simulation system is the choice of pH scale. Mea-surement of seawater pH can be reported on three scales: the free proton scale (pHF), the total hydrogen ion scale (pHT),
and the seawater scale (pHSWS). There has been considerable
debate over which scale is the most appropriate for reporting seawater pH in OA experiments (e.g. Waters and Millero,
2013), although the total hydrogen ion scale (pHT)is most
commonly reported in published data. In the 2013 special OA issue of the journal Marine Biology, pHTwas reported in
14 out of 32 (44 %) of experimental articles, while pHF and
pHSWSwere not used at all. One reason for this trend is that
pHTis generated directly by pH meters calibrated with
salt-water buffers without additional calculation or conversion, as with the free proton and seawater scales. With the increasing availability of these buffers and the importance of establish-ing comparability between data sets, it seems appropriate that pHTshould be adopted as the default scale in OA research.
4.3 DIC andATanalysis
Throughout the 90-day trial of this system, seawater samples were periodically taken from each culture tank and used to measureAT and DIC. The primary purpose of this
analy-sis was to validate the performance of the described system, with respect to the regulation of pH, by using DIC andAT
data to independently calculate the pH of culture tank sea-water using the SWCO2 software. As previously discussed, the calculated pH was in good agreement with the potentio-metrically measured pH, and it is advisable that this addi-tional validation process should be standard procedure after the initial construction of a potentiometrically regulated OA simulation system. A secondary function of measuringAT
and DIC is the identification of alterations to seawater chem-istry caused by the culture of calcifying organisms in acidi-fied seawater. As discussed in Hurd et al. (2009), the addition of 100 % CO2 to seawater is expected to cause an increase
in DIC but not affectAT. However, the culture of marine
organisms in OA simulation systems can alter the concen-tration of carbon species in seawater through photosynthe-sis (decreased CO2), respiration (increased CO2), or
disso-lution of calcified structures (increased HCO−3). During an earlier trial of this system, when acidified treatments were 7.1 and 7.4 pHT(12◦C),ATgreatly exceeded the expected value
of ∼2300 µmol kg−1 (2938.04±1.29 µmol kg−1 (7.1 pH), 2564.16±3.50 µmol kg−1 (7.4 pH)) and DIC was also un-usually high compared to data generated by other systems that used CO2gas to reduce pH (3098.54±5.14 µmol kg−1
(7.1 pH) and 2614.34±2.61 µmol kg−1 (7.4 pH)). We as-sumed that the observed changes in seawater chemistry were caused by the release of HCO−3 through the dissolution of calcified structures, as the snail shells had visibly dissolved, and therefore we increased the replacement rate of seawa-ter from 20 L week−1to 20 L 48 h−1. As reported earlier in
this paper, further analysis ofATand DIC showed that these
the culture of calcifying organisms in acidified seawater, es-pecially in closed or partially closed systems. If only DIC had been measured andAT assumed to be constant, elevated
DIC could have been solely attributed to the addition of CO2
and could have resulted in the introduction of an unknown, additional abiotic factor to the experimental design.
5 Conclusions
The described system increases the accessibility of reliable OA simulation apparatus by using relatively inexpensive equipment that is readily available from aquarium suppliers. With careful calibration and the use of appropriate buffers, it is possible to generate high-quality and repeatable data. In-corporating DIC andATanalysis in the validation of this
sys-tem also provides a greater degree of reliability with regard to pH manipulation and a more complete understanding of the complex nature of seawater chemistry. Additional stressors such as temperature, salinity, and UV radiation could also be easily incorporated into experimental design due to the mod-ular design of this system. Consequently, this system will facilitate the increase in research effort required to identify species, and species’ interactions, vulnerable to novel stres-sors associated with OA, alone or in combination with other abiotic factors.
Acknowledgements. This research was supported by funding
from the University of Otago Doctoral Scholarship Program (C. D. MacLeod), the University of Otago Research Centre for Oceanography (H. L. Doyle), the National Institute of Water and Atmospheric Research (K. I. Currie and H. L. Doyle), and the Departments of Zoology and Chemistry, University of Otago. The authors also thank Robert Poulin, Andrew Dickson, an anonymous reviewer, and members of the Evolutionary and Ecological Par-asitology Research Group, University of Otago, for constructive comments on an earlier draft of this manuscript, and Lisa Bucke, University of Otago, for the preparation of a schematic included in this article.
Edited by: K. Fennel
References
Allan, B. J. M., Domenici, P., McCormick, M. I., Watson, S., and Munday, P. L.: Elevated CO2 affects predator-prey in-teractions through altered performance, PLOS ONE, 8, 1–7, doi:10.1371/journal.pone.0058520, 2013.
Andersson, A. J., Bates, N. R., and Mackenzie, F. T.: Dissolution of carbonate sediments under risingpCO2and ocean acidification: observations from Devil’s Hole, Bermuda, Aquat. Geochem., 13, 237–264, doi:10.1007/s10498-007-9018-8, 2007.
Bell, G. and Collins, S.: Adaptation, extinction and global change, Evol. Appl., 1, 3–16, doi:10.1111/j.1752-4571.2007.00011.x, 2008.
Bockmon, E. E., Frieder, C. A., Navarro, M. O., White-Kershek, L. A., and Dickson, A. G.: Technical Note: Controlled experimen-tal aquarium system for multi-stressor investigation of carbonate chemistry, oxygen saturation, and temperature, Biogeosciences, 10, 5967–5975, doi:10.5194/bg-10-5967-2013, 2013.
Boyd, P. W.: Beyond ocean acidification, Nat. Geosci., 4, 273–274, doi:10.1038/ngeo1150, 2011.
Campbell, J. E. and Fourqurean, J. W.: Novel methodology for in situ carbon dioxide enrichment of benthic ecosystems, Limnol. Oceanogr-Meth., 9, 97–109, doi:10.4319/lom.2011.9.97, 2011. Carter, B. R., Radich, J. A., Doyle, H. L., and Dickson,
A. G.: An automated system for spectrophotometric seawa-ter pH measurements, Limnol. Oceanogr-Meth., 11, 16–27, doi:10.4319/lom.2013.11.16, 2013.
Clayton, T. D. and Byrne, R. H.: Spectrophotometric seawater pH measurements: total hydrogen ion concentration scale calibration ofm-cresol purple and at-sea results, Deep-Sea Res., 40, 2115– 2129, doi:10.1016/0967-0637(93)90048-8, 1993.
Covington, A. K., Bates, R. B., and Durst, R. A.: Definition of pH scales, standard reference values, measurement of pH and related terminology, Pure Appl. Chem., 57, 531–542, doi:10.1351/pac198557030531, 1985.
Dickson, A. G.: pH scales and proton-transfer reactions in saline media such as sea water, Geochim. Cosmochim. Ac., 48, 2299– 2308, 1984.
Dickson, A. G.: The measurement of sea water pH, Mar. Chem., 44, 131–142, doi:10.1016/0304-4203(93)90198-W, 1993.
Dickson, A. G. and Millero, F. J.: A comparison of the equilib-rium constants for the dissociation of carbonic acid in seawa-ter media, Deep-Sea Res., 34, 1733–1743, doi:10.1016/0198-0149(87)90021-5, 1987.
Dickson, A. G. and Riley, J. P.: The effect of analytical error on the evaluation of the components of the aquatic carbon-dioxide sys-tem, Mar. Chem., 6, 77–85, doi:10.1016/0304-4203(78)90008-7, 1978.
Dickson, A. G., Sabine, C. L., and Christian, J. R.: Guide to best practices for ocean CO2measurements, PICES Special Publica-tion 3, 191, 2007.
Dixson, D. L., Munday, P. L., and Jones, G. P.: Ocean acidification disrupts the innate ability of fish to detect predator olfactory cues, Ecol. Lett., 13, 68–75, doi:10.1111/j.1461-0248.2009.01400.x, 2010.
Easley, R. A. and Byrne, R. H.: Spectrophotometric Calibration of pH Electrodes in Seawater Using Purified m-Cresol Purple, Environ. Sci. Technol., 46, 5018–5024, doi:10.1021/es300491s, 2012.
Feely, R. A., Doney, S. C., and Cooley, S. R.: Ocean acidification: present conditions and future changes, Oceanogr., 22, 36–47, doi:10.5670/oceanog.2009.95, 2009.
Findlay, H. S., Kendall, M. A., Spicer, J. I., Turley, C., and Widdi-combe, S.: Novel microcosm system for investigating the effects of elevated carbon dioxide and temperature on intertidal organ-isms, Aquat. Biol., 3, 51–62, doi:10.3354/ab00061, 2008. Gruber, N., Hauri, C., Lachkar, Z., Loher, D., Folicher, T.
L., and Plattner, G.: Rapid Progression of Ocean Acidifi-cation in the California Current System, Science, 337, 220, doi:10.1126/science.1216773, 2012.
car-bon from small amounts of seawater using a gas chromatographic system, Biogeosciences, 10, 6601–6608, doi:10.5194/bg-10-6601-2013, 2013.
Hofmann, L. C., Straub, S., and Bischof, K.: Competition between calcifying and noncalcifying temperate marine macroalgae un-der elevated CO2 levels. Mar. Ecol-Prog. Ser., 464, 89–105, doi:10.3354/meps09892, 2012.
Hunter, K. A. SWCO2, http://neon.otago.ac.nz/research/mfc/ people/keith_hunter/software/swco2, last access: 1 March 2014. Hurd, C. L., Hepburn, C. D., Currie, K. I., Raven, J. A., and Hunter, K. A.: Testing the effects of ocean acidification on algal metabolism: considerations for experimental designs, J. Phycol., 45, 1236–1251, doi:10.1111/j.1529-8817.2009.00768.x, 2009. Illingworth, J. A.: A common source of error in pH measurements,
Biochem. J., 195, 259–262, 1981.
IPCC: Climate Change 2014: Impacts, Adaptation, and Vulnerabil-ity. Part A: Global and Sectoral Aspects. Contribution of Work-ing Group II to the Fifth Assessment Report of the Intergovern-mental Panel on Climate Change, edited by: Field, C. B., Barros, V. R., Dokken, D. J., Mach, K. J., Mastrandrea, M. D., Bilir, T. E., Chatterjee, M., Ebi, K. L., Estrada, Y. O., Genova, R. C., Girma, B., Kissel, E. S., Levy, A. N., MacCracken, S., Mastrandrea, P. R., and White, L. L., Cambridge University Press, Cambridge, United Kingdom and New York, NY, USA, 1132 pp., 2014. Kroeker, K. J., Kordas, R. L., Crim, R., Hendriks, I. E., Ramajo, L.,
Sihngh, G. S., Duarte, C. M., and Gattuso, J.: Impacts of ocean acidification on marine organisms: quantifying sensitivities and interaction with warming, Glob. Change Biol., 19, 1884–1889, doi:10.1111/gcb.12179, 2013.
Liu, X., Patsavas, M. C., and Byrne, R. H.: Purification and Char-acterization of meta-Cresol Purple for Spectrophotometric Sea-water pH Measurements, Environ. Sci. Technol., 45, 4862–4868, doi:10.1021/es200665d, 2011.
MacLeod, C. D. and Poulin, R.: Host–parasite interactions: a lit-mus test for ocean acidification?, Trends Parasitol., 28, 365–369, doi:10.1016/j.pt.2012.06.007, 2012.
McGraw, C. M., Cornwall, C. E., Reid, M. R., Currie, K. I., Hep-burn, C. D., Boyd, P., Hurd, C. L., and Hunter, K. A.: An auto-mated pH-controlled culture system for laboratory-based ocean acidification experiments, Limnol. Oceanogr-Meth., 8, 686–694, doi:10.1016/j.marchem.2011.04.002, 2010.
Mehrbach, C., Culberson, C. H., Hawley, J. E., and Pytkowicz, R. M.: Measurements of the apparent dissociation constants of carbonic acid in seawater at atmospheric pressure, Limnol. Oceanogr., 18, 897–907, 1973.
Millero, F. J.: The pH of estuarine waters, Limnol. Oceanogr., 31, 839–847, 1986.
Millero, F. J., Zhang, J.-Z., Fiol, S., Sotolongo, S., Roy, R. N., Lee, K., and Mane, S.: The use of buffers to measure the pH of seawater, Mar. Chem., 44, 143–152, doi:10.1016/0304-4203(93)90199-X, 1993.
Nemzer, B. V. and Dickson, A. G.: The stability and reproducibility of Tris buffers in synthetic seawater, Mar. Chem., 96, 237–242, doi:10.1016/j.marchem.2005.01.004, 2005.
Pörtner, H. O., Langenbuch, M., and Reipschlager, A.: Biological Impact of Elevated Ocean CO2 Concentrations: Lessons from Animal Physiology and Earth History, J. Oceanogr., 60, 705– 718, doi:10.1007/s10872-004-5763-0, 2004.
Riascos, J., Guzman, N., Laudien, J., Heilmayer, O, and Oliva, M.: Suitability of three stains to mark shells of
Concholepas concholepas (Gastropoda) and Mesodesma donacium, J. Shellfish Res., 26, 43–49,
doi:10.2983/0730-8000(2007)26[43:SOTSTM]2.0.CO;2, 2007.
Riebesell, U., Zondervan, I., Rost, B., Tortell, P. D. Zeebe, R. E., and Morel, F. M. M.: Reduced calcification of marine plankton in response to increased atmospheric CO2, Nature, 407, 364–367, doi:10.1038/35030078, 2000.
Riebesell, U., Fabry, V. J., Hansson, L., and Gattuso, J. P.: Guide to best practices for ocean acidification research and data report-ing, Luxembourg, Publications Office of the European Union, 260 pp., 2010.
Schulz, K. G., Barcelos e Ramos, J., Zeebe, R. E., and Riebesell, U.: CO2 perturbation experiments: similarities and differences between dissolved inorganic carbon and total alkalinity manipu-lations, Biogeosciences, 6, 2145–2153, doi:10.5194/bg-6-2145-2009, 2009.
Waters, J. F.: Measurement of seawater pH: a theoretical and ana-lytical investigation, PhD Thesis, University of Miami, Miami, FL, 199 pp., 2012.
Waters, J. F. and Millero, F. J.: The free proton concen-tration scale for seawater pH, Mar. Chem., 149, 8–22, doi:10.1016/j.marchem.2012.11.003, 2013.
Wedborg, M., Turner, D. R., Anderson, L. G., and Dyrssen, D.: Determination of pH, in: Methods of seawater analysis, edited by: Grasshoff, K., Kremling, K., and Ehrhardt, M., New York, Wiley-VCH, 109–125, 2009.
Weiner, S. and Dove, P. M.: An Overview of Biomineralization Processes and the Problem of the Vital Effect, Rev. Mineral. Geochem., 54, 1–29, doi:10.2113/0540001, 2003.
Widdecombe, S., Dupont, S., and Thorndyke, M.: Laboratory ex-periments and benthic mesocosm studies, in: Guide to best prac-tices for ocean acidification research and data reporting, edited by: Riebesell, U., Fabry, V. J., Hansson, L., and Gattuso, J. P., Luxembourg, Publications Office of the European Union, 260 pp., 2010.
Wilcox-Freeburg, E., Rhyne, A., Robinson, W. E., Tlusty, M., Bourque, B., and Hannigan, R. E.: A comparison of two pH-stat carbon dioxide dosing systems for ocean acidifi-cation experiments, Limnol. Oceanogr-Meth., 11, 485–494, doi:10.4319/lom.2013.11.485, 2013.