Spring 2018
Tra
ffi
c Congestion Alert System in Work Zone
Tra c Congestion Alert System in Work Zone
Vamsi Krishna Jagarlamudi
Iowa State University, [email protected]
Follow this and additional works at: https://lib.dr.iastate.edu/creativecomponents Part of the Software Engineering Commons
Recommended Citation Recommended Citation
Jagarlamudi, Vamsi Krishna, "Traffic Congestion Alert System in Work Zone" (2018). Creative Components. 5.
https://lib.dr.iastate.edu/creativecomponents/5
Vamsi Krishna Jagarlamudi
A Creative Component submitted to the graduate faculty
in partial fulfillment of the requirements for the degree of
MASTER OF SCIENCE
Major: Computer Science
Program of Study Committee: Dr. Anuj Sharma , Co-major Professor
Dr. Samik Basu, Co-major Professor Dr. Soumik Sarkar, Professor
Iowa State University
Ames, Iowa
2018
TABLE OF CONTENTS
Page
LIST OF TABLES . . . iv
LIST OF FIGURES . . . v
LIST OF ALGORITHMS . . . vi
ACKNOWLEDGEMENTS . . . vii
ABSTRACT . . . viii
CHAPTER 1. Introduction . . . 1
1.1 Background . . . 1
1.2 Project Objective . . . 2
1.3 Report Organization . . . 3
CHAPTER 2. OVERVIEW . . . 4
3.1 Overview . . . 6
3.1.1 Architecture . . . 6
3.1.2 Software Description . . . 7
3.2 Modules Description . . . 7
3.2.1 Data Collection . . . 7
3.2.2 Data Analysis . . . 8
3.2.3 Processing Engine . . . 9
3.2.4 Console Application . . . 12
3.2.5 Sensor Quality Assurance . . . 13
CHAPTER 4. Results . . . 14
CHAPTER 5. Impact and Future Scope . . . 16
CHAPTER 6. Conclusion . . . 17
LIST OF TABLES
Page
Table 2.1 Reactor Feeds Data . . . 5
LIST OF FIGURES
[image:6.612.106.541.220.453.2]Page
Figure 1.1 Iowa Work Zone Crashes . . . 1
Figure 2.1 High-level architecture of Open Data Services . . . 4
Figure 3.1 High-level architecture of work zone alerts . . . 6
Figure 3.2 Data Collection Architecture . . . 8
Figure 3.3 Processing Engine Architecture . . . 10
Figure 3.5 Console App . . . 13
Figure 4.2 Text Alerts . . . 14
Figure 4.3 Congestion distribution over time . . . 15
List of Algorithms
Page
1 generate work zone events(S) . . . 11
2 congestion alert scheduler() . . . 11
ACKNOWLEDGEMENTS
I would like to take this opportunity to express my thanks to those who helped me with various
aspects of conducting research and the writing of this report. First and foremost, I would like to
express my gratitude to Dr. Anuj Sharma for his guidance and support throughout the course of
this research. I would also like to thank my committee members Dr. Samik Basu and Dr.Soumik
Sarkar for their help and support.
I would thank Shefang Wang for implementing the data analysis module. I would also like to
extend my appreciation to Skylar Knickerbocker for coordinating with DOT and giving regular
ABSTRACT
Road work zones cause more than ten percent of congestion and are the main reason for
non-recurring congestion on freeways. The existing notification system at Iowa work zones was less
efficient with handling the fluctuating and short duration messages. In this report, we explain the
software developed to send reliable congestion alerts using the real-time traffic data.
The system is implemented to consume the Wavetronix sensor data for every twenty seconds
and identifies the traffic congestion state in three predefined formats, such as ”Stop traffic ahead,
”Slow traffic ahead” and ”No congestion.” Whenever severe traffic congestion persists more than
the threshold time, we immediately notify the district traffic engineers with multimedia text alerts.
The text alert content along with the live camera snapshot would help the traffic engineers to
analyze the situation and make better and quick responses. In addition to the text alerts, we also
provide a data API that gives the real-time work zone bottlenecks. The software was developed to
CHAPTER 1. Introduction
1.1 Background
A work zone is defined as a freeway where road construction, maintenance or utility activities
happen. Work zones extend from first warning sign to the end of work zone sign and are marked with
multiple warning signs, pavement markings, and/or work zone vehicles along the way (2). Since
work zone sites introduce narrow passage lanes, closed shoulders or lane shifts, they inherently
alter the regular driving conditions and make travellers and construction workers susceptible to
accidents. In 2015, it is estimated that 96,626 crashes have occurred in the United States, with an
average frequency of one crash for every 5.3 minutes (3). In Iowa, the number of work zone crashes
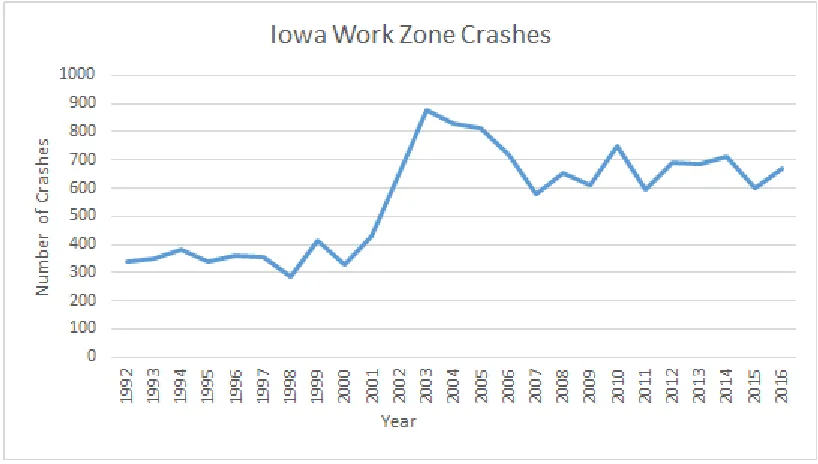
have increased in the last fifteen years. Figure 1.1 displays the work zone crashes trend in Iowa
[image:10.612.100.509.432.664.2]for the last 25 years.
The major factor for work zone crashes is the speed. In 2014, around 28% of the work zone
fatalities caused by the speed. In order to minimize the crash occurrence, it is a common practice
to reduce the speed limits on work zones. Because of the reduced speeds, narrow passages, and lane
closures, work zones become the point of traffic bottlenecks. In 2014, 10% of overall congestion and
24% of nonrecurring congestion caused by work zones (1).
It is necessary for the Traffic Management Center(TMC) to manage the traffic during the
construction to minimize the traffic delays and congestion. Dynamic Message Signs(DMS) are
used to reduce the traffic delays, prevent the traffic congestion, and reduce the risk of accidents.
Dynamic Message Signs posts four different messages, ”Traffic Delays Possible,” ”Slow Traffic
Ahead,” ”Stop Traffic Ahead,” and no display. Dynamic Messages can be triggered by the Traffic
Operations Center or automatically using the sensors. According to Wang et al. (4), the reliability
and the accuracy of the DMS fluctuates with the sensor noise and the existing logic can be improved
with the predictive historical analysis.
1.2 Project Objective
This project is developed to:
• Collect real-time traffic data from Wavetronix sensors.
• Utilize the algorithm and code developed by (4) to reduce the sensor noise and analyze the
work zone traffic conditions.
• Create and archive the work zone congestion events.
• Send reliable and accurate Multimedia congestion notifications to the traffic engineers to take
better and quick decisions on work zone congestion.
• Send notifications to traffic engineers when congestion is cleared.
• Develop data feeds to display real-time bottlenecks.
The rest of this report is organized as follows. Chapter 2 gives an overview of the Open Data
Service project developed at Institute of Transportation(InTrans) that provides a data ingestion
service for the traffic data. Chapter 3 provides the methodologies and software description for the
work zone alert module. Chapter 4 shows the results of the work zone events, and text alerts.
CHAPTER 2. OVERVIEW
Work congestion alert project is sub-component of Open Data Service project. In this chapter,
we provide a brief overview of Reactor Feeds server software developed for Open Data Services.
2.1 Open Data Services
Open Data Services is maintained by REACTOR lab at Institute of Transportation(InTrans) on
behalf of Iowa Department of Transportation (DOT). The Open Data Service is expected to provide
a variety of transportation-related data to both internal DOT and external/third party users. A
hybrid infrastructure model(Reactor Feeds) of in-house High-Performance Computing(HPC) cluster
and the cloud is used to architecture the data ingestion service with data streams, traffic congestion
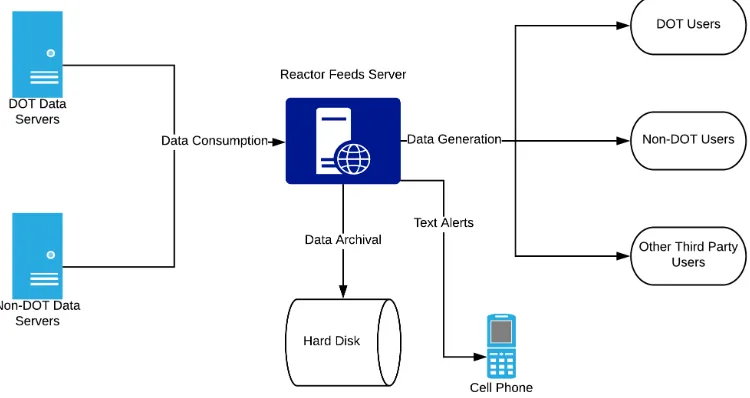
[image:13.612.120.495.443.642.2]alerts, and data analytic (5). Figure 2.1 shows the high-level architecture of Open Data Services.
data from different data providers. The collected data will be processed and transformed into
structured formats like CSV, JSON, etc. The transformed data will then be pipelined into the
archiving module, where the data will be stored into the hard disk, Hadoop clusters or Databases.
The archived data can then be used for future research and applications.The Reactor Feeds server
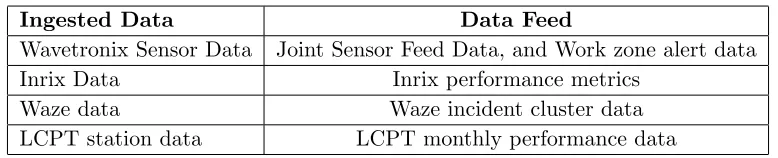
provides performance metrics, and aggregated results of the collected data as data feeds. Table 2.1
[image:14.612.112.501.299.378.2]shows some data collections and feeds supported by Open Data Services.
Table 2.1: Reactor Feeds Data
Ingested Data Data Feed
Wavetronix Sensor Data Joint Sensor Feed Data, and Work zone alert data
Inrix Data Inrix performance metrics
Waze data Waze incident cluster data
LCPT station data LCPT monthly performance data
The work zone congestion alerts project uses the Wavetronix data downloaded from the Reactor
CHAPTER 3. WORK ZONE CONGESTION ALERTS
3.1 Overview
3.1.1 Architecture
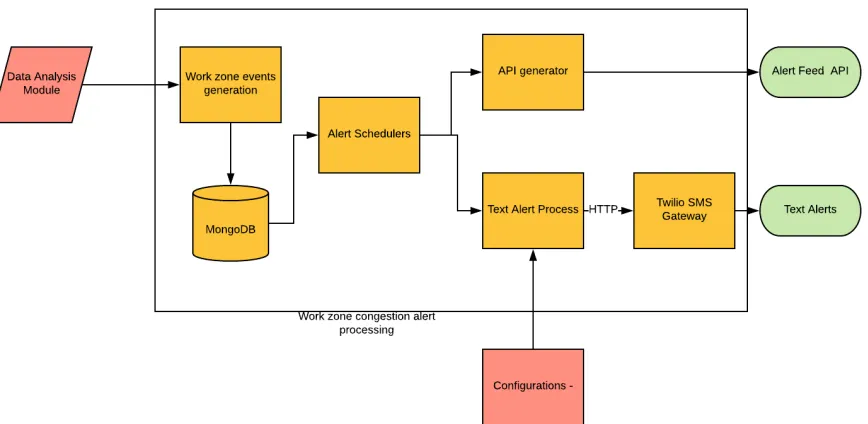
Figure 3.1provides the high-level architecture of the work zone alerts systems. The application
consists of the following components.
1. Data Collection: Downloads sensor data periodically.
2. Data Analysis: Data smoothing, sensor noise reduction, and historical data analysis.
3. Configuration Settings: Manages configuration rules and recipient details.
[image:15.612.144.464.447.662.2]4. Processing: Detects congestion and sends text alerts.
The Reactor Feeds server was developed in Java with Spring Boot framework. We used Spring
schedulers to implement the data ingestion service. The data analysis application uses Weka data
mining packages for classification, and Jwave for wavelet data smoothing. The Data Analysis
module and Reactor Feeds server communicates through Restful services using producer-consumer
pattern. The work zone congestion events are stored on MongoDB and managed with Spring
Data ORM framework. We developed a web application with Node.js and React.js to manage the
configuration settings. Reactor Feeds server interacts with Twilio SMS gateway to distribute the
text alerts.
3.2 Modules Description
3.2.1 Data Collection
More than 1300 Wavetronix radar sensors are placed on the Iowa road networks. These sensors
continuously collect various traffic data like vehicle volume, speeds, and classifications. The Iowa
DOT monitors these sensors and provides web services to download the sensor data. The DOT also
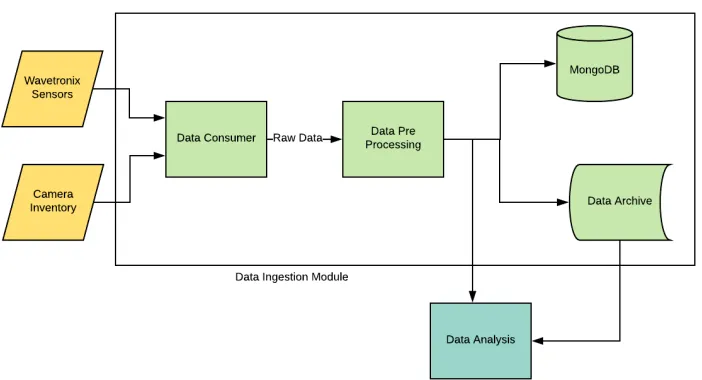
maintains the Camera inventory metadata. As shown in Figure 3.2, we use schedulers to download
the sensor detector data for every 20 seconds, and the sensor inventory and camera inventory data
for once in a day.
Data Description
1. Sensor data service gives the vehicle speeds, classifications, and the vehicle volumes on each
lane (6).
2. Sensor inventory service provides the metadata about the sensor. It includes the sensor
location, operation status, linear-reference, and the detection direction.
3. Camera inventory service provides the information about the camera location, route and the
Figure 3.2: Data Collection Architecture
Data Preprocessing
The DOT servers provide the data in raw XML format. As part of data preprocessing pipeline,
we convert the XML data into CSV and/or JSON formats using XPath and object mappers. Once
the data is transformed, it will be handed over to the data analysis engine to find out the traffic
flow status, and the data archive pipeline to store the data into the file system and/or MongoDB.
3.2.2 Data Analysis
The data analysis module applies the fast wavelet transform on the sensor data for smoothing.
The application is trained with the historical traffic data and uses decision tree model to classify the
average speeds and traffic congestion status. The analysis algorithm and the code are implemented
by Wang based on (4).
The algorithm generates one of the following statuses for the work zone, ”Stop Traffic Ahead,”
”Slow Traffic Ahead,” or ”Normal Traffic.” After the classification, the system posts the average
speeds and work zone status to the Reactor Feeds server using HTTP POST method.
” workzone ”: ”Work z o n e name ” ,
” d e v i c e ”: ” S e n s o r ID ” ,
” avgSpeed ”: ” Average s p e e d ” ,
” a l e r t ”: ”Work z o n e s t a t u s i d e n t i f i e d from t h e d e c i s i o n t r e e model ”
}
3.2.3 Processing Engine
The posted data from data analysis module is used to generate work zone events. A work
zone event is, slow or stop status detected by at least one sensor of that work zone. As shown
in figure 3.3, work zone events will be created or updated in the database based on the sensors
classification report. Schedulers continuously check the database to filter the running work zone
events. A congestion text alert will be sent If a work zone is flagged as stopped traffic for at least
5 minutes(configurable). Similarly, a cleared congestion alert will be sent if the traffic goes back to
normal for at least 5 minutes.
Algorithms 19, 6, 5 provides the pseudo code for the implementation of work zone event
generations, schedulers for congestion and clearance alerts.
Explanation
The algorithm is implemented based on the following assumptions and requirements.
• A work zone can contain multiple sensors.
• A work zone event should be generated if at least one sensor reports SLOW / STOP
condi-tions.
• If all work zone sensors report normal traffic, the currently running event should be ended
after a threshold time.
Figure 3.3: Processing Engine Architecture
• Congestion alert should be sent if a work zone event is in STOP condition for more than the
threshold time.
• Clearance alert should be sent for all congestion alerts, once the work zone event is ended.
The analysis module sends the sensor reports on work zones. The Algorithm first fetches work
zone event that is associated with this sensor. If the sensor reports a congestion then a new work
zone event will be created or the existing event will be updated. Similarly, if sensor reports normal
condition, then the work zone will be verified to end any running event.
Every time, a new work zone event is created, the event will be added to a alertQueue. An
alert scheduler runs for every one minute and checks thealertQueue for persisted stopped events.
All such events will be handed over to SMS handlers and will be added toclearanceQueue.
A clearance scheduler also runs for every one minute and verifies the events inclearanceQueue.
If the events in clearanceQueue becomes normal, that will be forwarded to the SMS module to
Algorithm 1:generate work zone events(S) Input: S = Sensor Event
1 function generateWorkzoneEvents(S):
2 wze← get current running work zone event 3 if wze is null then
4 if S is either SLOW or ST OP then
5 Create new work zone event and add this sensor event S
6 Add work zone event toalertEventQueue
7 end
8 else
9 S0← latest sensor event from wze 10 if S’ is null then
11 Add S towze ifS is either SLOW or STOP
12 else
13 if S is NORMAL then
14 End S0 and stop wzeif no sensor event running.
15 else
16 UpdateS0 withS
17 end
18 end
19 end
Algorithm 2:congestion alert scheduler()
1 function congestionAlertScheduler():
/* Runs every minute */
2 wze← Get status of all work zones inalertEventQueue
3 wzs← Filterwze with events in stopped state and running for more than threshold time. 4 trigger congestion alerts on wzs
5 add wzs toclearanceEventQueue
6 remove wzs from alertEventQueue
Algorithm 3:clearance alert scheduler()
1 function clearanceAlertScheduler():
/* Runs every minute */
2 wze← Get status of all work zones inclearanceEventQueue
3 wzs← Filterwze with events in normal state for more than threshold time. 4 trigger clearance alerts on wzs
Text Alert Processing
Once the alerts are triggered by the schedulers, the event information will be handed over to SMS
handlers. For congestion alerts, SMS handler prepares the text content by calculating the minimum
of all sensor reported average speeds, the range of mile marks where congestion is detected, and
the start time of the congestion occurrence. For clearance alerts, it calculates the duration of the
congestion. Apart from the text content, it finds the closest camera from the configuration and
reads the latest snap from the camera inventory.
Using the configuration settings, we identify the valid recipients for the particular work zone.
We used Twilio SMS gateway service to distribute the MMS to the cell phones. We post recipient
numbers, text content, and image to the Twilio HTTP web service, and Twilio sends the MMS to
the recipient cell phones.
Alert Feed API
Reactor Feeds server provides a data feed API that gives the real-time work zone congestion (7).
The feed gives all SLOW and STOP conditions occurring in the work zones, with average speeds
and the mile mark ranges. The data gets updated for every 20 seconds. The Traffic Management
Center(TMC) uses this API to display the work zone bottlenecks.
3.2.4 Console Application
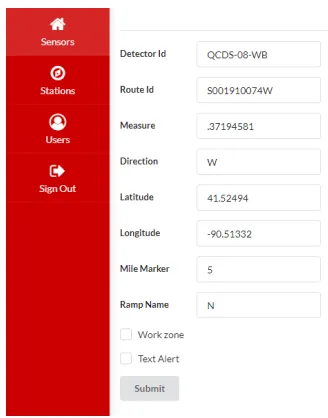
It is an important use case to send work zone alerts to only the people who are monitoring or
maintaining that work zone. The application should also work without a restart on dynamic changes
with the recipient details, like adding/modifying the recipient details. The console application solves
these problems. In the console application, an administrator can log on to the system and modify
the recipient details. The application also enables the admin to flag the sensors as part of work
(a) Adding an user
[image:22.612.338.502.105.314.2](b) Modifying sensor details
Figure 3.5: Console App
3.2.5 Sensor Quality Assurance
It is critical for the application to send reliable and accurate congestion data to the users.
As part of testing, it is identified that some sensors stop working before DOT identifies them as
inoperable sensors. In order to reduce the false positive rates, the system sends internal text alerts
CHAPTER 4. Results
The software was launched in early June 2017 to monitor 70 Wavetronix sensors in 26 work
zone sites throughout Iowa. From then, the application has been sending text alert message to the
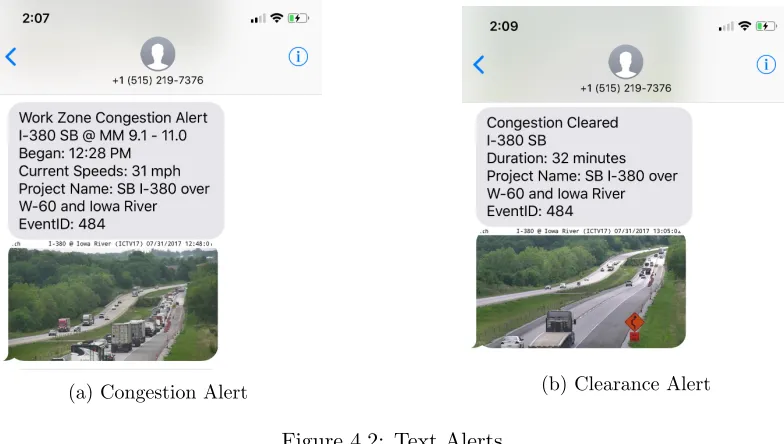
DOT traffic engineers to keep them updated with the work zone congestion. Figures 4.1a, 4.1b
shows the congestion and clearance alerts distributed to cell phones for I-380 work zone project on
July 31, 2017.
[image:23.612.110.275.309.510.2](a) Congestion Alert (b) Clearance Alert
Figure 4.2: Text Alerts
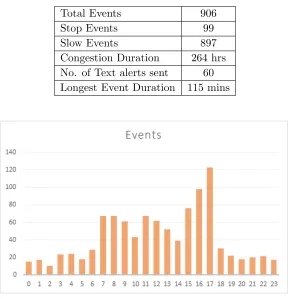
The software has generated 906 work zone events and sent 60 sever congestion alerts to the
traffic engineers in 2017. The work zone event statistics can be seen in Table 4.1.
[image:23.612.110.502.310.532.2]Table 4.1: Work zone events statistics
Total Events 906
Stop Events 99
Slow Events 897
Congestion Duration 264 hrs No. of Text alerts sent 60 Longest Event Duration 115 mins
[image:24.612.143.467.494.678.2]Figure 4.3: Congestion distribution over time
CHAPTER 5. Impact and Future Scope
Multiple research questions can be pursued after introducing this system. A survey can be
conducted to identify the field engineers opinion on text alerts. Several new research questions can
be studied using the work zone events, like a study on congestion frequencies and the work zone
locations. Future work zone management can be planned efficiently using different work zone event
parameters.
The application can be further improved by introducing new data feeds into the system. For
example, a combination of INRIX, and Waze data provides great insights into the existing sensor
data. Adding a live video analysis can improve the reliability of the system. The system can also
CHAPTER 6. Conclusion
The work zone constructions are required to improve the aging infrastructure and to build new
routes. Work zone activities happen often on already congested roads and lead more congestion.
The Traffic Management Center(TMC) manages the work zones to reduce the congestion and
harmonizes the traffic flow. It is important to keep the traffic engineers abreast of congestion
statuses on work zones.
In this work, we have developed a software to immediately notify the engineers on severe traffic
congestion. The inclusion of the camera images, average speeds, and the queue lengths carries
better understanding of the situation and help the engineers to take quick decisions. We developed
data feed APIs to provide real-time work zone bottlenecks thorough out Iowa. The use of work
REFERENCES
[1] FHWA work zone mobility facts https://ops.fhwa.dot.gov/wz/resources/facts_stats/
mobility.htm
[2] J. Dan Turner (1999) https://www.fhwa.dot.gov/publications/publicroads/99mayjun/
workzone.cfm
[3] FHWA work zone safety statistics https://ops.fhwa.dot.gov/wz/resources/facts_
stats/safety.htm
[4] Shefang Wang, Anuj Sharma, Skylar Knickerbocker(2018) Analyzing and Improving the
Per-formance of Dynamic Message Sign Reporting Work ZoneRelated Congestion Transportation
Research Record: Journal of the Transportation Research Board
https://doi.org/10.3141/2617-09
[5] Vamsi Krishna J, Skylar Knickerbocker(2018) Open Data Service User Manual https:
//iastate.app.box.com/s/wmsik1f0ygg3hn6a8xw5txe61vxdjuqt
[6] Sensor Feed Documentation http://reactorfeeds.org/docs/feeds/sensorfeed