© Author(s) 2010. This work is distributed under the Creative Commons Attribution 3.0 License.
Short term changes of microbial processes in Icelandic soils to
increasing temperatures
R. Guicharnaud1,2,3, O. Arnalds2, and G. I. Paton3
1Agricultural University of Iceland, Department of Land Resources, Iceland 2Agricultural University of Iceland, Department of Environmental Sciences, Iceland
3Institute of Biological and Environmental Sciences, Cruickshank Building, University of Aberdeen, St. Machar Drive, Aberdeen AB24 3UU, UK
Received: 26 May 2009 – Published in Biogeosciences Discuss.: 9 July 2009
Revised: 15 December 2009 – Accepted: 29 January 2010 – Published: 17 February 2010
Abstract. Temperature change is acknowledged to have a
significant effect on soil biological processes and the corre-sponding sequestration of carbon and cycling of nutrients. Soils at high latitudes are likely to be particularly impacted by increases in temperature. Icelandic soils experience un-usually frequent freeze and thaw cycles compare to other Arctic regions, which are increasing due to a warming cli-mate. As a consequence these soils are frequently affected by short term temperature fluctuations.
In this study, the short term response of a range of soil microbial parameters (respiration, nutrient availability, mi-crobial biomass carbon, arylphosphatase and dehydrogenase activity) to temperature changes was measured in sub-arctic soils collected from across Iceland. Sample sites reflected two soil temperature regimes (cryic and frigid) and two land uses (pasture and arable). The soils were sampled from the field frozen, equilibrated at−20◦C and then incubated for two weeks at−10◦C,−2◦C, +2◦C and +10◦. Respiration and enzymatic activity were temperature dependent. The soil temperature regime affected the soil microbial biomass car-bon sensitivity to temperatures. When soils where sampled from the cryic temperature regime a decreasing soil micro-bial biomass was detected when temperatures rose above the freezing point. Frigid soils, sampled from milder climatic conditions, where unaffected by difference in temperatures. Nitrogen mineralisation did not change with temperature. At
−10◦C, dissolved organic carbon accounted for 88% of the
fraction of labile carbon which was significantly greater than that recorded at +10◦C when dissolved organic carbon
ac-counted for as low as 42% of the labile carbon fraction.
Correspondence to: R. Guicharnaud
1 Introduction
The Arctic contains about 11% of global soil organic mat-ter (SOM) (Schimel and Mikan, 2005) while those areas re-ferred to as “high-latitude ecosystems” may contain as much as 60% of global SOM (Hobbie et al., 2000). High lati-tude regions are experiencing the most significant impacts of climate changes (Serreze et al., 2000; Schimel and Mikan, 2005) and this could result in the release of SOM in the fu-ture. It is acknowledged that the soil microbial biomass is active during sub-zero temperatures in winter months (e.g., Clein and Schimel, 1995; Mikan et al., 2002; Schimel and Mikan, 2005) because soil particles maintain liquid water films at temperatures down to −10◦C (Price and Sowers,
2004). Until now, most research has focussed on the high arctic environments (e.g., Mikan et al., 2002; Schimel and Mikan, 2005; Edwards et al., 2006) and the taiga (e.g., Schimel and Clein, 1996; Rodionow et al., 2006) where soils, impacted by permafrost, have limited pedological develop-ment. There has been little consideration of more mature soils or those at the margins of agricultural latitudes.
sensitivity of rapidly depleted labile substrate pools (Boone et al., 1998; Reichstein et al., 2000). Furthermore mineral transformations in long term experiments may exaggerate measured microbial responses and experimental sensitivity may be compromised (Mikan et al., 2002). Short term in-cubations have been recommended for overcoming such ef-fects (Boone et al., 1998; Reichstein et al., 2000; Mikan et al., 2002). Studying short term temperature changes are like-wise believed to be worthy of consideration as they can give early indication of the impact of climate change on soil C dynamics (Boddy et al., 2008; Belay-Tedla et al., 2009).
Iceland lies between 63 and 67◦N and has a landmass of 103 000 km2. The climate is sub-arctic in the lowlands but arctic at higher elevations and the resultant soils are de-scribed as forming in cryic and frigid zones (Arnalds and Kimble, 2001). In Iceland, permafrost, is not wide spread, being found in isolated areas in the interior (Thorhallsdot-tir, 1997). All soils, however, are exposed to annual freezing cycles between November and May. Iceland has the most ex-tensive area of Andosols (volcanic soils) in Europe (Arnalds, 2004) and these soils have a propensity for high organic carbon and nitrogen sequestration (Palmason et al., 1996; Gudmundsson et al., 2004). Icelandic soils are estimated to store up to 2.1×10⁹t of soil organic carbon (Oskarsson et al., 2004). Despite the relative harshness of the Icelandic cli-mate, these soils are highly fertile although the need for land drainage makes effective soil management a considerable un-dertaking. The soils of Iceland experience unusually frequent freeze and thaw cycles, more than any other sub-arctic region (Orradottir 2002; Orradottir et al., 2008). Freeze and thaw cycles make decomposition processes in cold regions com-plex due to persistent microbial activity at low temperatures, interaction of the quality and supply of substrates as well as microclimate limitation to soil respiration (Barret et al., 2006). Temperature changes in the short term during freeze and thaw periods are likely to affect the cycling of carbon by microorganisms in Icelandic soils.
While there is a broad understanding of the physical and chemical attributes of Icelandic soils (Arnalds, 2004), there have been few biological investigations. Most soil studies have focussed on agronomical aspects and Gudmundsson et al. (2004) highlighted the inherent N limitation in these soils. Gudmundsson et al. (2004) and Ritter (2007) have postulated that these soils are associated with very significant N immo-bilization, but these observations have not been accompanied with empirical biological evidence.
Many techniques are available to study microbial com-munity, size, activity and function in soils. In the case of this study a brief justification of selected methods can be made. The soil microbial biomass utilises the labile fraction of soil organic matter, transforming and cycling organic mat-ter within the soil. Enzyme activities reflect the metabolic activity of key soil processes thus reflecting the responsive-ness of the soil microbial biomass (micc)(Gianfreda et al., 2005). Soil respiration (Cmin)is a measure of heterotrophic
activity of the microbial biomass (Dawson et al., 2007). KCl extractable NH+4 and NO−3 has been interpreted as a measure of soil exchangeable N (Bremner, 1965) and has frequently been used for estimating the net N mineralization, nitrifica-tion and ammonificanitrifica-tions rates (Raison et al., 1987). While various assays have been developed for the measurement of net Nmin(Curtin and McCallum, 2004), workers have consid-ered that the difference in initial versus final concentration of mineral N (NO−3 and NH+4)can offer an adequate estimation of total Nmin(Raison et al., 1987; Miller et al., 2007).
Such diverse measurements of soil microbial parameters require a degree of integration to place the measured values in a context. The widely adopted Q10 value is the factor by which a 10◦C increase in temperature will increase the measured physiological response. The respiration coefficient Q10 is commonly used as an index of temperature depen-dence (Mikan et al., 2002). The metabolic quotient (qCO2) of the soil micro-flora (Odum, 1969) describes the ratio of respired C to assimilated biomass C and provides a compar-ative evaluation of the physiological condition of the soil mi-crobial community. The soilqCO2has been used as an in-dicator of stress as soil microorganisms divert more energy from growth into maintenance as stress increases (Killham, 1985). Anderson and Domsch (1993) used theqCO2while making an assessment of the effect of temperature on soil.
The primary aim of this study was to assess the short term response of soil microbial processes and nutrients dynamics in Icelandic soils to changes in temperatures. The effect of different land use and soil temperature regimes was further-more studied by sampling soils from three treatment plots, grass, barley and controls located in both cryic and frigid soil temperature regimes. Soil microbial processes where stud-ied by subjecting soils to temperatures both below and above the freezing point and measuring the total microbial biomass carbon, dissolved organic carbon, respiration, enzymatic ac-tivity and N mineralisation.
2 Methods
2.1 Sample preparation and selected soil measurements
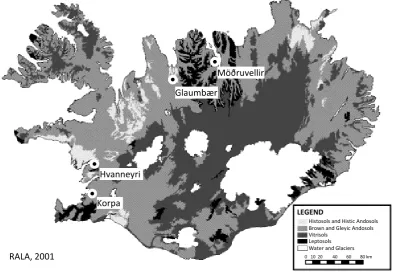
Brown and Gleyic Andosols Vitrisols
Water and Glaciers Leptosols
Histosols and Histic Andosols
0 10 20 40 60 80 km
Glaumbær
Möðruvellir
Hvanneyri
Korpa
RALA, 2001
[image:3.595.101.495.67.340.2]LEGEND
Fig. 1. A simplified soil map of Iceland with sampling locations (Modified from Arnalds and Gretarsson, 2001).
transport to Aberdeen, Scotland, where all preparatory work was conducted in a cooled laboratory. Field capacity was determined on thawed sub-samples as described by Kassel and Nielsen (1986). The eight replicate cores were hand mixed and bulked and sieved through a 3.75 mm sieve (dis-carding vegetative materials). All sample preparation was conducted in a cool room at +5◦C to minimise biological ac-tivity. Before all replicate subsamples were placed in incuba-tors, soils where weighted for each measurement to be con-ducted in individual containers making them ready for ex-tractions and analyses as soon as incubations ended. This al-lowed minimum disruption of soil microstructures after tem-perature treatments. Thereafter soils were frozen at−20◦C
(Schimel and Mikan 2005, Clein and Schimel, 1995) for two weeks (Mikan et al., 2002). After this two week period, the soils were transferred to the four separate incubators for 2 weeks at−10◦C, −2◦C, +2◦C or +10◦C. The soils were maintained at ambient moisture content (Schimel and Mikan, 2005) which ranged from 38–59% of field capacity. These values have been reported to be optimal for soils with Andic properties (Dahlgren et al., 2004). Subsamples were taken for routine analysis (bulk density (BD), organic C, N and pH (Blakemore et al., 1987).
2.2 Microbial biomass C (micc)
Soil microbial biomass carbon (micc) was determined by chloroform fumigation (Vance et al., 1987) on all soils and
treatment temperatures after the 2 week incubation. Before incubations soils where weighted into 50 ml centrifuge bot-tles making them ready for extraction as soon as incubations ended. Soils were placed frozen in desiccators and were al-lowed to thaw during the 24 h chloroform fumigation. Non-fumigated samples were extracted immediately with 25 ml 0.5 M K2SO4. Dissolved organic carbon (DOC) was anal-ysed by an aqueous carbon analyser (LABTOC Pollution and Process Monitoring) with UV digestion and infra-red detec-tor. The KECfactor used was 0.45 (Vance et al., 1987). The 0.5 M K2SO4extractable DOC from un-fumigated soils sam-ples was used to characterize the labile carbon pool of these soils.
2.3 Soil respiration (Cmin)
Soil respiration was conducted as described by Dawson et al. (2007) by accurately weighing 1 g of field moist soil into 9 ml vacuettes before incubations. Triplicate destructive sam-ples were maintained at−20◦C for two weeks. Thereafter
samples were removed from−20◦C to 4 different
TheQ10 value was calculated as a respiration coefficient based on cumulative CO2release over two weeks with a stan-dard exponential rate equation over the defined temperature interval (van’t Hoff, 1898):
Q10 =e(10·(ln(R2/R1)/(T2−T1))) (1) whereR1andR2are respiration rates at temperaturesT1and T2respectively. TheqCO2value was calculated by dividing the cumulative CO2respired (µg CO2-C g−OC1)by the micro-bial biomass C (expressed as µg-C g−OC1; Odum, 1969).
2.4 Enzymatic activity measurements
Dehydrogenase activity was measured according to a modi-fied method by Trevors (1984) at all temperatures except at
−10◦C (reagents remained frozen). Prior to incubations, 1 g of field moist soil was placed into sterile darkened Universal bottles. Universal bottles with soil were placed in incuba-tor at−20◦C for two weeks. After the two week incuba-tion at −20◦C Universial bottles were placed in 4 incuba-tors at the four experimental temperatures (−10◦C,−2◦C, +2◦C and +10◦C) for two weeks. After the 2 week incuba-tion , 10 ml 0.1 M iodonitetrazolium chloride (with 0.5 M N-tris (hydroxymethyl) methyl 1–2 aminoethane-sulfonic acid (TES), adjusted to pH 7.8 with 5 M NaOH) and placed on an end-over shaker for 18 h in incubators at, −10◦C,−2◦C,
+2◦C and +10◦C. At−10◦C however, the added 10 ml of
0.1 M iodonitetrazolium chloride solution froze so dehydro-genase activity was not measured at that particular tempera-ture. Thereafter 10 ml of ethanol were added and the solution centrifuged at 2750G for 20 min. Samples were analyzed at 490 nm on a spectrometer (Cecil Instruments CE373) and quantified against a linear calibration for iodonitetrazolium formazan (INTF).
Arylphosphatase activity was measured according to Tabatabai and Bremner (1969) at all incubation tempera-tures except −10◦C. Prior to incubations, 1 g of soil was placed in Universal bottles and incubated at −20◦C for two weeks. Thereafter bottles were placed in three incu-bators at−2◦C, +2◦C, and +10◦C for another two weeks. After the two week incubation at −2◦C, +2◦C, +10◦C, 4 ml de-ionized water, 0.25 ml toluene and 1 ml 0.015 M p-nitrophenyl phosphate (substrate) was added to each bottle. Thereafter bottles were sealed with glass marbles and incu-bated at 37◦C for 1 h, after which 1 ml 0.5 M CaCl2and 4 ml 0.5 M NaOH was added, samples were sealed with rubber bungs and then shaken for 30 s prior to filtration (Whatman No 1). Absorbance was measured at 400 nm (Cecil Instru-ments CE373) and concentrations were determined against a linear calibration usingp-nitrophenol.
TheQ10 coefficient was calculated as activity coefficient for dehydrogenase and arylphosphatase activities for assess-ing both enzymes temperature dependence. Calculations Q10 coefficients were based on van’t Hoff (1898) wereR1
andR2corresponded to enzyme activities at temperaturesT1 andT2respectively (Q10=e(10×(ln(R2/R1)/(T2−T1)))). 2.5 Extractable mineral N as an estimation of N
mineralization (Nmin)
Measurement of the extractable NH+4-N and NO−3-N were made on soils before undergoing treatments and after the two week incubation. For soils undergoing temperature treatments 5 g of field moist samples were placed in 50 ml centrifuge bottles prior to incubations at −20◦C, −10◦C,
−2◦C, +2◦C and +10◦C . After the 2 weeks incubations soil samples where shaken in an over and under shaker for 2 h with 25 ml 2 M KCl solution, and then filtered through Whatman No 42 filter paper before quantification on a flow injection analyzer (FIAstar 5010 analyzer). All soils were extracted immediately after removal from incubators.
2.6 Data analysis
Statistical analyses were conducted using SAS 9.1 for Win-dows 2002–2003. After normality testing, One Way ANOVA was performed to test for significant differences between measured soil parameters, landuse systems and tempera-ture treatments. All levels of significance are expressed as p≤0.05.
3 Results
3.1 Selected soil measurements
Soil temperature regimes and properties are summarised in Table 1. The pH values of all soils ranged from 4.3 to 6.8. BD ranged from 0.2 to 0.5 g/cm3, soil total C from 5.1 to 25%, soil total N from 0.5 to 1.3% and soil C:N ratio from 10.2 to 14.4. There was no general relationship between measured soil properties and soil temperature regimes (Table 1).
3.2 Microbial Biomass C (micc)
For individual soils, there was no significant difference be-tween miccat each treatment temperature for soils sampled from the frigid temperature regime (Hv and Kor). Soils sam-pled from the cryic temperature regime (Gl and Mo) had a significantly higher micc at sub-zero temperatures with an abrupt decrease as temperature rose. Generally micc values did not differ significantly between treatment plots indepen-dent of soil temperature regime (Fig. 2).
3.3 Respiration (Cmin) and DOC
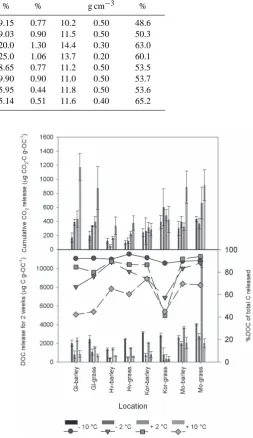
Table 1. Selected soil properties and temperature regimes for all soils, land use and temperature regime. Ctotdenotes soil total organic carbon, Ntotdenotes soil total organic nitrogen and BD denotes soil bulk density.
Soil temperature Land use pH Ctotal Ntotal C:N BD Moisture
regime H2O % % g cm−3 %
GLcryic Barley 6.6 9.15 0.77 10.2 0.50 48.6
GLcryic Grass 6.4 9.03 0.90 11.5 0.50 50.3
Hvfrigid Barley 4.5 20.0 1.30 14.4 0.30 63.0
Hvfrigid Grass 4.3 25.0 1.06 13.7 0.20 60.1
Korfrigid Barley 5.4 8.65 0.77 11.2 0.50 53.5
Korfrigid Grass 5.9 9.90 0.90 11.0 0.50 53.7
Möcryic Barley 6.4 5.95 0.44 11.8 0.50 53.6
[image:5.595.48.304.110.463.2]Möcryic Grass 7.0 5.14 0.51 11.6 0.40 65.2
Fig. 2. Microbial biomass for all soils, land use systems and soil temperature regime after 2 weeks incubations at −10◦C, −2◦C, +2◦C and +10◦C. Columns represent mean±1 SE (n=3). Gl=Glaumbær, Hv=Hvanneyri, Kor=Korpa, Mo=Möðruvellir.
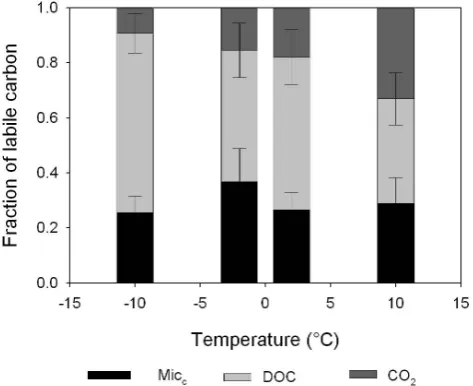
at +10◦C (Fig. 3). Moreover, DOC accounted for 88–96% of total C release (respiration + DOC) for both land uses (bar-ley and grass) and temperature regimes (Fig. 3) at−10◦C and 42–74% of total C release at +10◦C.
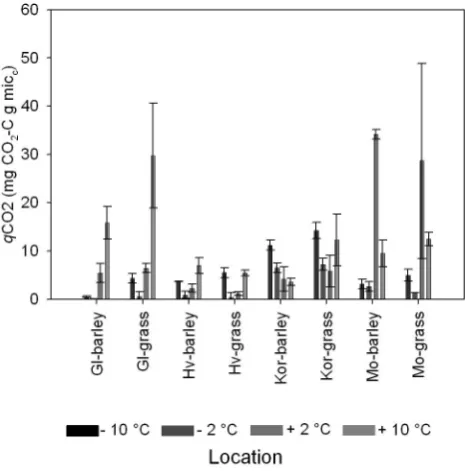
Metabolic quotients (qCO2values) for all soils (barley and grass) at all temperature treatments are shown in Fig. 4. Gen-erally temperature did not affect theqCO2 values with no significant differences being detected between temperature andqCO2values.
[image:5.595.292.546.113.552.2]Overall, respirationQ10 values differed significantly be-tween temperature intervals. There was no trend bebe-tween highest and lowest Q10 values for temperature treatments. On most occasions the highest or lowestQ10values for each soil were detected at the temperature range between−2 to +2◦C (Table 2). There was not a significant difference be-tweenQ10 values and soil temperature regime or land use (grass and barley). CalculatedQ10 values for Cminrevealed that soils had lowest temperature dependencies at the cold-est temperatures (−10 to−2◦C) with mean Q10 values of 1.14. Q10 values between−2 to +2◦C had a mean value of 4, although meanQ10values were calculated to be between 1 and 2 with the exception of Hvfrigidbarley with a value of 17.5 (Table 2). Temperature dependencies in the range of +2 to +10◦C were not significant with a meanQ10values being on average 2.16.
3.4 Enzymatic measurements
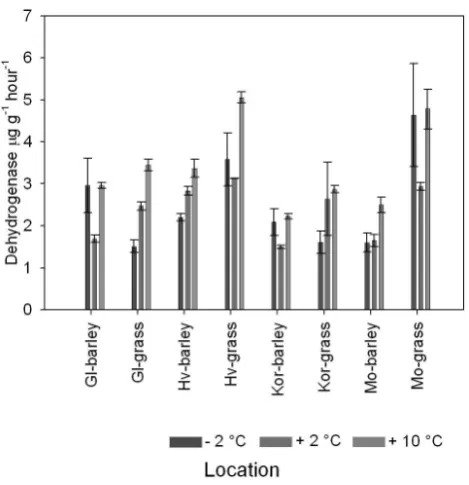
For dehydrogenase activity, highest values were measured at +10◦C in all soils (Figs. 5 and 6). In general, the lowest activity was measured at the lowest temperature, although in four soils (Glcryic barley, Hvfrigid grass Korfrigid barley and Mocryicgrass) activity was significantly higher at−2◦C than at +2◦C (Fig. 5).
Q10 values differed significantly between temperature in-tervals and were generally highest at +2 to +10◦C (Table 2).
There was no trend betweenQ10values and soil temperature regime or land use (Table 2).
Arylphosphatase activity was generally highest at +10◦C and lowest at−2◦C (Fig. 6). There was a significant differ-ence in arylphosphatase activity at−2◦C compared to +2◦C but not in the range of +2◦C to +10◦C (Table 2). Arylphos-phatase activity did not differ significantly between land use. The arylphosphatase activity quotientQ10differed signif-icantly between temperature ranges (−2 to +2◦C and +2 to 10◦C). TheQ10was higher in the−2◦C to +2◦C range (ex-cept for Glcryicbarley and Mocryicbarley) compared toQ10 values in the +2◦C to +10◦C range (Table 2). This is con-trary toQ10 values for dehydrogenase activity, which were generally higher at the +2 to +10◦C temperature range.
3.5 Extractable mineral N as an estimation of N immobilisation, nitrification and mineralization (Nmin)
[image:6.595.311.544.63.299.2]For each soil (except for Korfrigid–grass), regardless of land use or soil temperature regime (cryic and frigid), net NH+4-N immobilisation was the dominant process when temperatures were above zero (Fig. 7a). Where net ammonification (NH+4 -N production) was occurring, this was recorded at sub-zero temperatures (Fig. 7a). In Glcryicbarley and grass soils, net ammonification occurred at−2 and−10◦C (Glcryicbarley) and−10◦C (Glcryic grass) respectively. In Korfrigid barley
Fig. 4. qCO2 for all soils, land use systems and soil tempera-ture regime after 2 weeks incubation at−10◦C,−2◦C, +2◦C and +10◦C. Columns represent mean±1 SE (n=3). Gl=Glaumbær, Hv=Hvanneyri, Kor=Korpa, Mo=Möðruvellir.
and grass soils, net ammonification was occurring at−2◦C and−10◦C and−2◦C respectively (Fig. 7a).
Net nitrification (NO−3-N production) was site specific and independent of soil temperature regime or land use (Fig. 7b). For both Glcryicand Korfrigid soil net nitrification was the dominant process at all temperatures with the excep-tion of Glcryic grass which had net NO−3-N immobilisation at−10◦C and−2◦C. Net NO−3-N immobilisation was the dominant process in Hvfrigid and Mocryic soils. Glcryic bar-ley and grass had net nitrification at−10◦C and−2◦C and
−10◦C respectively.
Net N-mineralisation (NH+4-N + NO−3-N), was also site specific (Fig. 7c) with no relationship with soil regime, lan-duse or incubation temperature. No significant relationships where detected between site specific characteristics like Ctot, Ntot, C:N and soil pH.
4 Discussion
Table 2. Q10 values for cumulative Cmin for the temperature ranges of−10◦C to−2◦C,−2◦C to +2◦C and +2◦C to +10◦C and dehydrogenase and arylphosphatase activity two weeks of incubation at the temperature ranges of−2◦C to +2◦C and +2◦C to +10◦C.Q10 values are means of 3 replicates (n=3).
Soil location Comulative CO2 Dehydrogenase Phosphatase
and treatment −10 to−2◦C −2 to +2◦C +2 to +10◦C −2 to +2◦C +2 to +10◦C −2 to +2◦C +2 to +10◦C
Gl-barley,cryic 2.8 1.3 3.5 0.2 2.0 0.3 2.0
Gl-grass,cryic 1.9 1.5 2.7 3.4 1.5 1.6 1.1
Hv-barley,frigid 0.3 17.5 2.5 1.9 1.2 219 0.4
Hv-grass,frigid 1.3 4.6 1.9 0.7 1.8 11.9 0.6
Kor-barley,frigid 1.1 1.6 0.9 0.4 1.6 46.3 1.2
Kor-grass,frigid 1.7 0.6 0.8 3.4 1.1 647 1.2
Mo-barley,cryic 1.4 0.6 3.5 1.1 1.7 0.1 1.3
Mo-grass,cryic 0.8 4.3 1.5 0.3 1.8 12.1 1.3
Fig. 5. Dehydrogenase activity for all soils, land use sys-tems and soil temperature regime after 2 weeks incubation at −2◦C, +2◦C and +10◦C. Columns represent mean±1 SE (n=3). Gl=Glaumbær, Hv=Hvanneyri, Kor=Korpa, Mo=Möðruvellir.
but frequent. This is likely to be the case in Iceland where temperatures within cultivated soils rarely drop below−5◦C
[image:7.595.51.286.266.509.2]in lowland agricultural soils (The Icelandic Meteorological Office, unpublished observations). During such tempera-ture fluctuations, microorganisms associated with the micc could readily assimilate substrates in the soil which would in turn enhance activity (Schimel and Clein, 1996; Lipson et al., 2000). Soils sampled from the cryic temperature regime showed on the other hand a different behaviour with an abrupt decline in miccat above zero (+2◦C and +10◦C) (Fig. 2). Such results have been reported in the literature.
Fig. 6. Arylphosphatase activity for all soils, land use sys-tems and soil temperature regime after 2 weeks incubation at −2◦C, +2◦C and +10◦C. Columns represent mean±1 SE (n=3). Gl=Glaumbær, Hv=Hvanneyri, Kor=Korpa, Mo=Möðruvellir.
[image:7.595.311.546.269.499.2]Fig. 7. Net Ammonification, nitrification and Nmin for all soils, land use systems and soil temperature regime after 2 weeks incu-bation at−10◦C,−2◦C, +2◦C and +10◦C. Columns represent mean±1 SE (n=3). Gl=Glaumbær, Hv=Hvanneyri, Kor=Korpa, Mo=Möðruvellir.
there a correlation with micc. Edwards et al. (2006) simi-larly reported a decreasing miccwith rising temperatures dur-ing field measurements. Edwards et al. (2006) argued that a higher micc during colder temperatures was the result of lower microbial activity slowing down turnover rates. In this study lowest Cminrates and enzymatic activity was measured at−10◦C and highest at +10◦C (Fig. 3 and Fig. 8). Another theory was presented by Lipson et al. (2000), which stated that although higher latitudes soil miccwas resistant to
fluc-tuations around 0◦C the winter microbial community was
sensitive to soil temperatures that remained above the freez-ing point. This is likely to have been the case with cryic soils from this study.
Measurements of Cmin(cumulative CO2over 2 weeks at −10◦C,−2◦C, +2◦C and +10◦C) increased with warming reflecting temperature dependent soil heterotrophic activity (Fig. 3). Measurable Cminat sub-zero temperatures has been widely reported in high arctic, arctic and sub-arctic soils and has mostly been attributed to unfrozen water films around soil particle. These are sufficient to maintain microbial ac-tivities even at low temperatures (e.g. Coxon and Parkinson 1987; Clein and Schimel 1995; Brooks et al., 1997; Mikan et al., 2002; Miller et al., 2007).Q10values from soil tempera-ture regimes of this study were comparable withQ10 values from sub-alpine organic soils (Q10, 2.5) (Reichstein et al., 2000), alpine soils (Q10,2.5 to 3.8) (Fierer et al., 2006) and
sub-Antartic soils (Q10, 1.8 to 2.5) (Smith, 2003), but gener-ally lower than Arctic tundra soils (Q10,4.6 to 9.4) (Mikan
et al., 2002). Although calculatedQ10values were highest in the range of−2◦C to +2◦C,Q10values in this study could not be related specifically to temperature treatment, soil tem-perature regime or landuse. Leifeld and Fuhrer (2005) found a negative relationship between Q10 values and CO2 pro-duction when studying the temperature response of differ-ent soil fractions during a long term incubation experimdiffer-ent (707 days) and suggested that such a relationship was due to higher temperature sensitivity of lower SOM quality. No such relationship was found in this current study likely due to the fact that this was a short term experiment only measur-ing the labile fraction of the soil C as less than 1% of SOM was respired during the two week experiment. Connent et al., (2008) investigated the relationship between organic matter lability and temperature sensitivity and assumed that when 9–10% of the initial C had respired this was representative of the recalcitrant organic matter pool. This confirms the com-plexity of the soil environment when trying to draw conclu-sions from single measurements but it also highlights that nutrient cycling is maintained in cold environments (Koch et al., 2007). This is further confirmed when theqCO2values are considered as this could suggest that the microbial stress in relation to growth and maintenance was independent of the treatments (Killham, 1985).
Fig. 8. Fractions of labile carbon for all soils, land use systems and soil temperature regime after 2 weeks incubation at−10◦C,−2◦C, +2◦C and +10◦C. Columns represent mean±1 SE (n=3).
that dehydrogenase activity was less temperature depen-dent within that range as previously reported (Browman and Tabatabai, 1978; Tabatabai, 1982).
Arylphosphatase activity has also been measured at sub-zero temperatures (Bremner and Zantua, 1975). The great-est arylphosphatase increase was observed between−2◦C to
+2◦C rather than from +2◦C to +10◦C, which had been the
case for dehydrogenase activity. As a consequence, arylphos-phatase activity coefficients (Q10)were higher in the range −2◦C–+2◦C compared to +2–+10◦C (Table 2). Arylphos-phatase activity was more sensitive to temperature around the freezing point than dehydrogenase activity (Browman and Tabatabai 1978).
When all carbon pools, micc, DOC and Cmin have been combined (Fig. 8), a pattern is revealed. The biomass pool remains constant throughout all temperature treatments, but as temperature rises there is a commensurate rise in respira-tion because the DOC pool is being metabolised. This re-sults in lower DOC concentrations when soil respiration is highest and corresponding highest measured DOC concen-trations when respiration is lowest (Fig. 8). No difference was observed in all three carbon pools at temperatures in the range−2◦C and +2◦C (Fig. 8), hence the soils have been
conditioned to perform around these temperatures. The soils of Iceland experience unusually frequent freeze and thaw cy-cles, indeed more than any other sub-arctic region (Orradot-tir 2002). Hence it would be expected that the soils would be adapted to such critical temperatures.
At−10◦C, DOC accounted for 88% of the total measured C released (respiration + DOC), but at +10◦C this was only 65%. This response is similar to the temperature dependent observations of Miller et al. (2007) in sub-arctic soils.
Hob-bie et al. (2000) stated that cold season respiration may be mediated by DOC and that this in turn would regulate mi-crobial biomass size and activity. It has been reported that during the cold season, microbial biomass switches from processing plant detritus and SOM to relying more heavily on recycled microbial biomass and dissolved organic matter (DOM) in unfrozen water films (Schimel and Mikan, 2005; Sharma et al., 2006). These results confirm the conserva-tive microbial dynamics of such soils and highlight that DOC is a major component of C released in the coldest tempera-ture treatment (−10◦C) while CO2is the major component of C release at the highest temperature. This highlights the strong temperature dependency of DOC and the close link between soil DOC and soil microbial activity in Icelandic soils. It should though be noted that the DOC pool contains a complex mix of C compounds with some being a complex of C compounds, some of which are more labile and will cycle fast while other might be more recalcitrant (Schimel and Mikan, 2005; Boddy et al., 2008). It has also been dis-cussed that the more resistant fraction of DOC might have different temperature dependencies than the more labile frac-tion (Knorr et al., 2005; Bauer et al., 2008). Soil warming experiments have demonstrated that increased carbon efflux rates by increasing temperatures returns eventually to sim-ilar rates as before the temperature increase. This was be-lieved to demonstrate that the response pattern was not due to acclimation response of soil microorganisms but due to de-pletion of readily decomposable substrate (Davidson et al., 2000; Ågren and Bosatta, 2002; Kirschbaum, 2004; Bauer et al., 2008). This study was conducted on a short time scale (2 weeks) and measured the initial breakdown of the labile fraction of DOC and it can not be excluded that if the ex-periment would have been conducted on a larger time scale that the response pattern would have yielded different carbon efflux rates. It is however believed that availability of labile C compounds may be a major component in controlling soil respiration of high latitude systems (Boddy et al., 2008) and studying the short term response of the more labile fraction of DOC merits investigation.
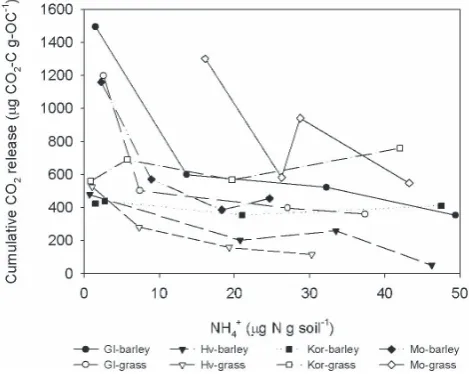
resultant NH+4 as activity per unit of microbial biomass in-creases. The resultant NH+4 –N in the soils is being utilised by the microbial biomass, and this can be seen by the close correlation between Cmin(cumulative CO2) and soil NH+4 -N concentration (Fig. 9). At the highest -NH+4-N concentra-tions, there is the lowest cumulative respiration (Cmin)while
those soils with highest microbial activity have negligible NH+4-N, suggesting the N limitation of these soils. These results are in agreement with other studies of sub-arctic soils that acknowledge that NH+4-N production is temperature de-pendent and enhanced during thawed conditions (Muller et al., 2002; Miller et al., 2007). Hobbie and Chapin (1996) suggested that N limitation in arctic soils was due to decom-posing litter during the cold season, while Weintraub and Schimel (2003) and Schimel et al. (2004) stated that these ecosystems were fundamentally N limited. These results support the findings of Palmasson et al. (1996) and Gud-mundsson et al. (2004) that N is the constraining factor in Icelandic soils. Nitrogen limitation in these soils has been at-tributed to three main factors (Ritter, 2007): Andic soil prop-erties which slow down organic N turnover, low N mineral-isation rates (Palmason et al., 1996) and low atmospheric N deposition (Ritter, 2007). Overall Nminwas not temperature dependant nor was there an association with soil tempera-ture regimes or landuse suggesting that cryic and frigid soils was likely determined by site specific aspects such as micro-bial biomass composition rather than temperature. Koch et al. (2007) and Wallenstein et al. (2008) reported that N de-grading enzymes tend to be less sensitive temperatures than C degrading enzymes displaying generally lowerQ10values. It may be further considered that Nminin Icelandic soils will be little affected with increasing temperatures in the Arctic but rather controlled by soil microbial activity and composi-tion as well as substrate form and availability (Koch et al., 2007).
The soils for this study were selected to reflect managed Icelandic land uses in different temperature regimes. It is ac-knowledged that they have a considerable carbon binding ca-pacity and the release of carbon from these environments as a consequence of climate change could have significant global impacts. While these soils may have evolved to become con-ditioned to continual freeze-thaw episodes elevated temper-atures could alter the labile C pool in the short term. Soil climatic conditions seam to have an impact on Icelandic soil miccwith soils sampled from the cryic temperature display-ing more sensitivity to increasdisplay-ing temperatures than soils ex-periencing a less harsh climate (frigid temperature regime).
5 Conclusions
Microbial biomass size from frigid temperature regimes was not affected by temperature above and below the freezing point in the short term, but the resultant activity was. By selecting a range of activity measurements a better
under-Fig. 9. Cmin(cumulative CO2release) versus ammonium for all soils, land use systems and soil temperature regime after 2 weeks incubation−10◦C,−2◦C, +2◦C and +10◦C. Columns represent mean±1 SE (n=3). Gl=Glaumbær, Hv=Hvanneyri, Kor=Korpa, Mo=Möðruvellir.
standing of the dynamics can be developed. In this study, ni-trogen dynamics seemed to reflect site specific criteria rather than temperature treatments. The response of labile carbon in these soils was governed by temperature and there is a careful balance between DOC and carbon mineralisation.
Acknowledgements. We thank the Icelandic Governmental Fund for Graduate Education and The Agricultural Productivity Fund for funding this work.
Edited by: H. Lankreijer
References
Ågren, G. I. and Bosatta, E.: Reconciling differences in predic-tions of temperature response of soil organic matter, Soil Biol. Biochem., 34, 129–132, 2002.
Anderson, T. H. and Domsch, K. H.: The metabolic quotient for CO2(qCO2) as a specific activity parameter to assess the ef-fects of environmental-conditions, such as pH, on the microbial biomass of forest soils, Soil Biol. Biochem., 25, 393–395, 1993. Arnalds, O.: Volcanic soils of Iceland, Catena 56, 3–20, 2004. Arnalds, O. and Kimble, J.: Andisols of deserts in Iceland, Soil Sci.
Soc. Am. J. 65, 1778–1786, 2001.
Barret, J. E., Virginia, R. A., Parsons, A. N., and Wall, D. H.: Soil carbon turnover in the McMurdo Dry Valleys, Antarctica, Soil Biol. Biochem., 38, 3065–3082, 2006.
[image:10.595.310.545.65.252.2]Belay-Tedla, A., Zhou, X., Su, B., Shiqiang, W., and Luo, Y.: La-bile, recalcitrant and microbial carbon and nitrogen pools of a tallgrass prairie soil in the US Great Plains subjected to experi-mental warming and clipping, Soil Biol. Biochem., 41, 110–116, 2009.
Blakemore, L. C., Searle, P. L. and Daly, B. K.: Methods of chem-ical analysis of soils, New Zealand Soil Bureau Science Report, 80, 1–103, 1987.
Boddy, E., Roberts, P., Hill, W. H., Farrar, J., and Jones, D.: Turnover of low molecular rates dissolved organic C (DOC) and microbial C exhibit different temperature sensitivities in Arctic tundra soils, Soil Biol. Biochem., 40, 1557–1566, 2008. Boone, R. D., Nadelhoffer, K. J., Canary, J. D. and Kaye, J. P.:
Roots exert a strong influence on the temperature sensitivity of soil respiration, Nature, 396, 570–572, 1998.
Bremner, J. M.: Inorganic Forms of Nitrogen, edited by: Black, C. A., American Society of Agronomy, Madison, Wisconsin, 1179– 1237, 1965.
Bremner, J. M. and Zantua, M. I.: Enzyme activity in soils at sub-zero temperatures, Soil Biol. Biochem., 7, 383–387, 1975. Brooks, P. D., Schmidt, S. K. and Williams, M. W.: Winter
produc-tion of CO2and N2O from alpine tundra: Environmental con-trols and relationship to inter-system C and N fluxes, Oecologia, 110, 403–413, 1997.
Browman, M. G. and Tabatabai, M. A.: Phosphatase activity in soils, Soil Sci. Soc. Am. J., 42, 284–290, 1978.
Clein, J. S. and Schimel, J. P.: Microbial activity of tundra and taiga soils at subzero temperatures, Soil Biol. Biochem., 27, 1231– 1234, 1995.
Connent, R. T., Drijber, R. A., Haddix, M. L., Parton, W. J., Paul., E. A., Plante, A. F., Six§, J., and Steinweg, M.: Sensi-tivity of organic matter decomposition to warming varies with its quality, Global Change Biol., 14, 868–877, doi:10.1111/j.1365-2486.2008.01541.x, 2008.
Coxon, D. S. and Parkinson, D.: Winter respiratory activity in aspen woodland forest litter and soils, Soil Biol. Biochem., 19, 49–59, 1987.
Curtin, D. and McCallum, F. M.: Biological and chemical assays to estimate nitrogen supplying power of soils with contrasting management stories, Aust. J. Soil Res., 42, 737–746, 2004. Dahlgren, R. A., Saigusa, M. and Ugolini, F. C.: The nature,
prop-erties and management of volcanic soils, Adv. Agron., 82, 113– 182, 2004.
Davidson, E. A., Trumbore, S. E., and Amundson, R.: Soil warming and organic carbon content, Nature, 408, 789–790, 2000. Dawson, J. J. C., Godsiffe, E. J., Thompson, I. P., Ralebitso-Senior,
T. K., Killham, K. S., and Paton, G. I.: Application of biological indicators to assess recovery of hydrocarbon impacted soils, Soil Biol. Biochem., 39, 164–177, 2007.
Edwards, K. A., McCulloch, J., Kershaw, G. P., and Jefferies, R. L.: Soil microbial and nutrient dynamics in a wet arctic sedge meadow in late winter and early spring, Soil Biol. Biochem., 38, 2843–2851, 2006.
Fierer, N., Colman, B. P., Schimel, J. P. and Jackson, R. B.: Pre-dicting the temperature dependence of microbial respiration in soil: A continental scale analyses, Global Biogeochem. Cy., 20, GB3026, doi:10.1029/2005GB002644, 2006.
Gianfreda, L., Rao, M. A., Piotrowska, A., Palumbo, G., and Colombo, C.: Soil enzyme activities as affected by
anthro-pogenic alterations: Intensive agricultural practices and organic pollution, Sci. Total Environ., 341, 265–279, 2005.
Gudmundsson, T., Bjornsson, H., and Thorvaldsson, G.: Organic carbon accumulation and pH changes in an andic Gleysol under a long-term fertilizer experiment in Iceland, Catena, 56, 213–224, 2004.
Hobbie, S. E. and Chapin, F. S.: Winter regulation of tundra litter carbon and nitrogen dynamics, Biogeochemistry, 35, 327–338, 1996.
Hobbie, S. E., Schimel, J. P., Trumbore, S. E., and Randerson, J. R.: Controls over carbon storage and turnover in high-latitude soils, Global Change Biol., 6, 196–210, 2000.
Joergensen, R. G., and Raubuch, M.: Adenylates in the soil micro-bial biomass at different temperatures, Soil Biol. Biochem., 35, 1063–1069, 2003.
Kassel, D. K. and Nielsen, D. R.: Methods of Soil Analysis, Part 1, Field Capacity and Available Water Capacity, 901–926, 1986. Killham, K.: A physiological determination of the impact of
environmental-stress on the activity of microbial biomass, En-viron. Pollut. A, 38, 283–294, 1985.
Kirschbaum, M. U. F.: Soil respiration under prolonged soil warm-ing: are rate reductions caused by acclimation or substrate loss? Glob. Change Biol., 10, 1870–1877, 2004.
Knorr, W., Prentice, I. C., House, J. I., and Holland, E. A.: Long-term sensitivity of soil carbon turnover to warming, Nature, 433, 298–301, 2005.
Koch, O., Tscherko, D., and Kandeler, E.: Temperature sensitiv-ity of microbial respiration, nitrogen mineralization, and poten-tial soil enzyme activities in organic alpine soils, Global Bio-geochem. Cy., 21, GB4017, 2007.
Leifeld, J. and Furhrer, J.: The temperature response of CO2 production from bulk soils and soil fractions is related to soil organic matter quality, Biogeochemistry, 75, 433–453, doi:10.1007/s10533-005-2237-4, 2005.
Lipson, D. A., Schmidt, S. K., and Monson, R. K.: Carbon avail-ability and temperature control the post-snowmelt decline in alpine soil microbial biomass, Soil Biol. Biochem. 32, 441–448, 2000.
Mikan, C. J., Schimel, J. P., and Doyle, A. P.: Temperature controls of microbial respiration in arctic tundra soils above and below freezing, Soil Biol. Biochem. 34, 1785–1795, 2002.
Miller, A. E., Schimel, J. P., Sickman, J. O., Meixner, T., Doyle, A. P., and Melack, J. M.: Mineralization responses at near-zero tem-peratures in three alpine soils, Biogeochemistry, 84, 233–245, 2007.
Muller, C., Martin, M., Stevens, R. J., Laughlin, R. J., Kammann, C., Ottow, J. C. G., and Jager, H. J.: Processes leading to N2O emissions in grassland soil during freezing and thawing, Soil Biol. Biochem., 34, 1325–1331, 2002.
Odum, E. P.: The strategy of ecosystem development, An under-standing of ecological succession provides a basis for resolving man’s conflict with nature, Science, 164, 262–270, 1969. Oquist, M. G., Nilsson, M., Sorensson, F., Kasimir-Klemedtsson,
A., Persson, T., Weslien, P., and Klemedtsson, L.: Nitrous oxide production in a forest soil at low temperatures – processes and environmental controls, FEMS Microbial. Ecol., 49, 371–378, 2004.
Range-lands, MS thesis, Department of Rangeland Ecology and Man-agement, Texas A&M University, Unites States, 2002.
Orradottir, B., Archer, S.R., Arnalds, O., Wilding, L.P., Thurow, T.L.: Infiltration in Icelandic Andisols: the role of vegetation and soil frost, Arct. Antarct. Alp. Res., 40, 412-421, 2008. Oskarsson, H., Arnalds, O., Gudmundsson, J., and Gudbergsson,
G.: Organic carbon in Icelandic Andosols: Geographical varia-tion and impact of erosion, Catena 56, 225–238, 2004.
Palmason, F., Thorgeirsson, H., Sigurdardottir, H., Bjornsson, H., and Arnalds, O.: Nítratlosun í jarðvegi (in icelandic), Icelandic Agricultural Sciences, 10, 185–208, 1996.
Panikov, N. S., Flanagan, P. W., Oechel, W. C., Mastepanov, M. A., and Christensen, T. R.: Microbial activity in soils frozen to below−39◦C, Soil Biol. Biochem., 38, 3520–3520, 2006. Price, P. B. and Sowers, T.: Temperature dependence of metabolic
rates for microbial growth, maintenance, and survival, Proceed-ings of the National Academy of Sciences of the United States of America, 101, 4631–4636, 2004.
Raison, R. J., Connell, M. J., and Khanna, P. K.: Methodology for studying fluxes of soil mineral-N in situ, Soil Biol. Biochem., 19, 521–530, 1987.
Reichstein, M., Bednorz, F., Broll, G., and Katterer, T.: Temper-ature dependence of carbon mineralisation: Conclusions from a long-term incubation of subalpine soil samples, Soil Biol. Biochem., 32, 947–958, 2000.
Ritter, E.: Carbon, nitrogen and phosphorus in volcanic soils fol-lowing afforestation with native birch (betula pubescens) and in-troduced larch (larix sibirica) in Iceland, Plant Soil, 295, 239– 251, 2007.
Rodionow, A., Flessa, H., Kazansky, O., and Guggenberger, G.: Organic matter composition and potential trace gas production of permafrost soils in the forest tundra in northern Siberia, Geo-derma, 135, 49–62, 2006.
Schimel, J. P., Bilbrough, C., and Welker, J. A.: Increased snow depth affects microbial activity and nitrogen mineralization in two arctic tundra communities, Soil Biol. Biochem., 36, 217– 227, 2004.
Schimel, J. P. and Clein, J. S.: Microbial response to freeze-thaw cycles in tundra and taiga soils, Soil Biol. Biochem., 28, 1061– 1066, 1996.
Schimel, J. P. and Mikan, C.: Changing microbial substrate use in arctic tundra soils through a freeze-thaw cycle, Soil Biol. Biochem., 37, 1411–1418, 2005.
Serreze, M. C., Walsh, J. E., Chapin, F. S., Osterkamp, T., Dyurg-erov, M., Romanovsky, V., Oechel, W. C., Morison, J., Zhang, T., and Barry, R. G.: Observational evidence of recent change in the northern high-latitude environment, Climatic Change, 46, 159–207, 2000.
Sharma, S., Szele, Z., Schilling, R., Munch, J. C., and Schloter, M.: Influence of freeze-thaw stress on the structure and function of microbial communities and denitrifying populations in soil, App. Environ. Microbiol., 72, 2148–2154, 2006.
Sjursen, H. S., Michelsen, A., and Holmstrup, M.: Effects of freeze-thaw cycles on microarthropods and nutrient availability in a sub-arctic soil. App. Soil Ecol., 28, 79–93, 2005.
Smith, V. R.: Soil respiration and its determinants on a sub-Antarctic island, Soil Biol. Biochem., 35, 77–91, 2003. Tabatabai, M. A.: Soil enzymes, in: Methods of Soil Analysis,
edited by: Weaver, R. W., Angel, J. S. and Bottomley, P. S., American Society of Agronomy, Madison, Wisconsin, 775–833, 1982.
Tabatabai, M. A., and Bremner, J. M.: The use of p-nitrophenyl phosphate for assay of soil phosphatase activity, Soil Biol. Biochem., 1, 301–307, 1969.
Thorhallsdottir, T. E.: Tundra Ecosystems of Iceland, in: Tundra Ecosystems of the World 3. Polar and Alpine Tundra, edited by: Wielgolaski, F. E., Elsevier, Amsterdam, 85–96, 1997.
Trevors, J. T.: Dehydrogenase-activity in soil – a comparison be-tween the INT and TTC assay, Soil Biol. Biochem., 16, 673–674, 1984.
Van’t Hoff, J. H.: Lectures on Theoretical and Physical Chem-istry, Part 1, Chemical Dynamics, Edwards Arnold, London, UK, 1898.
Vance, E. D., Brookes, P. C., and Jenkinson, D. S.: An extrac-tion method for measuring soil microbial biomass-C, Soil Biol. Biochem., 19, 703–707, 1987.
Wallenstein, M. D. and Weintraub, M. N.: Emerging tools for mea-suring and modeling the in-situ activity of soil extracellular en-zymes, Soil Biol. Biochem., 40, 2098–2006, 2008.