497
Mardiani Ulya, Sugiyanto, Hidayatullah M. Furqon. Difference in the effect of technical - physical exercise combination on the speed of 25 free meter style (crawl) reviewed from age group. Journal of Education, Health and Sport. 2019;9(5):497-507. eISNN 2391-8306. DOI http://dx.doi.org/10.5281/zenodo.3235363
http://ojs.ukw.edu.pl/index.php/johs/article/view/6965
The journal has had 7 points in Ministry of Science and Higher Education parametric evaluation. Part B item 1223 (26/01/2017). 1223 Journal of Education, Health and Sport eISSN 2391-8306 7
© The Authors 2019;
This article is published with open access at Licensee Open Journal Systems of Kazimierz Wielki University in Bydgoszcz, Poland
Open Access. This article is distributed under the terms of the Creative Commons Attribution Noncommercial License which permits any noncommercial use, distribution, and reproduction in any medium, provided the original author (s) and source are credited. This is an open access article licensed under the terms of the Creative Commons Attribution Non commercial license Share alike.
(http://creativecommons.org/licenses/by-nc-sa/4.0/) which permits unrestricted, non commercial use, distribution and reproduction in any medium, provided the work is properly cited. The authors declare that there is no conflict of interests regarding the publication of this paper.
Received: 01.03.2019. Revised: 15.03.2019. Accepted: 30.05.2019.
DIFFERENCE IN THE EFFECT OF TECHNICAL -
PHYSICAL EXERCISE COMBINATION ON THE SPEED OF
25 FREE METER STYLE (CRAWL) REVIEWED FROM AGE
GROUP
Ulya Mardiani
1, Sugiyanto
2, M. Furqon Hidayatullah
31) Master Program in Sport Science, Sebelas Maret University, Surakarta, Indonesia
2)3)Department of Sport Science, Postgraduate Program, Sebelas Maret University, Surakarta, Indonesia
[email protected]1, [email protected]2, [email protected]3
ABSTRACT
This study aims to determine: 1) Differences in the effect a combination of exercises, 2) Differences in swimming speed. 3) Effect interactions between combinations of exercises with age groups. This study used an experimental method with a factorial 2 x 2 design. The sample of the study was 270 people. Sampling in the study using random quota purposive sampling. The collection technique uses test and measurement techniques. Analysis of the data in this study includes a prerequisite test for the analysis and testing of hypotheses.
The results of this study are: (1) There is no significant effect of the combination training method on improving swimming abilities. This can be seen from the probability value of 0.116> 0.05. (2) There is no significant difference in age categories to increase swimming ability. This can be seen from the probability value of 0.142> 0.05. (3) There are interactions between combinations of exercises with age groups. This can be seen from the probability value of 0.000 <0.05. The form of interaction in the form of combination exercise 1 concludes that the increase in swimming ability of the age group 8-10 years is better than the age group 11 - 12 years with a difference in average value of 0.06560 and a probability of 0.025 <0.05. Whereas in combination with exercise 2, it was concluded that the increase in swimming ability of the 11 - 12 year age group was better than the age group 8 - 10 years with a difference in the average value of 0.12880 and probability of 0.037 <0.05.
498 INTRODUCTION
Sport is a tool to stimulate physical and spiritual growth and development.
Anatomical-anthropometric structures and their physiological functions, emotional stability
and intellectual intelligence as well as their ability to socialize with their environment are
actually superior to people who actively participate in sports activities than someone who is
not actively participating in sports activities (Renstrom & Roux 1988).
As stated by Cholik Motohir (2004: 47) explained that "sports carried out
systematically, regularly and terararh will greatly help our efforts to create a healthy lifestyle
that is healthy and of good quality. As where explained by Ichsan (1991: 80) that: "Sports
basically contain activities that are oriented to motion, their implementation depends on the
abilities and goals to be achieved by the culprit".
Swimming is one of the sports that has developed in Indonesia. This inspires the
school to participate in advancing student achievement by directing students to participate in
swimming clubs in their respective regions or by forming swimming extracurricular activities
in schools. The development of early athletes targets students through physical education. In
its development, ages 6-12 years are a group of large children, where at this age children can
begin to carry out intensive training. At this age children begin to have bodily functions that
begin to run well. At this stage, the child starts doing specialization exercises.
According to Nenggala (2006: 75) swimming is '' the best sport for sports activities,
because swimming is an activity that involves the movement of all body organs for both
physical and mental health growth in the form of endurance, ability and speed.
Referring to the book entitled Learning 100 More Swimming Drills, compiled by Blythe
Lucero (2013), the forms of technical training given are forms of exercise that function to
increase muscle strength so that it can increase freestyle swimming speed:
1. Long swim
2. Kick drills
3. Kick FR and Stoke BR
4. Invisible kick board
5. Scull and kick
6. Single arm stroke
In its development swimming exercises are not only done in the water. Currently
swimming pool exercises have been developed by providing ground physical training to
499
muscle tone, increasing the ability of body muscles is very supportive for increasing
swimming speed:
1. Burpies
2. Crabwalk
3. Crawling
4. Speed walking
5. Cherry picker
6. Jumping jack
7. Running / running
8. Plank
9. High plank
10. V Oops
11. Leg lift
12. Water kicking
Training and training in swimming needs a program that can be used as a reference or
guideline in implementing it in order to succeed as planned. The coaching factor concerns the
problem of coaching itself such as the teacher, the trainer, then the training method and
system. The success of a coach, teacher, coach, in improving students' performance, among
others, depends on the use of facilities and infrastructure and the application of the theory of
improving the physical condition of their students.
METHODOLOGY
This research was carried out in swimming associations in the Madiun Residency area
from March to April. The population in this study were all swimming athletes in swimming
associations in the Residency area of Madiun. Sampling in the study used random quota
purposive sampling with a sample of 40 female athletes, consisting of 20 athletes aged 8-10
years, 20 athletes aged 11-12 years. The research method used in this study is an
experimental method with a factorial 2 x 2 design (Brog and Gall, 1983: 685).
Data collection techniques used to obtain data in this study with test and measurement
techniques. There are two kinds of data collected, namely: 1) Age group data obtained from
collecting data on birth dates and birth years of athletes. 2) Freestyle swimming data results
500
Analysis of the data in this study includes a prerequisite test for the analysis and testing of
hypotheses.
RESULT AND DISCUSSION
1. Descriptive Statistics
[image:4.595.71.435.216.401.2]a. Combination of Exercises
Table 1 Descriptive Statistics combination exercises
Combination
Pre test Post test diff combination
exercise 1
N 20 20 20
Mean 1.2151 1.2520 .0369
Std. Deviation .29020 .25228 .05451
Minimum .84 .93 -.05
Maximum 1.72 1.69 .16
combination exercise 2
N 20 20 20
Mean 1.2870 1.2900 .0030
Std. Deviation .18106 .21420 .10458
Minimum .73 .76 -.22
Maximum 1.60 1.67 .13
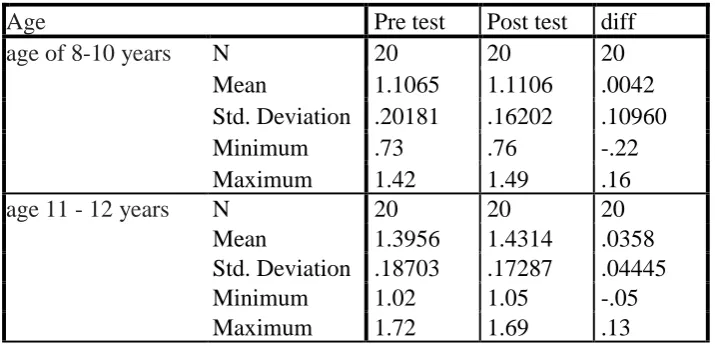
[image:4.595.70.428.485.658.2]b. Age group
Table 2 Descriptive statistics based on age groups
Age Pre test Post test diff
age of 8-10 years N 20 20 20
Mean 1.1065 1.1106 .0042
Std. Deviation .20181 .16202 .10960
Minimum .73 .76 -.22
Maximum 1.42 1.49 .16
age 11 - 12 years N 20 20 20
Mean 1.3956 1.4314 .0358
Std. Deviation .18703 .17287 .04445
Minimum 1.02 1.05 -.05
Maximum 1.72 1.69 .13
c. Interaction Combination Exercise and Age Group
501
Join Pre test Post test diff
combination of 1 age group 8-10 years
N 10 10 10
Mean .9889 1.0586 .0697
Std. Deviation .13296 .11408 .05115
Minimum .84 .93 .02
Maximum 1.22 1.27 .16
combination of age groups 8-10 years
N 10 10 10
Mean 1.2240 1.1626 -.0614
Std. Deviation .19390 .19077 .11486
Minimum .73 .76 -.22
Maximum 1.42 1.49 .13
combination of 1 age group 11-12 years
N 10 10 10
Mean 1.4413 1.4454 .0041
Std. Deviation .21542 .19551 .03558
Minimum 1.02 1.05 -.05
Maximum 1.72 1.69 .06
combination of 2 age
groups 11-12 years
N 10 10 10
Mean 1.3499 1.4173 .0674
Std. Deviation .15101 .15628 .02605
Minimum 1.18 1.23 .04
Maximum 1.60 1.67 .13
Data to be analyzed must meet the requirements for normality and homogeneity.
502
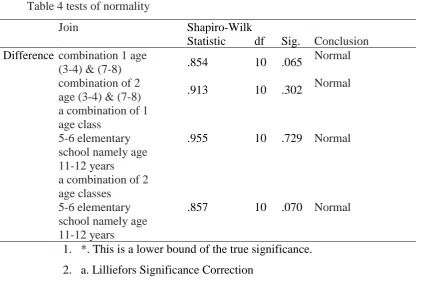
2. Data Normality Test
Table 4 tests of normality
Join Shapiro-Wilk
Statistic df Sig. Conclusion
Difference combination 1 age
(3-4) & (7-8) .854 10 .065
Normal
combination of 2
age (3-4) & (7-8) .913 10 .302
Normal
a combination of 1 age class
5-6 elementary school namely age 11-12 years
.955 10 .729 Normal
a combination of 2 age classes
5-6 elementary school namely age 11-12 years
.857 10 .070 Normal
1. *. This is a lower bound of the true significance.
2. a. Lilliefors Significance Correction
[image:6.595.45.467.94.377.2]3. Data Homogeneity Test
Table 5 Levene's Test of Equality of Error Variancesa
F df1 df2 Sig.
6.407 3 36 .001
Based on the two test results the requirements analysis above gives the conclusion
that the analysis requirements needed for further analysis in looking at the differences in the
effect of the training approach and the age group on swimming ability.
The results of homogeneity testing turned out to be concluded that the assumption of
homogeneity between observation cells was not fulfilled. Nevertheless a 2 way ANOVA
analysis can still be done and there is a possibility of bias in the analysis. So that to compare
cell treatments with advanced tests, it is better to use alternative tests that have been provided
503
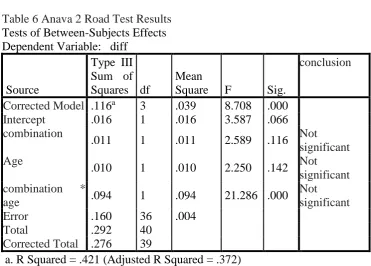
[image:7.595.70.442.95.361.2]4. Hypothesis testing
Table 6 Anava 2 Road Test Results Tests of Between-Subjects Effects Dependent Variable: diff
Source
Type III Sum of Squares df
Mean
Square F Sig.
conclusion
Corrected Model .116a 3 .039 8.708 .000
Intercept .016 1 .016 3.587 .066
combination
.011 1 .011 2.589 .116 Not
significant Age
.010 1 .010 2.250 .142 Not
significant
combination *
age .094 1 .094 21.286 .000
Not significant
Error .160 36 .004
Total .292 40
Corrected Total .276 39
a. R Squared = .421 (Adjusted R Squared = .372)
(a) Comparison between combination training methods
Table 7 comparison between combination training methods
statistics Pre test
Post
test difference F count P
exercise 1 mean 1.215 1.252 0.037 2.589 0.116
sd 0.290 0.252 0.055
exercise 2 mean 1.287 1.290 0.003
sd 0.181 0.214 0.105
[image:7.595.70.476.577.667.2](b) Comparison of Swimming Ability Between Age Groups
Table 8 comparison between age groups
Statistics Pre test Post test difference F count P
Age group 8-10
years Mean 1.106 1.111 0.004 2.25 0.142
Sd 0.202 0.162 0.110
Age group 11 - 12 years
Mean 1.396 1.431 0.036
Sd 0.187 0.173 0.044
Based on the table above, the average increase in the age group 8-10 years is 0.004
while in the age group 11-12 years the average increase is 0.036. The results of testing on the
504
(sig.) Of 0.142. A probability value of more than 0.05 means that there is no difference in the
increase in swimming ability between the ages of 8-10 years with the age group 11-12 years.
It can be concluded that the age group 11-12 years has an initial value that tends to be higher
than the age group 8-10 years. After being given treatment in the 11 - 12 year age group, it
was seen to increase compared to the 8-10 year age group. However, statistical testing
concluded that there were no significant differences between the two.
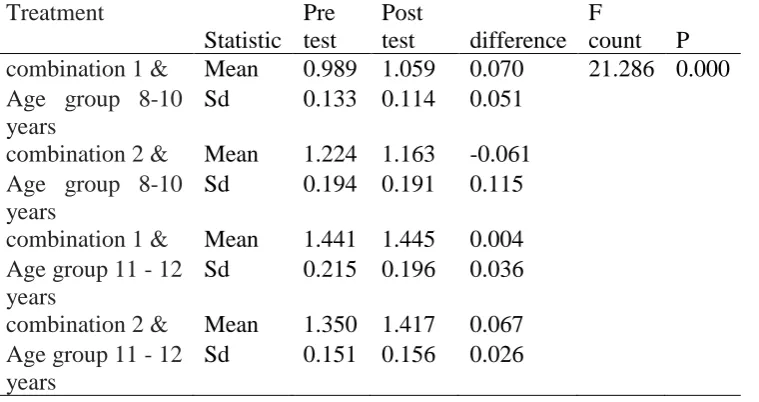
[image:8.595.69.449.253.454.2](c) Comparison of Interactions between Combination of Exercises and Age Groups
Table 9 interaction test
Treatment
Statistic Pre test
Post
test difference
F
count P
combination 1 & Mean 0.989 1.059 0.070 21.286 0.000
Age group 8-10 years
Sd 0.133 0.114 0.051
combination 2 & Mean 1.224 1.163 -0.061
Age group 8-10 years
Sd 0.194 0.191 0.115
combination 1 & Mean 1.441 1.445 0.004
Age group 11 - 12 years
Sd 0.215 0.196 0.036
combination 2 & Mean 1.350 1.417 0.067
Age group 11 - 12 years
Sd 0.151 0.156 0.026
Based on the two-way variance analysis as summarized in the ANAVA Table in table
4.8 obtained F-count from the interaction variation source (AXB) of 21,286 with a
probability value of 0,000. Probability value <0.05. This means that there is an interaction
effect between the combination of exercises with the age category. The form of interaction is
described below. Testing the comparison between cells is done by Tamhane statistical test
because the assumption of homogeneity is not fulfilled.
Table 10 Comparison of results of combination 1 exercises by age category
Treatment
Statistic Pre test
Post
test difference
mean
difference P
combination 1 & Mean 0.989 1.059 0.070 0.06560 0.025
Age group 8-10 years
Sd 0.133 0.114 0.051
combination 1 & Mean 1.441 1.445 0.004
Age group 11 - 12 years
[image:8.595.67.456.630.746.2]505
Based on the table above, it is known that in combination exercises 1 athlete aged
8-10 years tends to have a higher increase than athletes aged 11-12 years, namely the average
difference between them at 0.06560. Statistic testing also obtained a probability value of
0.025 <0.05. This means that there are significant differences in combination 1 exercises
between the age group 8-10 years with the age group 11-12 years. Based on this information,
it can be concluded that combination 1 exercises provide better results in the age group 8-10
[image:9.595.111.330.568.749.2]years.
Table 11 Comparison of results of combination exercises based on age categories
Treatment
Statistic Pre test
Post
test difference
Mean
difference P
combination 2 & Mean 1.224 1.163 -0.061 0.12880 0.037
Age group 8-10 years
Sd 0.194 0.191 0.115
combination 2 & Mean 1.350 1.417 0.067
Age group 11 - 12 years
Sd 0.151 0.156 0.026
Based on the table above, it is known that in combination exercises 2 athletes aged
8-10 years tend to have a lower increase and even have a negative value (decreased ability)
compared to athletes aged 11-12 years, namely the average difference between 0.12880.
Statistic testing also obtained a probability value of 0.037 <0.05. This means that there are
significant differences in combination 2 exercises between the ages of 8-10 years with the age
group 11-12 years. Based on this information it can be concluded that combination 2
exercises provide better results in the age group 11-12 years.
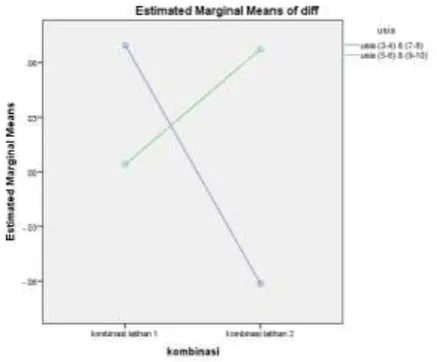
Clear interaction test can be seen from the picture means plot. If there are intersections
506
Based on the picture above, it can be seen that there are 2 lines intersection so it can
be concluded that there is an interaction between the combination of exercises with the age
group. Namely in the combination of exercises 1 age group 8-10 years is better than the age
group 11-12 years while in combination training 2 age groups 11 - 12 years tend to be better
than the age group 8-10 years.
CONCLUSION
The results of this study are:
1. There is no significant influence on the combination training method on improving
swimming abilities. This can be seen from the probability value of 0.116> 0.05
2. There is no significant difference in age category with increasing swimming ability. This
can be seen from the probability value of 0.142> 0.05.
3. There are interactions between combinations of exercises with age groups. This can be
seen from the probability value of 0.000 <0.05. The form of interaction in the form of
combination exercise 1 concludes that the increase in swimming ability of the age group 8-10
years is better than the age group 11 - 12 years with a difference in average value of 0.06560
and a probability of 0.025 <0.05. Whereas in combination with exercise 2, it was concluded
that the increase in swimming ability of the 11 - 12 year age group was better than the age
group 8 - 10 years with a difference in the average value of 0.12880 and probability of 0.037
507
REFERENCE
Borg W.R. and Gall, M.D. 1983. Education Research: An Introduction. 4 th ed. London:
Longman Inc.
Cholik Mutohir, T. 2002. Gagasan-gagasan tentang Pendidikan Jasmani dan Olahraga.
Unesa University Press: Surabaya.
Ichsan, M. 1991. Seri Bahan Kuliah Olahraga di ITB Manusia dan Olahraga. ITB dan FPOK
IKIP Bandung.
Lucero, Blythe. 2013. 101 Swimming More Drills. Oxford: Meyer & Meyer Sport (UK)
Nenggala, Asep Kurnia. 2006. Pendidikan Jasmani Olahraga dan Kesehatan. Jakarta:
Grafindo Media Pratama.