S O F T W A R E A R T I C L E
Open Access
Tax4Fun2: prediction of habitat-specific
functional profiles and functional
redundancy based on 16S rRNA gene
sequences
Franziska Wemheuer
1,2, Jessica A. Taylor
3, Rolf Daniel
4, Emma Johnston
1,2, Peter Meinicke
5, Torsten Thomas
3and
Bernd Wemheuer
3,4*Abstract
Background:Sequencing of 16S rRNA genes has become a powerful technique to study microbial communities
and their responses towards changing environmental conditions in various ecosystems. Several tools have been developed for the prediction of functional profiles from 16S rRNA gene sequencing data, because numerous questions in ecosystem ecology require knowledge of community functions in addition to taxonomic composition. However, the accuracy of these tools relies on functional information derived from genomes available in public databases, which are often not representative of the microorganisms present in the studied ecosystem. In addition, there is also a lack of tools to predict functional gene redundancy in microbial communities.
Results:To address these challenges, we developed Tax4Fun2, an R package for the prediction of functional
profiles and functional gene redundancies of prokaryotic communities from 16S rRNA gene sequences. We
demonstrate that functional profiles predicted by Tax4Fun2 are highly correlated to functional profiles derived from metagenomes of the same samples. We further show that Tax4Fun2 has higher accuracies than PICRUSt and Tax4Fun. By incorporating user-defined, habitat-specific genomic information, the accuracy and robustness of predicted functional profiles is substantially enhanced. In addition, functional gene redundancies predicted with Tax4Fun2 are highly correlated to functional gene redundancies determined for simulated microbial communities.
(Continued on next page)
© The Author(s). 2020Open AccessThis article is licensed under a Creative Commons Attribution 4.0 International License, which permits use, sharing, adaptation, distribution and reproduction in any medium or format, as long as you give appropriate credit to the original author(s) and the source, provide a link to the Creative Commons licence, and indicate if changes were made. The images or other third party material in this article are included in the article's Creative Commons licence, unless indicated otherwise in a credit line to the material. If material is not included in the article's Creative Commons licence and your intended use is not permitted by statutory regulation or exceeds the permitted use, you will need to obtain permission directly from the copyright holder. To view a copy of this licence, visithttp://creativecommons.org/licenses/by/4.0/. The Creative Commons Public Domain Dedication waiver (http://creativecommons.org/publicdomain/zero/1.0/) applies to the data made available in this article, unless otherwise stated in a credit line to the data.
* Correspondence:[email protected]
3Centre for Marine Science and Innovation, School of Biological, Earth and Environmental Sciences, University of New South Wales, Sydney, NSW 2052, Australia
4Genomic and Applied Microbiology and Göttingen Genomics Laboratory, Institute of Microbiology and Genetics, University of Göttingen, Göttingen, Germany
(Continued from previous page)
Conclusions:Tax4Fun2 provides researchers with a unique tool to predict and investigate functional profiles of prokaryotic communities based on 16S rRNA gene sequencing data. It is easy-to-use, platform-independent and highly memory-efficient, thus enabling researchers without extensive bioinformatics knowledge or access to high-performance clusters to predict functional profiles. Another unique feature of Tax4Fun2 is that it allows researchers to calculate the redundancy of specific functions, which is a potentially important measure of how resilient a community will be to environmental perturbation. Tax4Fun2 is implemented in R and freely available athttps://
github.com/bwemheu/Tax4Fun2.
Keywords:Metagenomics, Functional predictions, 16S rRNA gene, Bioinformatics, Microbiome, Multifunctional
redundancy, Ecosystem functioning
Background
Microorganisms are key players in ecosystem func-tioning [1, 2]. For example, host-associated microor-ganisms significantly contribute to the health of their host organism, e.g., by providing essential nutrients or by enhancing the host’s resilience to pathogens or pests [3–5]. High-throughput sequencing of 16S rRNA genes is a powerful and widely used tool to study the taxonomic or phylogenetic composition of microbial communities in a variety of marine [6–8], terrestrial [9, 10] and host-associated [11–13] envi-ronments. However, numerous questions in biogeo-chemistry and ecology require knowledge of microbial community function, rather than, or in addition to, the taxonomic or phylogenetic composition [14]. In-vestigating the composition of microbial communities and their functional capabilities is of particular im-portance when the effect of changing environmental conditions or anthropogenic perturbations on ecosys-tem services is being assessed [15].
Many ecosystems are threatened by environmental per-turbations. A key question in microbial ecology is whether, and to what degree, microbial communities con-tain functionally redundant members that may provide stability to ecosystem processes in the face of these pertur-bations [8, 16–18]. It has been proposed that the evalu-ation of multiple functions provide a more comprehensive picture on the role of biodiversity for maintaining ecosys-tem functions [19]. However, the simultaneousness assess-ment of multiple functions is time-consuming [20]. Some researchers have started to address this question by devel-oping metatranscriptome-based [20] or metagenome-based [21] approaches for quantifying the multifunctional redundancy of microbial communities [20, 21]. To the best of our knowledge, no tools are currently available to provide a standardized method for the simultaneous cal-culation of functional redundancy for multiple functions.
In past years, several freely available tools including PICRUSt [22], Tax4Fun [23], Piphillin [24], Faprotax [25] and paprica [26] have been developed for the
prediction of functional profiles inferred from 16S rRNA gene sequence data. Although these tools cannot replace the functional assessment via metagenomic shotgun se-quencing, they have provided unique insights into func-tional capabilities of prokaryotic communities in diverse habitats, such as microbial mats [27], soil [28–31], mar-ine seawater [25, 26, 32, 33], sediment [8, 34], rumen [35,36] and the plant endosphere [37,38].
The predictive power of these tools relies on func-tional information derived from genomes available in public databases. This information is used to predict functional profiles even if no close reference genomes are present in these databases. However, available ge-nomes do not necessarily represent the functional diver-sity present in the ecosystem investigated. This problem has motivated the development of predictive tools spe-cific for the rumen microbiome [35] or marine microor-ganisms [25]. Given the rapidly increasing number of available genomes, in particular through metagenome-assisted genome binning [39], and that many research groups have access to unpublished, habitat-specific gen-omic information, the incorporation of such data is likely to enhance the accuracy of functional inferences.
Here, we introduce Tax4Fun2, a new and improved ver-sion of Tax4Fun [23]. Tax4Fun2 is platform-independent, user-friendly and highly memory-efficient. It can incorporate habitat-specific and user-defined data. Although Tax4Fun2 focuses on prokaryotic data, eukaryotic data can also be in-corporated. We show that the incorporation of habitat-specific data improves the practical utility of Tax4Fun2 for microbiome datasets from a wide range of ecosystems. Com-parative analysis further shows that Tax4Fun2 has a higher accuracy than PICRUSt [22] and Tax4Fun [23]. Another unique feature of Tax4Fun2 is that it enables researchers to calculate the functional redundancy of multiple functions, which is critical for the prediction of how likely a specific ecosystem function is to be lost during environmental per-turbation. This information might be important in ecosystem biomonitoring and the prioritisation of environmental man-agement actions.
Implementation
Tax4Fun2 is provided as an R [40] package with a current default reference dataset build from 12,377 ar-chaeal and bacterial genomes available through the NCBI RefSeq database. The current version is 1.1.5. Tax4Fun2 is platform-independent and enables re-searchers without extensive bioinformatics knowledge to predict functional profiles in an efficient and user-friendly manner. In the following sections, we provide further details in the generation of the reference data and the technical implementation of Tax4Fun2.
Tax4Fun2 reference data
Tax4Fun2 is supplied with two reference datasets (Ref99NR and Ref100NR) referring to the similarity threshold used during clustering of the 16S rRNA gene sequences. Each dataset consists of an association matrix with 16S rRNA gene reference sequences associated with functional reference profiles (number of entries in the full association matrix: 4584 and 18,479 for Ref99NR and Ref100NR, respectively). Due to its smaller size, the Ref99NR database is less hardware-demanding and pre-dictions are generated faster compared to the Ref100NR. In order to obtain the default reference data, we in-cluded the functionbuildReferenceData,which will auto-matically download and build the reference data.
The reference datasets were generated as follows: we downloaded all complete genomes and all genomes with the status‘chromosome’from NCBI RefSeq (assessed on 18 August 2018), resulting in 275 archaeal and 12,102 bacterial genomes. Barrnap version 0.9 (https://github. com/tseemann/barrnap) was used to identify and extract all 16S rRNA gene sequences. All rRNA gene sequences were subsequently concatenated into a single file, sorted by decreasing length and clustered using the UCLUST algorithm implemented in USEARCH version 10.240 [41] at 99 and 100% sequence similarity, respectively. The longest sequence of each cluster serves as the 16S rRNA reference sequence. Functional profiles for each genome were generated as follows: open-reading-frames were predicted with prodigal version 2.6.3 [42]. Func-tional profiles were calculated based on obtained protein sequences with UProC version 1.2.0 [43] using the KEGG Orthology (KO) database for prokaryotes (July 2018 release; [44]) as reference. To account for differ-ences in rRNA copy numbers, functional profiles were normalized by the number of 16S rRNA genes identified in each genome. Due to the heterogeneity of 16S rRNA genes within a genome, the functional reference profile for each 16S rRNA reference sequence was generated based on the 16S rRNA clustering results; a single tional reference profile is the average normalized func-tional profile of each genome with at least one 16S rRNA gene affiliated to the cluster. If more than one 16S
rRNA gene sequence of a genome was assigned to a cluster, the normalized profile of the genome was multi-plied by the number of 16S rRNA genes affiliated to the cluster before calculating the mean profile. To calculate phylogenetic distances, two phylogenetic trees (one tree for each reference dataset) are included in the reference data. These were generated as follows: all 16S rRNA refer-ence sequrefer-ences were aligned with SINA version 1.2.11 [45] against the latest Silva ARB release (SILVA_132_ SSUREF_NR99) [46]. The phylogenetic tree was subse-quently calculated using RaxML version 8.2.11 [47] under a GTRGAMMA model and a random seed of 12,345.
Extending the reference data of Tax4Fun2 using specific genomes
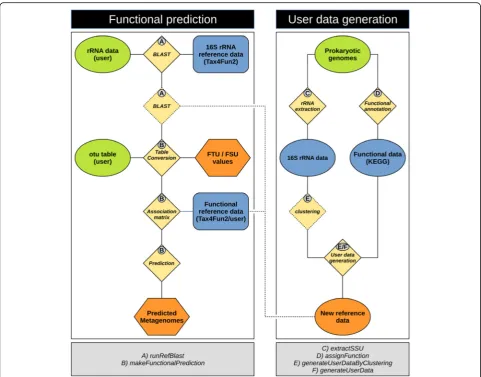
The predictive power of available tools, such as PICRUSt or Tax4Fun, is limited by the number of genomes avail-able in public databases that also need frequent updates. Moreover, available genomes do not necessarily repre-sent the functional diversity prerepre-sent in the ecosystem in-vestigated. In Tax4Fun2, we address these issues by allowing users to build their own habitat-specific refer-ence data sets (Fig. 1). In order to build such a dataset, the user needs to provide a set of genomes. To assist with the extraction of 16S rRNA sequences and the functional annotation of these genomes, we imple-mented two functions in the Tax4Fun2 package: extra-ctSSU and assignFunctions. Ribosomal RNA sequences (16S rRNA or 18S rRNA) are identified by BLAST search using the SILVA SSURef database version 132 [46] (preclustered at 90% with uclust). Functional pro-files are generated by BLASTp with diamond against the KEGG KO database [48]. Protein sequences are pre-dicted prior to functional annotation using prodigal ver-sion 2.6.3 [42]. Currently, the functional annotation is only available for prokaryotes but will be extended to eu-karyotes in later versions. The extracted rRNA se-quences and functional profiles are subsequently used to build reference data sets using the addUserDataByClus-tering or addUserData functions (Fig. 1). vsearch is re-quired to use the first function [49]. vsearch is freely available at https://github.com/torognes/vsearch and in-cluded in Tax4Fun2 as part of the reference data. The latter function bypasses the clustering step with vsearch and is recommended if only a small number of distinct genomes shall be used as reference data.
Predicting functional profiles with Tax4Fun2
as paprica [26], use algorithms to place query sequences into phylogenetic trees. These algorithms usually provide a very accurate phylogenetic placement. However, pla-cing sequences is very hardware intensive and most al-gorithms are restricted to Unix or Unix-like operating systems. Due to these limitations, we decided to use a BLAST-based approach, because we only need to identify the closest match in the database. If user data is supplied, the next-neighbour search is repeated using the user-generated reference data. Following the assumption that users provide habitat or site-specific data, user-generated data is preferred to the default reference data. Specifically, if the next neighbour
search for one OTU against both the default refer-ence database and the user-generated database re-sulted in significant hits, the user data is incorporated in the functional prediction.
Functional predictions are subsequently calculated using the makeFunctionalPrediction function (Fig. 1). During this step, the OTU table supplied by the user is summarized based on the results of the next neighbour search. A specific association matrix in the summarized table is generated containing only the functional refer-ence profiles of the next neighbours. For each sample, the abundance information from the OTU table and the functional information stored in the specific association
Fig. 1The Tax4Fun workflow. 16S rRNA gene sequences are initially aligned against the reference sequences provided with Tax4Fun2 to identify the nearest neighbour. If user-defined data is supplied, the 16S rRNA gene sequences are additionally aligned against the sequences added by the user. Nearest neighbours in the user data will be preferred if both search attempts result in significant hits. The OTU abundances for each sample are summarized based on the results from the nearest neighbour search. An association matrix (AM) containing the functional profiles of those references identified in the 16S rRNA search is generated. The summarized abundances and the functional profiles stored in the AM are merged and a metagenome is predicted for each sample. FTU and FSU values are provided as a log file. To include user data and generate a habitat-specific data set, Tax4Fun2 provides functions to functionally annotate prokaryotic genomes and to extract 16S rRNA gene sequences. User-defined reference data sets are subsequently generated and can be included in the prediction. If large amounts of genomes are provided, extracted 16S rRNA gene sequences can be optionally clustered using the uclust algorithm
matrix are converted into a sample-specific functional profile. Predicted profiles are later summarized based on KEGG pathways. Only OTUs passing a defined similarity threshold (default = 97%) are considered in the func-tional prediction. The fraction of OTUs having no close hit in the reference data and hence are unused in the subsequent prediction (fraction of taxonomic units un-used = FTU) as well as the amount of sequences assigned to these unused taxonomic units (fraction of sequences unused = FSU) is recorded. FTU and FSU values may serve as an additional quality indicator for the predicted metagenomes as high FTU and/or FSU values indicate that predictions were made only for a small fraction of the total microbial community.
Calculation and validation of the functional redundancy index (FRI)
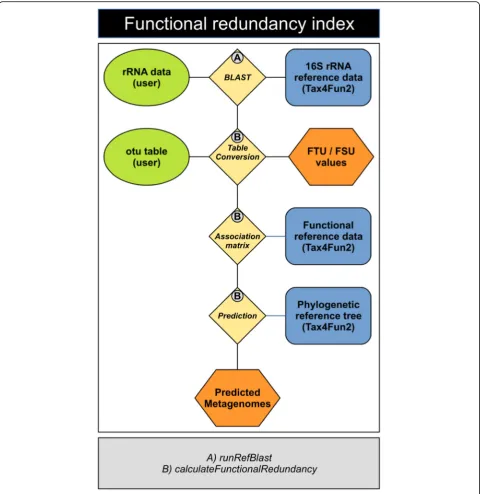
To date, there is no tool available to predict functional redundancies based on 16S rRNA data. Here, we intro-duce the functional redundancy index (FRI), which de-scribes the (multi-) functional redundancy of a prokaryotic community, i.e., the redundancy of multiple functions in the investigated community. The FRI incor-porates the phylogenetic distribution (distance) of com-munity members harbouring a specific function and their proportion in the community. In Tax4Fun2, the functional redundancy index is calculated using the functioncalculateFunctionalRedundancy(Fig.2).
Following next neighbour search, the OTU table is summarized based on the results of the next neighbour search and converted to binary data (presence/absence). The normalized functional profile associated with each reference sequence is also converted to a binary data (presence/absence) using a cut-off of 100% meaning that a function is considered to be present if it was observed in all genomes assigned to the reference profile. If the next neighbour search identifies the same neighbour for several OTUs, then the normalized functional profile as-sociated with the 16S rRNA reference sequence is multi-plied by the number of OTUs before it is being converted to binary data. This is based on the assump-tion that the probability a specific funcassump-tion present in a community is higher the more distinct the phylotypes associated to a single reference are present. The redun-dancy of any function present in the community is sub-sequently calculated by multiplying the average phylogenetic distance of all community members posses-sing the function with their proportion in the commu-nity. The product is normalized by the average phylogenetic distance of the total community. To ac-count for differences in average phylogenetic distances between different communities, we provide the possibil-ity to calculate the absolute and the relative FRI (aFRI and rFRI). To calculate the aFRI, the average
phylogenetic distance of all species in the full 16S rRNA reference tree is used for normalization, whereas the rFRI is normalized by the average phylogenetic distance of those species in the 16S rRNA reference tree identi-fied as being present in the surveyed samples during next neighbour search. The rFRI can be used to compare samples within one survey, whereas the aFRI allows the comparison of functional redundancy indices across dif-ferent ecosystems. The latter is important as multifunc-tional redundancy comparisons between or among different environments generate a more robust depiction of (regional) variation in the resilience/vulnerability of microbial communities [21].
To test the FRI accuracy, we simulated 1000 prokary-otic communities each consisting of 100 genomes ran-domly selected from the 12,377 genomes used to generate the reference data. To assess the phylogenetic distance between the genomes, we extracted 63 marker protein sequences based on hmm profiles derived from PFAM version 31 [51] and TIGRFAM version 15 [52]. The 63 marker proteins were selected because their cor-responding genes were present in 90% of all 12,377 ge-nomes and, if present, were single-copy genes in 99% of them. These criteria were applied to archaea and bac-teria independently. The extracted protein sequences of each hmm profile were aligned using mafft version 7.3.11 [53]. Afterwards, aligned protein sequences for each genome were concatenated. The phylogenomic tree was calculated using FastTree version 2.1.10 [54]. Func-tional profiles for each genome were converted to presence-absence data and the FRI was calculated for each function using the genome tree and the presence-absence data. The 16S rRNA gene sequences present in each genome subset were separately clustered in oper-ational taxonomic units (OTUs) at 97% similarity with UCLUST implemented in USEARCH [41]. An OTU table was generated based on the clustering. Each OTU was represented by its longest sequence.
Results and discussion
Tax4Fun2 evaluation
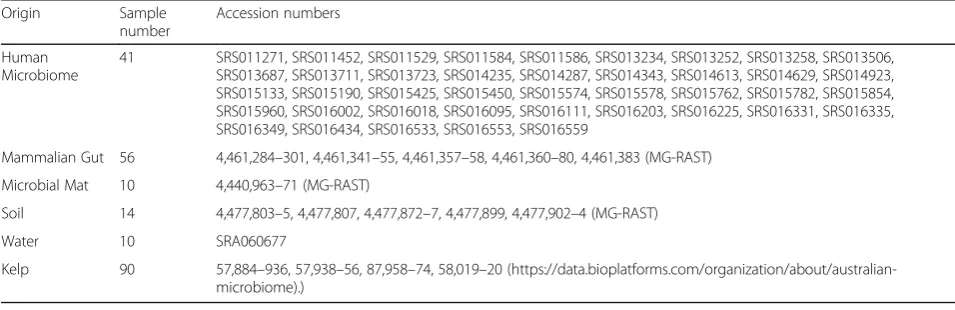
We first applied Tax4Fun2 in comparison to Tax4Fun [23] and PICRUSt [22] using the same paired samples (16S rRNA gene and metagenome data), which were used to validate both tools, i.e. samples derived from the human microbiome, mammalian guts, soil and from a hypersaline microbial mat (Table 1), in addition to ten marine seawater samples taken in the North Sea [7] and 90 kelp-associated samples collected within the Marine Microbes Framework Data Initiative ( http://www.bio-platforms.com/marine-microbes).
Fig. 2(See legend on next page.)
picking against the Greengenes database (version 13_5; [56]) and normalized prior to functional prediction. For Tax4Fun, OTU sequences were taxonomically classified by BLAST search [57] against the SILVA database (SILVA_123_SSURef_Nr99) [46].
We evaluated the predictive power of each tool by com-paring the functional profiles predicted from the 16S rRNA data to functional profiles generated directly from the metagenomes using Spearman rank correlations. Comparing the profiles predicted with PICRUSt, Tax4Fun and Tax4Fun2 with metagenome-derived profiles clearly showed that Tax4Fun2 outperforms PICRUSt and Tax4-Fun across all six tested datasets (Fig. 3). In addition, Tax4Fun2 was more than 20 times faster than Tax4Fun due to the smaller reference database.
It should be noted that a direct comparison of func-tional profiles predicted with all three tools is difficult due to several changes in the KEGG Orthology since PICRUSt and Tax4Fun were developed (deprecated and new functional orthologs). Hence, predicted functional profiles as well as those obtained by metagenomic shot-gun sequencing were converted to relative abundances prior to comparison. Only functions present in the
metagenomic profile and in the predicted profile were considered in each comparison. On average, more than 95% of all functions in the human microbiome as well as the marine, soil and kelp-derived metagenomes were af-filiated to these shared KOs. In the microbial mat and the mammalian gut samples, more than 74 and 78% of all predicted functions were affiliated to these KOs, respectively.
Using user-defined data increased the accuracy and reduced the FTU
Following the assumption that any additional genomic information specific for the investigated habitat further enhances the predictive power of Tax4Fun2, we used 68 metagenome-assembled genomes (MAGs) generated from the 90 kelp-associated metagenomes to build a kelp-specific reference dataset. These genomes were se-lected because at least one 16S rRNA gene sequence was identified in each genome.
Using the default data, the median Spearman correl-ation coefficient was 0.72. Incorporating the kelp-specific data substantially increased the power of the functional prediction (median Spearman correlation
(See figure on previous page.)
Fig. 2The FRI workflow. 16S rRNA gene sequences are initially aligned against the reference sequences provided with Tax4Fun2 to identify the nearest neighbour. The OTU abundances for each sample are converted to presence-absence data and subsequently summarized based on the results from the nearest neighbour search. An association matrix (AM) containing the normalized functional profiles of those references identified in the 16S rRNA search is generated. The normalized functional profile in the AM is multiplied by the summarized OTU abundance. We assume that a function is present if the abundance of a function is greater than 50%. For instance, if 5 OTUs were affiliated to one 16S rRNA reference seqeunce, we would assume that every function with a minimum abundance of 10% in the normalized reference profile would be present in the AM. The FRI is finally calculated based on those community members possessing the function and their phylogenetic distribution. The amount of sequences/OTUs unused in the prediction (FSU/FTU) is provided in a log file 16S rRNA gene sequences are initially aligned against the reference sequences provided with Tax4Fun2 to identify the nearest neighbour. The presence of each OTU are summarized based on the results from the nearest neighbour search. An association matrix (AM) containing the functional profiles of those references identified in the 16S rRNA search is generated. The summarized abundances and the functional profiles stored in the AM are multiplied. Functions being present in all genomes are assumed to be present in the entire cluster. The functional redundancy is subsequently predicted from the average phylogenetic distance of all community members potentially possessing the function. This distance is subsequently normalized either by the average phylogenetic distance of the total reference tree (absolute) or by the distance found in the surveyed community (relative). FTU and FSU values are provided as a log file. The functions performing each step are marked with numbers
Table 1Accession numbers of samples/studies used to validate Tax4Fun2
Origin Sample
number
Accession numbers
Human Microbiome
41 SRS011271, SRS011452, SRS011529, SRS011584, SRS011586, SRS013234, SRS013252, SRS013258, SRS013506, SRS013687, SRS013711, SRS013723, SRS014235, SRS014287, SRS014343, SRS014613, SRS014629, SRS014923, SRS015133, SRS015190, SRS015425, SRS015450, SRS015574, SRS015578, SRS015762, SRS015782, SRS015854, SRS015960, SRS016002, SRS016018, SRS016095, SRS016111, SRS016203, SRS016225, SRS016331, SRS016335, SRS016349, SRS016434, SRS016533, SRS016553, SRS016559
Mammalian Gut 56 4,461,284–301, 4,461,341–55, 4,461,357–58, 4,461,360–80, 4,461,383 (MG-RAST)
Microbial Mat 10 4,440,963–71 (MG-RAST)
Soil 14 4,477,803–5, 4,477,807, 4,477,872–7, 4,477,899, 4,477,902–4 (MG-RAST)
Water 10 SRA060677
Fig. 3Correlations between functional profiles obtained from metagenomic datasets and those predicted from 16 s rRNA data. Predictions were made with PICRUSt, Tax4Fun, and Tax4Fun2. Predictions with Tax4Fun2 were made using both supplied default reference datasets (Ref99NR and Ref100NR). Note that PICRUSt did not generate any prediction for the kelp data
Fig. 4Correlations between functional profiles retrieved from 90 kelp metagenomes and those predicted with Tax4Fun2 without and with user data added and the fraction of zOTUs and sequences unused in the prediction
coefficient = 0.86) and reduced the fraction of the se-quences not used in the prediction (Fig.4), showing that a lack of suitable reference genomes did initially limit Tax4Fun2’s performance. Moreover, using the kelp-specific dataset enabled us to predict functional profiles for samples, which failed when using only the default reference data, because next neighbour search resulted in no close matches. These results demonstrate the ben-efits of incorporating user-defined, habitat-specific refer-ence databases, which distinguishes Tax4Fun2 from all other published tools.
Functional redundancy index
The simultaneousness assessment of multiple functions is usually very time-consuming [20]. Previous studies have focused on a limited number of community func-tions (e.g., [58–60]). However, the degree of functional redundancy in any given system depends on the func-tions considered [14]. In addition, it is difficult to draw conclusions about functional redundancy based on a single environmental situation, as species that are func-tionally redundant in one environment might be pivotal in another [61]. Hence, the extent of functional redun-dancy change as the ecological contribution of a species
might change between different environments. None-theless, a contemporary concern for the conservation of biodiversity and the development of management strat-egies is that decision makers require quantitative mea-sures as part of science-based negotiations and communications. In order to provide those measures when assessing natural or human-induced impacts on an ecosystem, we introduced the FRI with respect to multiple functions in Tax4Fun2. A high FRI indicates that a specific function is almost ubiquitous in all com-munity members, whereas a low FRI suggests that the function is present in a few closely related species. A FRI of 0 indicates that a function has been detected in only one community member or is not present at all. Consequently, the lower the FRI the higher the prob-ability that a function gets lost after community shifts or perturbations.
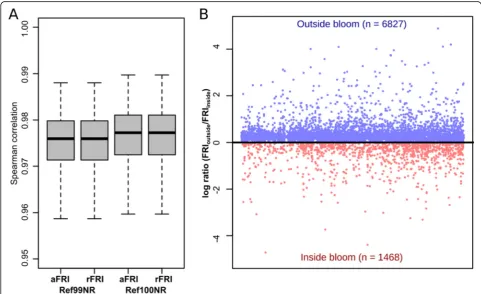
To test the accuracy, we simulated 1000 microbial communities and calculated FRI values based on 16S rRNA gene data using Tax4Fun2. The FRIs calculated for each function were subsequently compared to the FRIs calculated directly from the genomes of each simu-lation by Spearman rank corresimu-lation. The comparison revealed that Tax4Fun2 provides a good estimate of the
functional redundancy present in the microbial commu-nity (Spearman rank correlation > 90%) (Fig.5a).
We further calculated FRIs using the marine seawater samples. Six of these samples were taken inside a phyto-plankton bloom and three samples were taken outside the bloom [7]. Nearly 7000 functions displayed a higher functional redundancy index outside the bloom, whereas only 1468 functions had higher redundancies inside the bloom (Fig.5b). This indicates that the functional redun-dancy greatly shifts during the phytoplankton bloom. Phytoplankton blooms are usually characterized by a substrate-controlled succession, i.e. distinct bacterial clades dominate the bacterioplankton community at dif-ferent stages during and shortly after the bloom [62]. Consequently, community members involved in the turnover of certain substrates at a specific stage are pre-dominant. For instance, the SAR92 clade, the Roseobac-ter RCA cluster and the genus Polaribacter were more abundant in bloom samples [3]. Because we did not ob-serve significant differences in the phylogenetic diversity of bacterioplankton communities derived from bloom and reference samples, functions predominantly associ-ated with dominant community members are more re-dundant in the bloom whereas all other functions display higher redundancies in the reference samples.
Conclusion
With Tax4Fun2, we provide an easy-to-use, platform-independent R package, which enables researchers to predict and investigate functional profiles of prokaryotic communities based on 16S rRNA gene data. We demon-strate the high predictive power of Tax4Fun2, providing superior results to any other established tool. The key strength of Tax4Fun2 is the incorporation of user-defined and habitat-specific data, which further enhances the accuracy of the predictions. Another unique feature of Tax4Fun2 is that it enables researchers to calculate functionial redundancies, which is a relevant parameter for ecosystem monitoring and the development of man-agement strategies to safeguard optimal ecosystem func-tionality. Nonetheless, functional profiles and functional redundancies are predictions only and should be treated with caution.
Availability and requirements Project name: Tax4Fun2.
Project homepage: https://github.com/bwemheu/Tax4 Fun2
Operating system(s): Platform-independent. Programming language: R.
Other requirements: BLAST+ 2.7.1 or later, R packages ape and seqinr.
License: GNU General Public License v3.0. Any restrictions to use by non-academics: no.
Abbreviations
BLAST:Basic Local Alignment Search Tool; NCBI: National Center for Biotechnology Information; FRI: Functional redundancy index
Acknowledgements
Not applicable.
Authors’contributions
BW led the project. BW, PM and FW designed and implemented the final Tax4Fun2 algorithms, to which TT and RD made critical contributions. JAT collected and analysed the kelp dataset. BW, PM and RD coordinated the online implementation. FW and BW wrote the manuscript, with feedback from all other authors. All authors approved the final version of the manuscript.
Funding
B.W. and R.D. were supported by the German Research Foundation (DFG). T.T. and J.A.T. were supported by Bioplatforms Australia. F.W. and E.L.J. were supported by the Australian Research Council (ARC Linkage Project SHRP021212).
Availability of data and materials
The dataset(s) supporting the conclusions of this article is available at https:// cloudstor.aarnet.edu.au/plus/s/JuKZszIJBqBQznV.
Ethics approval and consent to participate
Not applicable.
Consent for publication
Not applicable.
Competing interests
The authors declare that they have no competing interests.
Author details
1Evolution and Ecology Research Centre, School of Biological, Earth and Environmental Sciences, University of New South Wales, Sydney, NSW 2052, Australia.2Sydney Institute of Marine Science, Mosman, NSW 2088, Australia. 3Centre for Marine Science and Innovation, School of Biological, Earth and Environmental Sciences, University of New South Wales, Sydney, NSW 2052, Australia.4Genomic and Applied Microbiology and Göttingen Genomics Laboratory, Institute of Microbiology and Genetics, University of Göttingen, Göttingen, Germany.5Department of Bioinformatics, Institute of Microbiology and Genetics, University of Göttingen, Göttingen, Germany.
Received: 3 January 2020 Accepted: 9 April 2020
References
1. Falkowski PG, Fenchel T, Delong EF. The microbial engines that drive Earth’s biogeochemical cycles. Science. 2008;320(5879):1034–9.https://doi.org/10. 1126/science.1153213.
2. Azam F, Malfatti F. Microbial structuring of marine ecosystems. Nat Rev Microbiol. 2007;5(10):782–91. Epub 2007/09/15.https://doi.org/10.1038/ nrmicro1747.
3. Heintz-Buschart A, Wilmes P. Human Gut Microbiome: Function Matters. Trends Microbiol. 2018;26(7):563–74.https://doi.org/10.1016/j.tim.2017.11. 002.
4. Vandenkoornhuyse P, Quaiser A, Duhamel M, Le Van A, Dufresne A. The importance of the microbiome of the plant holobiont. New Phytol. 2015; 206(4):1196–206.
5. Egan S, Harder T, Burke C, Steinberg P, Kjelleberg S, Thomas T. The seaweed holobiont: understanding seaweed–bacteria interactions. FEMS Microbiol Rev. 2013;37(3):462–76.
6. Sun MY, Dafforn KA, Johnston EL, Brown MV. Core sediment bacteria drive community response to anthropogenic contamination over multiple environmental gradients. Environ Microbiol. 2013;15(9):2517–31.https://doi. org/10.1111/1462-2920.12133.
7. Wemheuer B, Wemheuer F, Hollensteiner J, Meyer F-D, Voget S, Daniel R. The green impact: bacterioplankton response towards a phytoplankton spring bloom in the southern North Sea assessed by comparative
metagenomic and metatranscriptomic approaches. Front Microbiol. 2015;6: 805.https://doi.org/10.3389/fmicb.2015.00805.
8. Polónia ARM, Cleary DFR, Freitas R, Gomes NCM, de Voogd NJ. Archaeal and bacterial communities of Xestospongia testudinaria and sediment differ in diversity, composition and predicted function in an Indonesian coral reef environment. J Sea Res. 2017;119:37–53.https://doi.org/10.1016/j.seares. 2016.10.007.
9. Yu H, Ling N, Wang T, Zhu C, Wang Y, Wang S, et al. Responses of soil biological traits and bacterial communities to nitrogen fertilization mediate maize yields across three soil types. Soil Tillage Res. 2019;185:61–9.https:// doi.org/10.1016/j.still.2018.08.017.
10. Tripathi BM, Kim M, Kim Y, Byun E, Yang J-W, Ahn J, et al. Variations in bacterial and archaeal communities along depth profiles of Alaskan soil cores. Sci Rep. 2018;8(1):504.https://doi.org/10.1038/s41598-017-18777-x. 11. Zozaya-Valdés E, Roth-Schulze AJ, Egan S, Thomas T. Microbial community
function in the bleaching disease of the marine macroalgae Delisea pulchra. Environ Microbiol. 2017;19(8):3012–24.https://doi.org/10.1111/1462-2920. 13758.
12. Granzow S, Kaiser K, Wemheuer B, Pfeiffer B, Daniel R, Vidal S, et al. The effects of cropping regimes on fungal and bacterial communities of wheat and faba bean in a greenhouse pot experiment differ between plant species and compartment. Front Microbiol. 2017;8(902).https://doi.org/10. 3389/fmicb.2017.00902.
13. Hartman K, van der Heijden MGA, Roussely-Provent V, Walser J-C, Schlaeppi K. Deciphering composition and function of the root microbiome of a legume plant. Microbiome. 2017;5(1):2. https://doi.org/10.1186/s40168-016-0220-z.
14. Louca S, Polz MF, Mazel F, Albright MB, Huber JA, O’Connor MI, et al. Function and functional redundancy in microbial systems. Nature Ecology Evolution. 2018;2(6):936–43.https://doi.org/10.1038/s41559-018-0519-1. 15. Birrer SC, Dafforn KA, Sun MY, Williams RBH, Potts J, Scanes P, et al. Using
meta-omics of contaminated sediments to monitor changes in pathways relevant to climate regulation. Environ Microbiol. 2019;21(1):389–401.
https://doi.org/10.1111/1462-2920.14470.
16. Allison SD, Martiny JBH. Resistance, resilience, and redundancy in microbial communities. Proc National Acad Sci. 2008;105(Supplement 1):11512–9.
https://doi.org/10.1073/pnas.0801925105.
17. Jurburg SD, Salles JF. Functional redundancy and ecosystem function—the soil microbiota as a case study. In: Lo YH, Blanco JA, Roy S, editors. Biodiversity in Ecosystems-Linking Structure and Function: InTech; 2015. p. 29–49.
18. Moya A, Ferrer M. Functional redundancy-induced stability of gut microbiota subjected to disturbance. Trends Microbiol. 2016;24(5):402–13.
https://doi.org/10.1016/j.tim.2016.02.002.
19. Gamfeldt L, Hillebrand H, Jonsson PR. Multiple functions increase the importance of biodiversity for overall ecosystem functioning. Ecology. 2008; 89(5):1223–1231. doi:https://doi.org/10.1890/06-2091.1.
20. Beier S, Shen D, Schott T, Jürgens K. Metatranscriptomic data reveal the effect of different community properties on multifunctional redundancy. Mol Ecol. 2017;26(24):6813–26.https://doi.org/10.1111/mec.14409. 21. Miki T, Yokokawa T, Matsui K. Biodiversity and multifunctionality in a
microbial community: a novel theoretical approach to quantify functional redundancy. Proc R Soc B Biol Sci. 2014;281(1776):20132498.https://doi.org/ 10.1098/rspb.2013.2498.
22. Langille MGI, Zaneveld J, Caporaso JG, McDonald D, Knights D, Reyes JA, et al. Predictive functional profiling of microbial communities using 16S rRNA marker gene sequences. Nat Biotech. 2013;31(9):814–21.https://doi. org/10.1038/nbt.2676 http://www.nature.com/nbt/journal/v31/n9/abs/nbt.26 76.html#supplementary-information.
23. Aßhauer KP, Wemheuer B, Daniel R, Meinicke P. Tax4Fun: predicting functional profiles from metagenomic 16S rRNA data. Bioinformatics. 2015; 31(17):2882–4.https://doi.org/10.1093/bioinformatics/btv287.
24. Iwai S, Weinmaier T, Schmidt BL, Albertson DG, Poloso NJ, Dabbagh K, et al. Piphillin: improved prediction of metagenomic content by direct inference from human microbiomes. PLoS One. 2016;11(11):e0166104.https://doi.org/ 10.1371/journal.pone.0166104.
25. Louca S, Parfrey LW, Doebeli M. Decoupling function and taxonomy in the global ocean microbiome. Science. 2016;353(6305):1272–7.https://doi.org/ 10.1126/science.aaf4507.
26. Bowman JS, Ducklow HW. Microbial communities can be described by metabolic structure: a general framework and application to a seasonally
variable, depth-stratified microbial community from the coastal West Antarctic peninsula. PLoS One. 2015;10(8):e0135868.https://doi.org/10.1371/ journal.pone.0135868.
27. Koo H, Hakim JA, Morrow CD, Eipers PG, Davila A, Andersen DT, et al. Comparison of two bioinformatics tools used to characterize the microbial diversity and predictive functional attributes of microbial mats from Lake Obersee, Antarctica. J Microbiol Methods. 2017;140:15–22.https://doi.org/10. 1016/j.mimet.2017.06.017.
28. Kaiser K, Wemheuer B, Korolkow V, Wemheuer F, Nacke H, Schöning I, et al. Driving forces of soil bacterial community structure, diversity, and function in temperate grasslands and forests. Sci Rep. 2016;6:33696.https://doi.org/ 10.1038/srep33696.
29. Herzog S, Wemheuer F, Wemheuer B, Daniel R. Effects of fertilization and sampling time on composition and diversity of entire and active bacterial communities in German grassland soils. PLoS One. 2015;10(12):e0145575.
https://doi.org/10.1371/journal.pone.0145575.
30. Berkelmann D, Schneider D, Engelhaupt M, Heinemann M, Christel S, Wijayanti M, et al. How rainforest conversion to agricultural systems in Sumatra (Indonesia) affects active soil bacterial communities. Front Microbiol. 2018;9(2381).https://doi.org/10.3389/fmicb.2018.02381. 31. Semedo M, Song B, Sparrer T, Phillips RL. Antibiotic effects on microbial
communities responsible for Denitrification and N(2) O production in grassland soils. Front Microbiol. 2018;9:2121.https://doi.org/10.3389/fmicb. 2018.02121.
32. Wemheuer B, Wemheuer F, Meier D, Billerbeck S, Giebel H-A, Simon M, et al. Linking compositional and functional predictions to decipher the biogeochemical significance in DFAA turnover of abundant bacterioplankton lineages in the North Sea. Microorganisms. 2017;5(4).
https://doi.org/10.3390/microorganisms5040068.
33. Galand PE, Pereira O, Hochart C, Auguet JC, Debroas D. A strong link between marine microbial community composition and function challenges the idea of functional redundancy. The ISME J. 2018;12(10):2470– 8.https://doi.org/10.1038/s41396-018-0158-1.
34. Su Z, Dai T, Tang Y, Tao Y, Huang B, Mu Q, et al. Sediment bacterial community structures and their predicted functions implied the impacts from natural processes and anthropogenic activities in coastal area. Mar Pollut Bull. 2018;131:481–95.https://doi.org/10.1016/j.marpolbul.2018.04.052. 35. Wilkinson TJ, Huws SA, Edwards JE, Kingston-Smith AH, Siu-Ting K, Hughes
M, et al. CowPI: a rumen microbiome Focussed version of the PICRUSt functional inference software. Front Microbiol. 2018;9:1095.https://doi.org/ 10.3389/fmicb.2018.01095.
36. Biscarini F, Palazzo F, Castellani F, Masetti G, Grotta L, Cichelli A, et al. Rumen microbiome in dairy calves fed copper and grape-pomace dietary supplementations: composition and predicted functional profile. PLoS One. 2018;13(11):e0205670.https://doi.org/10.1371/journal.pone.0205670. 37. Wemheuer F, Kaiser K, Karlovsky P, Daniel R, Vidal S, Wemheuer B. Bacterial
endophyte communities of three agricultural important grass species differ in their response towards management regimes. Sci Rep. 2017;7:40914.
https://doi.org/10.1038/srep40914.
38. Yang R, Liu P, Ye W. Illumina-based analysis of endophytic bacterial diversity of tree peony (Paeonia Sect. Moutan) roots and leaves. Brazilian J Microbiol. 2017;48(4):695–705.https://doi.org/10.1016/j.bjm.2017.02.009.
39. Parks DH, Rinke C, Chuvochina M, Chaumeil P-A, Woodcroft BJ, Evans PN, et al. Recovery of nearly 8,000 metagenome-assembled genomes substantially expands the tree of life. Nat Microbiol. 2017;2(11):1533–42.
https://doi.org/10.1038/s41564-017-0012-7.
40. Team RC. R: A Language and Environment for Statistical Computing. Vienna, Austria: R Foundation for Statistical Computing; 2018 2015.
41. Edgar RC. Search and clustering orders of magnitude faster than BLAST. Bioinformatics. 2010;26(19):2460–1.https://doi.org/10.1093/bioinformatics/btq461. 42. Hyatt D, Chen G, LoCascio P, Land M, Larimer F, Hauser L. Prodigal:
prokaryotic gene recognition and translation initiation site identification. BMC Bioinformatics. 2010;11:119.https://doi.org/10.1186/1471-2105-11-119. 43. Meinicke P. UProC: tools for ultra-fast protein domain classification.
Bioinformatics. 2015;31(9):1382–8.https://doi.org/10.1093/bioinformatics/ btu843.
44. Kanehisa M, Goto S. KEGG: Kyoto encyclopedia of genes and genomes. Nucleic Acids Res. 2000;28(1):27–30.
46. Quast C, Pruesse E, Yilmaz P, Gerken J, Schweer T, Yarza P, et al. The SILVA ribosomal RNA gene database project: improved data processing and web-based tools. Nucleic Acids Res. 2013;41(D1):D590–D6.https://doi.org/10. 1093/nar/gks1219.
47. Stamatakis A. RAxML version 8: a tool for phylogenetic analysis and post-analysis of large phylogenies. Bioinformatics. 2014;30(9):1312–3.https://doi. org/10.1093/bioinformatics/btu033.
48. Buchfink B, Xie C, Huson DH. Fast and sensitive protein alignment using DIAMOND. Nat Methods. 2014;12:59.https://doi.org/10.1038/nmeth.3176. 49. Rognes T, Flouri T, Nichols B, Quince C, Mahé F. VSEARCH: a versatile open
source tool for metagenomics. PeerJ. 2016;4:e2584.https://doi.org/10.7717/ peerj.2584.
50. Callahan BJ, McMurdie PJ, Holmes SP. Exact sequence variants should replace operational taxonomic units in marker-gene data analysis. The ISME J. 2017;11(12):2639.
51. Finn RD, Coggill P, Eberhardt RY, Eddy SR, Mistry J, Mitchell AL, et al. The Pfam protein families database: towards a more sustainable future. Nucleic Acids Res. 2016;44(D1):D279–D85.https://doi.org/10.1093/nar/gkv1344. 52. Haft DH, Selengut JD, White O. The TIGRFAMs database of protein families.
Nucleic Acids Res. 2003;31(1):371–3.
53. Katoh T. Recent developments in the MAFFT multiple sequence alignment program. Brief Bioinform. 2008;9:286–98.https://doi.org/10.1093/bib/bbn013. 54. Price MN, Dehal PS, Arkin AP. FastTree 2–approximately
maximum-likelihood trees for large alignments. PLoS One. 2010;5(3):e9490.https://doi. org/10.1371/journal.pone.0009490.
55. Caporaso JG, Kuczynski J, Stombaugh J, Bittinger K, Bushman FD, Costello EK, et al. QIIME allows analysis of high-throughput community sequencing data. Nat Methods. 2010;7:335–6.
56. DeSantis TZ, Hugenholtz P, Larsen N, Rojas M, Brodie EL, Keller K, et al. Greengenes, a chimera-checked 16S rRNA gene database and workbench compatible with ARB. Appl Environ Microbiol. 2006;72(7):5069–72. Epub 2006/07/06.https://doi.org/10.1128/aem.03006-05.
57. Camacho C, Coulouris G, Avagyan V, Ma N, Papadopoulos J, Bealer K, et al. BLAST+: architecture and applications. BMC Bioinformatics. 2009;10:421. 58. Peter H, Ylla I, Gudasz C, Romaní AM, Sabater S, Tranvik LJ. Multifunctionality
and diversity in bacterial biofilms. PLoS One. 2011;6(8):e23225.https://doi. org/10.1371/journal.pone.0023225.
59. Mori AS, Isbell F, Fujii S, Makoto K, Matsuoka S, Osono T. Low
multifunctional redundancy of soil fungal diversity at multiple scales. Ecol Lett. 2016;19(3):249–59.https://doi.org/10.1111/ele.12560.
60. Delgado-Baquerizo M, Giaramida L, Reich PB, Khachane AN, Hamonts K, Edwards C, et al. Lack of functional redundancy in the relationship between microbial diversity and ecosystem functioning. J Ecol. 2016;104(4):936–46.
https://doi.org/10.1111/1365-2745.12585.
61. Fetzer I, Johst K, Schäwe R, Banitz T, Harms H, Chatzinotas A. The extent of functional redundancy changes as species’roles shift in different environments. Proc National Acad Sci United States of America. 2015; 112(48):14888–93. Epub 11/17.https://doi.org/10.1073/pnas.1505587112. 62. Teeling H, Fuchs BM, Becher D, Klockow C, Gardebrecht A, Bennke CM, et al.
Substrate-controlled succession of marine Bacterioplankton populations induced by a phytoplankton bloom. Science. 2012;336(6081):608–11.https:// doi.org/10.1126/science.1218344.
Publisher’s Note
Springer Nature remains neutral with regard to jurisdictional claims in published maps and institutional affiliations.