1
March 14, 2011
Industry: Electrical Equipment
Fundamental and Valuation Grades
ICRA Online has assigned the Fundamental Grade 4 and the Valuation Grade B to Havells India Limited (Havells). The Fundamental Grade 4 assigned to Havells implies that the company has ―strong fundamentals‖ relative to other listed securities in India. The grade factors in Havells‘ diversified product portfolio with core focus on the fast growing consumer goods sector, its effective marketing and distribution reach that supports premium pricing, and the significant growth potential of its subsidiary, Sylvania. The grade also takes note of the intense competition that Havells faces across the segments it operates in. The Valuation Grade B assigned to Havells implies that the company is ―moderately undervalued‖ on a relative basis (as on the date of the grading assigned).
Incorporated in 1971, Havells is one of the leading players in the electrical consumer goods industry in India. The company‘s operations span four broad segments, viz. cables & wires, switchgears, lighting, and electrical consumer durables, in order of their contribution to revenues. Starting primarily as a company dealing in industrial products, the company has gradually shifted its focus onto consumer products over the past one decade and is now considered a well-established brand in the domestic consumer electricals market.
Havells has grown both organically and inorganically over the years. Its last major acquisition that of the Frankfurt-based Sylvania in April 2007, has placed Havells on the global map in the lighting industry.
Grading Positives
Established brand equity along with leading market shares in most areas of operation, diversified product portfolio, presence in consumer products segment with high growth potential and experienced management. The company also has a strong financial profile, characterised by robust profitability and cash generation, with working capital requirements being limited. Potential upsides to our estimates: (1) Higher than expected market share in new product segments; and (2) Better than expected improvement in Sylvania‘s profitability and cash flow generation capacity backed by growth in emerging economies.
Grading Sensitivities
Key sensitivities to our estimates include: (1) Further increase in competition resulting in loss of market share, particularly in the intensely competitive electrical consumer durables (ECD) division; (2) Slower than expected revival in Sylvania‘s profitability and success in emerging markets, particularly new geographies.
Fundamental & Valuation Grades: ICRA assigns fundamental grade of ‗?/5‘ and valuation grade of ‗?‘ to MSL. A fundamental grade of ‗?/5‘ indicates MSL‘s fundamentals are ‗?‘ relative to the other listed securities in India. This grade factors in the companies‘ established presence in the seamless and ERW pipes industry and favorable industry prospects over the medium to long term. However, it is constrained by the high competition from Chinese imports of seamless pipes in the domestic and Middle East market, vulnerability to raw material prices and concentration of MSL‘s sales on the oil and gas sector. A valuation grade of ‗?‘ on a grading scale of ‗A to E‘ indicates that the company is ? valued on sector relative basis and has a ? potential over the next one year from its current market price.
ICRA Online Grading Matrix
Valuation Assessment F u n d ame n ta l A s s e s s m e nt A B C D E 5 4 4B 3 2 1
Fundamental Grading of ‗4/5‘ indicates ―strong fundamentals‖
Valuation Grading of ‗B‘ indicates ―moderately undervalued‖ on a relative basis
Key Stock Statistics
Current Market Price* (Rs.) 348.25 381.65
Shares Outstanding (crore) 12.48 12.48
Market Cap (Rs. crore) 4345.28 4762.0
52-Week High (Rs.) 446.50 446.50
52-Week Low (Rs.) 257.50 166.00
Free Float (%) 38.4% 35.4%
Beta 1.09 1.03
P/E on 2011-12 EPS Estimate (x) 12.3 17.7
Bloomberg Stock Code HAVL IN HAVL IN *As on March 11, 2011
Havells Shareholding Pattern (December 31, 2010)
Havells Share Price Movement (24 months) Indian Promoter Group, 61.6% Non-Institutio ns, 19.8% Domestic Institutio ns, 2.4% Foreign Institutio ns, 2.3% Warburg Pincus, 14.0% 0% 100% 200% 300% 400% 500% 600% 700% 800% 900% Havells India Ltd S&P CNX Nifty BSE Consumer Durables
% c h a n g e (P ri c e /P o in ts )
Key Financials (Consolidated)
2009-10A 2010-11E 2011-12E 2012-13E Operating Income (Rs. Crore) 5,432 5,928 6,462 7,059
EBITDA Margin (%) 5.73% 8.09% 9.73% 10.03%
PAT Margin (%) 1.28% 4.35% 5.45% 5.95%
EPS (Rs.) 5.8 20.7 28.2 33.7
EPS Growth (%) N/A 258% 36% 19%
P/E (x) N/A 16.8 12.3 10.3
P/BV (x) 10.5 7.1 4.7 3.3
RoE 14% 51% 46% 37%
RoCE 15% 27% 30% 31%
EV/EBITDA 16.9 11.0 8.4 7.4
Source: Company, ICRA Online’s estimates
SUMMARY
Growth fuelled by increasing focus on consumer electricals; considerable scope for future expansion in related products
Starting off as a manufacturer of switchgears in 1971, Havells till the late 1990s was largely involved in manufacturing industrial products. Foreseeing strong growth prospects in the consumer goods category, the company later diversified into products such as fans, compact fluorescent lamps (CFLs), modular switches, and power cables and wires. As these products are used mostly during building construction or renovation, the company benefited from the rapid growth in the real estate sector, reporting a robust compounded annual growth rate (CAGR) of around 40% in its revenues in the last ten years.
To further capitalise on the growth potential in the consumer goods category, Havells is now expanding its portfolio, including products such as water heaters.
Strong growth prospects backed by presence in high-potential consumer goods segment
With its main focus being on electrical consumer goods, demand for most of Havells‘ products is driven by consumer spending and power availability. Over the last four years, the top players in domestic electrical consumer goods‘ industry have demonstrated strong revenue growth of 15-18%, driven by rising income levels, increasing urbanisation, and greater rural electrification. Further, with standards of living improving and consumer focus increasing on saving energy, the demand for quality products has been reporting strong growth. The trend is expected to sustain, with the main beneficiaries being companies with established brands and product attributes that stand out in an increasingly cluttered market, high quality standards that neutralise competition from unorganised-sector players, and extensive distribution networks that enable them to reach the high growth centres in Tier-II and Tier-III cities. Given its established track record, Havells is in a favourable position to capitalise on the sector‘s growth potential. We expect Havells to post a net profit CAGR of around 11% between 2009-10 and 2012-13(E) on a standalone basis.
Intense competition across segments
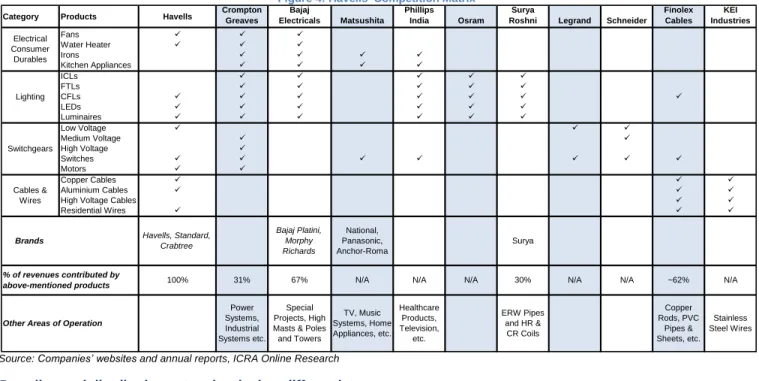
The segments in which Havells operates (except cables) are characterised by limited capital expenditure (capex) requirements and availability of outsourcing or imports to meet demand. Consequently, Havells faces intense competition in most of its business segments. Although there is only one large company - Crompton Greaves - that is into similar areas of operation as Havells, low investment requirements have resulted in significant competition from single-product/segment companies (refer
Figure 4) and unorganised players. In this scenario, an established brand name and distribution network become critical, as the same cannot be easily replicated. Havells‘ ability to differentiate products (for instance, introducing additional attributes like low power consumption and electric shock prevention), and its effective brand building initiatives, thus, restricts competition from the unorganised sector to some extent.
-20 -10 0 10 20 30 40 50 60 II P C onsum e r D ura bl e Index 0 500 1,000 1,500 2,000 2,500 3,000 R s . C rore
Figure 1: Trend in Havells' Revenue Growth
Source: Company’s Annual Reports; ICRA Online’s estimates
0% 10% 20% 30% 0 10 20 30 40 50 2004-05 2005-06 2006-07 2007-08 2008-09 2009-10 % c ha ng e R s . (' 0 0 0 s )
Per capita disposable income Growth in per capita disposable income
Figure 2: IIP Consumer Durables Index
Source: Bloomberg
Figure 3: Growth in Disposable Incomes in Last Five Years
Figure 4: Havells' Competition Matrix
Source: Companies’ websites and annual reports, ICRA Online Research
Branding and distribution network—the key differentiators
With increasing urbanisation, Tier-II and -III towns are expected to be the key growth drivers over the next few years, which makes extensive distribution network and brand presence critical for consumer goods‘ companies. Havells‘ ability to cross-leverage its existing distribution network and its established brand presence give it a competitive edge over smaller companies with limited reach.
Havells has established a pan-India distribution network over the years, using which it has been able to gain market share rapidly even for its relatively new products like modular switches, CFLs, and electric fans. Its network compares well with that of the largest electric appliance company in India, Bajaj Electricals, which reaches out through 50,000 retail outlets.
Table 1: Distribution Network of Havells versus Peer Companies
Source: Companies’ websites
At present, Havells has a network of 4,300 wholesalers/dealers and 35,000 retailers. In terms of brand, the company is particularly strong in North and East India, which together account for around 56% of its total sales and 44% of its total dealer base. While South India has been a major contributor to sales because of the sheer market size; Havells has been traditionally weak in West India (which accounts for around 15% of its total sales), being a late entrant there. The company is however making efforts to increase its market share in the region by expanding its dealer base (which is now comparable in size to its dealer bases in North and South India).
To further leverage its presence across product segments, Havells has opened exclusive outlets named ―Havells Galaxy‖ in several cities across India. These stores, owned by Havells‘ dealers, display and undertake retail sales for the entire product range of the company. At present, there are 80 Havells Galaxy stores across India and the company plans to raise the number to 200 by March 2012.
Havells has also been aggressive in its advertising, with its advertisement expense to sales ratio being significantly higher than that of its close peers. The company‘s advertisements and brand building initiatives have increased its brand visibility among end-consumers. This, together with the acquisition of established brands like Crabtree and Standard over the
Category Products Havells Crompton Greaves ElectricalsBajaj Matsushita Phillips India Osram RoshniSurya Legrand Schneider Finolex Cables IndustriesKEI
Fans Water Heater Irons Kitchen Appliances ICLs FTLs CFLs LEDs Luminaires Low Voltage Medium Voltage High Voltage Switches Motors Copper Cables Aluminium Cables
High Voltage Cables
Residential Wires
N/A N/A 30% ~62%
Other Areas of Operation
Power Systems, Industrial Systems etc. Copper Rods, PVC Pipes & Sheets, etc. ERW Pipes and HR & CR Coils Surya N/A
N/A N/A N/A
% of revenues contributed by above-mentioned products Bajaj Platini, Morphy Richards Havells, Standard, Crabtree Special Projects, High Masts & Poles and Towers National, Panasonic, Anchor-Roma TV, Music Systems, Home Appliances, etc. Stainless Steel Wires 100% 31% 67% Healthcare Products, Television, etc. Electrical Consumer Durables Lighting Cables & Wires Switchgears Brands Company Distributors/ Dealers Retail Outlets Havells 4,300 35,000 Bajaj Electricals 5,000 50,000 Legrand 600 3,000
Table 3: Advertising Spend of Havells versus Peer Companies
2006-07 2007-08 2008-09 2009-10
Havells 1.9% 2.4% 2.1% 3.3%
Bajaj Electricals 1.6% 1.5% 1.3% 1.5%
Crompton Greaves 0.4% 0.5% 0.5% 0.4%
Source: Companies’ Annual Reports, ICRA Online’s estimates
Table 2: Havells’ Regional Sales and Distribution Network
Region Havells’ Sales Havells’ Dealers
North 34% 26% East 22% 18% West 15% 27% South 28% 29% Total 100% 100% Source: Company
years, has strengthened Havells‘ brand portfolio, enabling it to command a price premium in several products.
Figure 5: Havells’ Brands in India Figure 6: Havells’ International Brands
Sylvania turnaround to improve consolidated profits The economic downturn that happened soon after Havells acquired the Frankfurt-based Sylvania in April 2007 led to Havells reporting losses on a consolidated basis in 2008-09 and 2009-10. This in turn kept Havells‘ consolidated earnings per share (EPS) depressed during the two years ended March 2010. Havells initiated a restructuring exercise aimed at reducing fixed cost base at Sylvania that is expected to result in annual savings of €33.5 million, a large part of which would be reflected in its EBITDA in 2010-11. Initially, the company had expected to break even at the net profit level in 2011-12, but the 9M, 2010-11 results of Sylvania indicate that the subsidiary would make a nominal net profit of about €1million in 2010-11 itself. With Sylvania turning around [EBITDA positive in Q4, 2009-10 and net profits from 2010-11(E) onwards] Havells‘ consolidated EPS is expected to increase significantly over the medium term.
Further, in line with other global majors such as Philips and
Osram, Sylvania is looking at increasing its exposure in fast growing developing markets such as India, China, and Malaysia. While bulk of the improvement in Sylvania‘s profits during the current year are attributable to cost savings from restructuring programmes, increasing revenue contributions from the emerging markets including Latin America and Asia would drive Sylvania‘s profitability in the long term.
Launch of Sylvania products in India to enable Havells serve a wider market, but distribution would be a challenge The size of the market for luminaires and special lamps, the likely focus areas for Sylvania in India, was an estimated Rs. 2,100 crore in 2009, accounting for almost 30% of India‘s total lighting market that year. Considering Sylvania‘s track record of operations and the growth potential of the Indian lighting industry, the scope for the brand‘s growth in India appears significant. With its wider product range and access to the latest technologies such as of light emitting diodes (LEDs), Sylvania will be positioning its products to access the institutional clients – thereby mitigating the risk of cannibalisation of Havells‘ existing products. Havells would however need to establish a separate distribution channel for Sylvania products as its current network is targeted primarily at retail customers. Accordingly, it may take some time for growth in Sylvania‘s products to pick up in India. We expect Sylvania‘s products to achieve a turnover of around Rs. 50 crore (translating into a market share of around 2%) in its first full year of operations and thereafter grow in line with the estimated industry growth rate of around 25%.
Segment/ Products Brand Indian Brands Havells Lighting, ECDs, Switchgears, Cables & Wires Crabtree Switches Standard Domestic Switchgears Segment/ Products Brand Multi-National Brands Sylvania Complete Lighting Range Concord Lighting Fixtures Lumiance Lighting fixtures
Source: Company Source: Company
-500 -400 -300 -200 -100 0 100 200 300 400 2008-09 2009-10 2010-11 2012-13 P A T ( Rs. Cr o re )
Sylvania Havells Standalone Consolidated
Figure 7: Movement in Net Profits
Source: ICRA Online’s estimates
Note: Sylvania and Consolidated 2009-10 PAT figures are adjusted for amounts charged by the company to Business Reconstruction Reserve
Company Snapshot (Standalone)
* Companies placed in order of their market position
Source: Company’s Annual Reports, Company data, ICRA Online’s estimates
0% 10% 20% 30% 40% 50% 60% 70% 0 2 4 6 8 10 12 14 2005-06 2006-07 2007-08 2008-09 2009-10 C a p a c it y U ti li z a ti o n C k m P e r A n n u m ( la k h )
Installed Capacity and Utilization Trend
ICRA Equity Research Service Havells India Limited
Lighting
Post-acquisition of Sylvania in 2007, lighting has become the major segment for the company accounting for around 60% of its consolidated revenue base. The acquisition provided the company an access to international markets, Sylvania‘s premium product-range and its well-established brand name. Although profitability in Sylvania‘ international operations was affected because of global recessionary conditions and overall operational inefficiencies in the last two financial years, domestic lighting segment of Havells continued to be profitable because of favourable market scenario in India and cost-efficient operations. The business dynamics of domestic and international lighting operations of consolidated Havells entity continue to be different and hence have been analysed separately in the following sections.
Lighting—Domestic
Domestic lighting segment holds significant growth potential
In the lighting segment, Havells is involved in manufacturing CFLs and trading in luminaires. Both the categories hold significant growth potential as the demand for the products is strongly correlated with real estate and construction activities in the country. Moreover, the high share of lighting in domestic power consumption (~20% in India), continuing power deficit and mounting pressure on natural resources are factors contributing to the shift in favour of more energy-efficient products, thus acting as key drivers of CFL demand.
The domestic lighting industry reported a CAGR of 12% to around Rs. 72 billion over the five years till 2009-10. With personal disposable incomes increasing and market preference shifting towards more energy-efficient products, the CFL segment reported a much faster CAGR of 28% over the same period to account for almost one-third of the total domestic lighting market. Havells, despite its late entry into the segment (in 2003-04) and the presence of large incumbents such as Philips, Osram and Bajaj, has successfully garnered a market share of 8% in the CFL segment and of around 10% in the luminaire segment.
Government initiatives expected to spur CFL growth
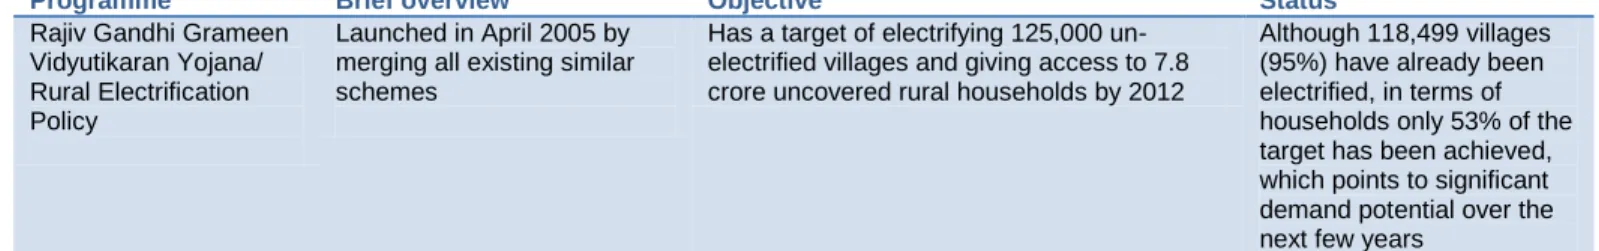
Although CFLs are much more energy efficient1 than ICLs, CFL penetration is considerably low in the household sector in India (10-15%) largely because of their high price (8-10 times more expensive than ICLs). Government initiatives to enhance rural electrification in the country while simultaneously promoting use of energy efficient lighting systems by providing subsidies (refer Table 4) is expected to boost demand for lighting products, particularly CFLs. The objective is to subsidise the more expensive energy-efficient products, making them affordable for the target market. For instance, successful
1
CFLs with a luminous efficiency of 50-95 lumens/Watt (lm/W) and offering 6,000-12,000 burning hours consume 75% less energy as compared with ICLs, which have a luminous efficiency of 5 to 20 lm/W and offer 750-1000 burning hours. The luminous efficiency of light emitting diodes (LEDs) is even higher at 100-130 lm/W and they offer around 50,000 burning hours.
2005-06 2006-07 2007-08 2008-09 2009-10 ICLs, 13% ICLs, 10% FTLs, 24% FTLs, 16% CFLs, 16% CFLs, 27% Luminaires, 20% Luminaires, 22% Others, 27% Others, 25%
Domestic Lighting: Key Drivers and Challenges
Growth Drivers
Increase in real estate activities backed by strong economic growth
High cost of energy, continuing power deficit, and pressure on natural resources
Greater focus on energy-efficient products
Government initiatives to subsidise energy-efficient products
Key Challenges
Intense competition
Keeping pace with changing technology
Environmental threat posed by use of mercury in CFLs
Significant warranty returns in CFL business
Fragmented nature of luminaire business Figure 8: Changing Trend in Lighting Industry
Source: ELCOMA India, ICRA Online’s estimates Note: Above estimates are for calendar years
implementation of Bachat Lamp Yojana (BLY) will reduce the price differential between ICLs and CFLs to Rs. 3-9 per piece, thus attracting demand from price-sensitive and rural households.
Table 4: Summary of Key Government Initiatives that could boost Demand for Lighting Products in India
Programme Brief overview Objective Status
Rajiv Gandhi Grameen Vidyutikaran Yojana/ Rural Electrification Policy
Launched in April 2005 by merging all existing similar schemes
Has a target of electrifying 125,000 un-electrified villages and giving access to 7.8 crore uncovered rural households by 2012
Although 118,499 villages (95%) have already been electrified, in terms of households only 53% of the target has been achieved, which points to significant demand potential over the next few years
BLY Promotes replacement of
inefficient bulbs with CFLs by leveraging the sale of Certified Emission Rights (CERs) under the Clean Development Mechanism (CDM) of the Kyoto Protocol
To distribute high quality CFLs at about Rs.15 per piece to households in the country. Balance cost to be recovered by registering the project under CDM. The scheme aims to replace 40 crore ICLs in India with CFLs
Implemented/initiated in Himachal Pradesh, Punjab, Uttar Pradesh, Madhya
Pradesh, Kerala,
Chhattisgarh and Orissa
Source: Ministry of Power; ICRA Online Research
While the scope of BLY is limited to replacement of 40 crore ICLs (translating into an additional demand of 2% per annum for CFLs), efforts in some developed nations are directed at mandatory replacement of all ICLs with more energy-efficient products. Introduction of similar programmes in India could be a strong demand driver for CFLs, given that ICLs account for roughly 65-70% of the total annual sales of lighting products in India (in terms of volumes). In India, we do not expect any major replacement demand in the short to medium term unless Government implements mandatory phase-out of ICLs while continuing to provide subsidises on CFLs.
Industry volumes for CFLs reported a CAGR of 40% during the last four years, with the growth moderating to 28.1% in 2009-10 partly on account of the higher base effect and partly because of the slowdown in the real estate sector. The growth (CAGR, four years) in value terms has been relatively low at 28% because of declining realisations.
Table 5: Estimation of Potential CFL Market for Havells
2007-08 2008-09 2009-10 2010-11(E) 2011-12(E) 2012-13(E)
Industry Sales Lakh pieces 1,400 1,990 2,550 3,213 4,048 5,101
Growth % 40% 42% 28% 26% 26% 26%
Total Sales Rs. Crore 1,162 1,510 1,900 2,410 3,036 3,775
Growth % 40% 30% 26% 27% 26% 24%
Realisation per CFL Rs. 83 76 75 75 75 74
Source: ELCOMA India, ICRA Online’s estimates
Considering the slow implementation of BLY and the uncertainty over Havells‘ participation in the same, we have not factored in any incremental sales that may come from that scheme. While sustaining a high growth rate could be increasingly difficult on a growing base, the CFL industry is likely to enjoy strong demand prospects, considering the currently low penetration levels, the potential replacement demand, and the additional demand likely from increased residential and commercial/retail construction activities over the next few years. Accordingly we expect the CFL market to report a CAGR of 26% over the next five years.
Intensely competitive industry; Havells’ strategy to counter warranty claims to temper market share growth
The CFL market in India is intensely competitive, featuring around 20 organised- and several unorganised-sector players. While till around two years back, the unorganised sector used to account for almost 40% of the CFL market, their share is now expected to decline significantly on account of the following factors:
Introduction of standards for CFLs by Bureau of Indian Standards (BIS): BIS has mandated that CFLs should carry a high power factor (PF) stamp from October 1, 2009 onwards. According to ELCOMA, 14 companies have acquired licences to manufacture CFLs with >0.85 PF
Imposition of anti-dumping duty: This has restricted the import of low-cost CFLs from China to an extent
Increasing consumer awareness: As the price differential between products offered by organised and unorganised players is not significant, consumer preference has moved towards products with better quality parameters (such as power factor, and guaranteed hours)
Going forward, we expect the CFL industry to increasingly consolidate away from the unorganised sector as the shift towards higher quality gains further momentum and the benefits of scale economies accrue to the larger players. Assuming a 20% shift in market share from the unorganised to the organised sector over three to five years, the top five players (including Havells) would gain 2.8% to 3.2% in market share, given their extensive distribution network, cost-efficient operations, and strong brand presence. Havells however is following a cautious approach to contain warranty claims, a major concern for the industry. As is the industry norm, CFL manufacturers provide a product warranty varying from six months to one year from the date of purchase2. This has been a major concern for CFL makers in India because market malpractices have led to significant claims for returns. In 2007-08, Havells received claims for Rs. 13.62 crore, which was 12.7% of its CFL sales that year. To rectify the situation, the company withdrew its products from certain States where malpractices were rampant, and this led to a 30% decline in its sales to Rs. 84.5 crore in 2008-09. Consequently, the company‘s market share declined to 6% in 2008-09 from 10% in 2007-08. Subsequently, with operations in other States stabilising, Havells‘ market share reported improvement in 2009-10. Its warranty claims declined significantly in 2009-10 to Rs. 2.86 crore, which was 1.9% of its total CFL sales that year.
Although there have been instances of companies withdrawing warranties in the past, the lack of participation from all companies, besides the availability of cheaper alternatives from the unorganised sector, adversely affected sales, prompting the reintroduction of warranties. Given that warranty related malpractices still exist, Havells is now following a conservative strategy of restricting its presence to a few key markets. While this has adversely impacted sales and market share during the last two years, it has also helped protect profitability margins. Considering Havells‘ conservative approach, we expect its market share to stabilise at around 8.5% over 2010-11(E) to 2012-13(E).
Table 6: Movement in Havells' Market Share in CFL Segment
Units 2007-08 2008-09 2009-10 2010-11(E) 2011-12(E) 2012-13(E)
Industry Size Rs. crore 1,162 1,510 1,900 2,410 3,036 3,775
Market Share % 10% 6% 8% 8.5% 8.5% 8.5%
Source: ELCOMA India, ICRA Online’s estimates
Environmental threat posed by mercury use in CFLs, increasing affordability of solid-state lighting products may affect CFL demand; access to Sylvania’s technology for advanced products may help maintain market share
Although critical given their importance in saving electricity, CFLs face environment related challenges because of the use o f mercury in their manufacturing. The threat is greater for developing nations such as India as CFLs manufactured here have a higher mercury content (up to 13 mg in lower quality lamps); developed nations on the other hand have regulations restricting such content to 1 mg per bulb. Given the environmental concerns, efforts are being made across the world to bring down the cost of solid-state lighting products or LEDs, which are considered significantly superior in terms of energy efficiency and environment friendliness. Although Havells has a single-product offering in the lighting segment (on a stand-alone basis) and a limited presence in LEDs (trading operations), its acquisition of Sylvania provides it with access to a much wider product range including fluorescent lamps, high-intensity discharge (HID) lamps and various special products for institutional clients.
Only new products to be launched under Sylvania brand to avoid cannibalisation of revenues
Havells is expected to launch Sylvania‘s products in India this financial year. To ensure that the launch does not lead to cannibalisation of revenues, Sylvania‘s operations in India will be focused solely on institutional customers and its products will be routed through an entirely different distribution channel. Havells on the other hand will continue with its own product range, which largely serves domestic and retail customers. The launch of Sylvania products would also benefit from a high brand recall, given that Sylvania was earlier operational in India through a joint venture named Sylvania Laxman Limited. Although the joint venture ended in 1993, it was able to establish a strong presence and the brand is still recognised in the industry. Significant scope of growth in luminaire segment
Apart from CFLs, Havells also has a presence in luminaires largely through trading. Because of intense competitive pressures from incumbent players such as Philips and Bajaj, Havells currently ranks fourth in terms of market position with a share of 10% in a Rs. 2,000 crore market. Considering the strong prospects for residential, retail and commercial construction in India, the luminaire segment is expected to report a healthy growth rate of around 15% per annum over 2010-11(E) to 2012-13(E). Havells‘ competitive positioning in the luminaire segment is expected to improve further with the launch of Sylvania products, which are largely targeted at institutional clients, including airports and stadiums.
2
Lighting—International (Sylvania)
Leveraged buyout; modest funding support expected, going forward To enter international markets, Havells acquired the lighting business of SLI Sylvania in April 2007 for €234.5 million. Based out of Frankfurt, Sylvania is the world‘s fourth largest player in the lighting industry and owns reputed brands: Sylvania, Concord, Marlin, Lumiance and Linolite. Following this acquisition, Havells got access to brand rights of Sylvania worldwide with the exception of the USA, Canada, Mexico, Australia and New Zealand where the brand rights are owned by Osram and some other players. Overall, the acquisition price that Havells paid appears steep, especially in hindsight, given that Sylvania‘s key markets went into a slowdown post-acquisition. Havells funded the acquisition cost of Sylvania by taking fresh debt in the latter‘s books. Out of the total funding requirement of €200 million, €80 million was funded by a recourse debt that was backed by a guarantee from Havells while the balance €120 million was funded by non-recourse debt.
Table 7: Cost of Sylvania Acquisition and Funding Pattern
Particulars Amount Remarks
Total cost of acquisition €234.5 million ~ Rs. 1273.12 crore at €-INR rate prevalent as on April 30, 2007. The cost included €34.5 million of pension liabilities that were not to be funded
Funding requirement €200.0 million
Recourse debt €80.0 million Debt had recourse to Havells in the event of default. Out of the amount, only €10.0 million was pending as on December 31, 2010
Non-recourse debt €120.0 million Source: Company
During the last three years, Havells also extended additional financial support to Sylvania via equity infusion, which in turn was used for repayment of recourse debt and to meet cash flow mismatches. Till date, Havells has invested €114 million in the subsidiary. This has depressed Havells‘ return on equity (RoE), as the additional investments have not yielded returns till 2009-10. Going forward, we estimate Havells‘ incremental financial exposure in Sylvania to be lower at around €16 million.
Table 8: Future Funding Support to Sylvania In € mn Particulars
1. Recourse debt to be repaid over the next one year (by April 2012) 10.00
2. Interest to be paid on recourse debt 1.60
3. Guaranteed working capital debt 5.00
TOTAL 16.60
Source: Company
Prospects favourable for Sylvania, given its strong product portfolio, access to latest technologies, and high brand recall value; expansion into newer markets to provide a boost to revenues over the long term
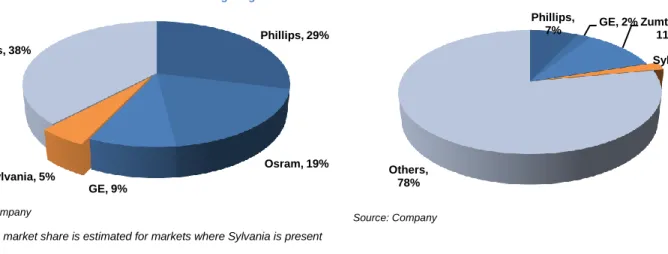
Havells‘ acquisition of Sylvania has given it access to the global lighting industry, which is expected to report a CAGR of 7-10% over the next 10 years. Globally, the lamps industry is highly consolidated, featuring a few large players including Philips, Osram (Siemens), GE, and Sylvania. These players together hold around 65% of the total market for lamps. Although Sylvania‘s market share is relatively low at around 5% as compared with 29% of Philips, 19% of Osram, and 9% of GE, its wide product range with the latest technologies and strong brands have enabled it to compete with the top three brands of the world and sustain its market share in mature markets such as Europe. In contrast to the lamps industry, the luminaires industry is highly fragmented, with smaller and regional players holding around 80% of the market. As against 7% of Philips, Sylvania holds a 2% share of the luminaires market in countries where it operates.
Sylvania: Key Drivers and Challenges
Growth & Profitability Drivers
Entry into fast-growing emerging markets
Ability to access cheaper manufacturing outsourcing options
Key Challenges
Ability to garner market share in emerging markets
Ability to refinance debt in a timely manner
Note: The market share is estimated for markets where Sylvania is present
Till now, Sylvania had been focusing primarily on mature markets in Europe. With plans to launch operations in Eastern Europe, Middle East, African and Asian markets, company‘s revenue growth is expected to recover in the next three years. Global economic slowdown along with high fixed costs adveresely affected profitability during last three years; slowdown impact similar as that on peers
After Havells acquired Sylvania in April 2007, the world economy suffered one of the worst recessions in decades, a fallout of which was a significant decline in the revenues of companies across the lighting industry. This together with high fixed costs led to several companies reporting operating losses during that period. Like Sylvania, Philips and Osram also undertook restructuring, which subsequently allowed profit margins to recover to the 2008 levels in CY2010. Sylvania however had weaker margins to begin with because of its higher fixed costs and delay in beginning the restructuring exercise (following change in management), which meant the company‘s margins started recovering only from Q4, 2009-10.
Restructuring packages primarily aimed at correcting high operating leverage, the primary reason for losses
Table 9: Estimated Change in Operating Leverage Post-Restructuring
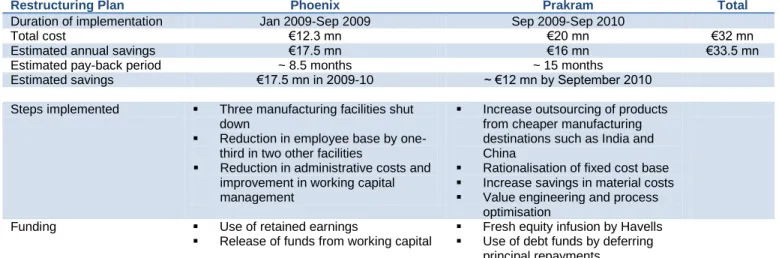
The primary reason for Sylvania incurring losses following the decline in revenues in 2008-09 was its high operating leverage (refer Table 9). To correct this, the company launched two restructuring programmes costing a total of €32million: Project Phoenix (Jan 2009-Sep
€ mn Particulars 2008-09 (A) 2009-10(A) 2010-11 (E)
Sales 508.6 438.4 470.1
Less: Variable Costs 287.4 279.8 304.6
Contribution (A) 221.2 158.6 165.5
Less: Fixed Costs 209.7 159.9 144.6
Operating Profits (B) 11.5 -1.4 21.0
Degree of Operating Leverage (A/B) 19.2 - 7.9
Phillips, 29% Osram, 19% GE, 9% Sylvania, 5% Others, 38% Phillips, 7% GE, 2% Zumtobel, 11% Sylvania, 2% Others, 78%
Figure 12: Quarterly Movement in Margins of Sylvania & Competition
Source: Quarterly reports of companies, ICRA Online’s estimates
Figure 11: Quarterly Movement in Revenues of Sylvania & Competition
Source: Quarterly reports of companies, ICRA Online’s estimates Source: Company
Figure 9: Estimated Market Shares in International Lighting Market Figure 10: Estimated Market Shares in International Luminaires Market
Source: Company
2009) and Project Prakram (Sep 2009-Sep 2010). The two programmes were primarily aimed at rationalising the company‘s cost structure3. The cost consisted mainly of severance payments made on account of reduction in manpower at the European facilities.
Table 10: Summary of Restructuring Projects implemented at Sylvania
Restructuring Plan Phoenix Prakram Total
Duration of implementation Jan 2009-Sep 2009 Sep 2009-Sep 2010
Total cost €12.3 mn €20 mn €32 mn
Estimated annual savings €17.5 mn €16 mn €33.5 mn
Estimated pay-back period ~ 8.5 months ~ 15 months
Estimated savings €17.5 mn in 2009-10 ~ €12 mn by September 2010
Steps implemented Three manufacturing facilities shut down
Reduction in employee base by one-third in two other facilities
Reduction in administrative costs and improvement in working capital management
Increase outsourcing of products from cheaper manufacturing destinations such as India and China
Rationalisation of fixed cost base Increase savings in material costs Value engineering and process
optimisation
Funding Use of retained earnings
Release of funds from working capital
Fresh equity infusion by Havells Use of debt funds by deferring
principal repayments Source: Company
Adverse market conditions together with continued focus of Sylvania on internal restructuring programmes, which also involved closure of certain production units, resulted in a decline in its net sales to €438 million in 2009-10 from €514 million in 2007-08. Although the fixed costs had been pruned to an extent with the implementation of Project Phoenix in 2009-10, the company‘s profitability continued to decline because of a sharp fall in sales. This resulted in Sylvania reporting an operating loss of €1.4 million in 2009-10.
Table 11: Sylvania’s Past Financial Performance
Source: Company, ICRA Online’s estimates
^ Note: As per reported numbers, the company has adjusted the amount directly from Business Reconstruction Reserve created out of retained earnings
3
Similar restructuring programmes were launched by some other players including Philips that were aimed at reducing the share of fixed costs in the total cost structure.
€ million 2007-08 2008-09 2009-10 Gross Sales 514 509 438 % change -1% -14% EBITDA 27.5 11.5 -1.4 EBTDA % 5.4% 2.3% -0.3% Depreciation 9.8 11.2 8.8 Interest 13.6 13.7 11.9 PBT 5.6 -13.2 -21.1 PBT% 1.1% -2.6% -4.8% PAT 3.0 -16.4 -25.8 Exceptional Items -30.6 -43.8^
PAT after Exceptional Items 3.0 -47.0 -69.6
Following successful implementation of Project Phoenix and Project Prakram and with the market reviving, Sylvania‘s operating profitability started improving in 2009-10.
Table 12: Quarterly Performance of Sylvania During and Post-Restructuring
€ million Q4, 2008- 09 Q1, 2009-10 Q2, 2009-10 Q3, 2009-10 Q4, 2009-10 Q1, 2010-11 Q2, 2010-11 Q3, 2010-11 Revenue 116.2 106.8 105.6 114.7 107.9 108.1 117.7 125.3 Growth (%) -9% -8% -1% 9% -6% 0% 9% 6% EBITDA 2.8 0.5 0.6 -5.4 1.8 4.8 5.5 6.6^ EBITDA margin (%) 2.4% 0.5% 0.6% -4.7% 1.7% 4.4% 4.7% 5.3% Depreciation 3.1 2.5 2.2 2.1 2.1 2.1 2.1 2.0 Interest 3.1 3.4 3.1 0.8 4.8 2.9 2.2 2.7 PBT before Exceptional Items -3.4 -5.4 -4.9 -8.4 -5.1 1.2 2.5 1.9 Exceptional items 18.6 5.9 6.3 25.1 3.1 0.6 0.0 1.1 PBT -22.0 -11.3 -11.2 -33.5 -8.2 0.6 2.5 0.4 Tax 0.6 0.3 -1 0.4 5.2 1.0 1.2 0.7 PAT -22.7 -11.6 -10.2 -33.9 -13.4 -0.4 1.3 -0.3
Source: Company’s quarterly reports
^ Normalised EBITDA excludes tax payment made in Brazil for previous years for € 2.4 million and treated as other income/ expenditure
Apart from the successful completion of the restructuring programmes and the sales revival in key regions, the launch of operations in emerging markets also contributed to the improvement in Sylvania‘s margins from Q4, 2009-10 onwards. The established global players in the lighting industry are increasingly focusing on emerging markets for future growth. Already, Philips and Sylvania‘s share of revenues from emerging markets has increased to ~40% now from around 30% in the quarter ended March 2009. Based on growth trends observed, the share is expected to increase further over 2010-11(E) to 2012-13(E).
Future growth to be driven by emerging markets; profitability vulnerable to adverse movements in foreign exchange With Sylvania planning to launch operations in other emerging markets such as Malaysia and China, growth in its top line is expected to be higher in the next few quarters. Sales from Latin America (LATAM), another developing region, have grown consistently since Q2, 2009-10, which together with the decline in sales from Europe, has led to an increase in LATAM‘s share in the total sales to 31% in Q2, 2010-11 from 26% in Q1, 2009-10. In 9M, 2010-11, sales from the LATAM region reported an increase of 35% over the corresponding previous, although part of it can be attributed to favourable currency movements. While Sylvania as of now has a limited presence in Asian markets, which account for 5% of its total sales, growth in the region has been healthy. Sylvania‘s sales in Asian markets increased by 69% in 9M, 2010-11 over the corresponding previous to €11.35 million.
Launch of Project Phoenix (Jan ‘09)
Conclusion of Project Prakram (Sep ‘10)
Figure 13: Market-wise Revenue Break-up for Sylvania
Source: Company’s Quarterly reports
Figure 14: Market-wise Revenue Break-up for Philips
Source: Philips’ Quarterly reports
Gradual improvement in profitability Emerging markets, 28% Emerging markets, 36% Developed markets, 72% Developed markets, 64% 0% 20% 40% 60% 80% 100% 1Q09 2Q09 3Q09 4Q09 1Q10 2Q10 3Q10 4Q10 Emerging markets, 30% Emerging markets, 36% Developed markets, 70% Developed markets, 64% 0% 20% 40% 60% 80% 100% 1Q09 2Q09 3Q09 4Q09 1Q10 2Q10 3Q10 4Q10
Table 13: Quarterly Revenue Growth in Sylvania's Markets €million Q4, 2008-09 Q1, 2009-10 Q2, 2009-10 Q3, 2009-10 Q4, 2009-10 Q1, 2010-11 Q2, 2010-11 Q3, 2010-11 Europe 77.72 70.63 65.48 77.33 76.83 64.95 65.59 74.10 Growth (%) -9% -7% 18% -1% -15% 1% 13% LATAM & US 28.75 24.89 25.95 27.53 29.04 32.65 37.56 35.60 Growth (%) -13% 4% 6% 5% 12% 15% -5% Asia 3.74 3.62 2.93 2.88 4.04 5.47 5.88 04.62 Growth (%) -3% -19% -2% 40% 35% 7% -21% Other -1.75 -1.6 1.74 -1.27 -1.35 0.82 0.58 1.59 Total 108.46 97.28 95.88 106.69 109.01 104.21 109.85 115.91 Growth (%) -9% -10% -1% 11% 2% -4% 5% 6%
Source: Company’s Quarterly Reports
Going by the current trends, we expect Sylvania‘s sales to report a CAGR of 10% in the LATAM region and of 31% in the Asian region (as a result of entry into newer markets); we expect the company‘s sales in the European region to decline marginally in 2010-11 and stabilise at that level over the next three years. Further, taking into account the cost savings from the restructuring programmes, we expect Sylvania to report an EBITDA of ~€21 million (EBITDA margin ~4.5%) in 2010-11. The EBITDA margin, however, is exposed to the risk of adverse fluctuations in foreign exchange (forex), given Sylvania‘s increasing exposure to emerging markets – both in terms of outsourcing of manufacturing as well as sales. Thus, a strong appreciation in currencies of countries from where the products are imported or depreciation in currencies of countries of major export can adversely affect the company‘s earnings. To reduce this risk, the company is focusing at localising sales and procurements in key markets such as LATAM, thereby providing benefit of natural hedge. Further, the company is also increasingly focusing at localising outsourcing and borrowings in countries like India and China – that are the key outsourcing destinations for the company. Although this reduces the adverse impact of foreign currency movements to an extent, the company‘s earnings would continue to be susceptible to the forex risk, given the increasing percentage of sales in new geographies.
Switchgears
Most profitable segment for company
In the switchgears segment, Havells‘ product range includes domestic switchgears, modular switches, and low-voltage industrial switchgears4. The domestic/retail segment is a small portion of the total switchgear market (about 15%), but Havells enjoys robust profit margins here because of its leadership position and targeted customer segment. Although sales from industrial switchgears are limited (~30% of total segment sales) at present, Havells is making efforts to expand its presence in the Rs. 7,130 crore low-voltage industrial products category.
About 70% of the revenues in the switchgears segment come from domestic switchgears and modular switches, where Havells is able to price its products at par with international brands such as Legrand and Schneider Electric. Moreover, Havells has a wider distribution reach than its close competitors, which enables it to capitalise on the growth happening in Tier-II and Tier-III cities.
Currently, Havells is the market leader in the Rs 1,200 crore domestic switchgears market, having increased its market share to about 20% in 2009-10 from 15% in 2005-06. Its market share in modular switches has
also improved significantly to 15% from just 5% in 2005-06, helped by Crabtree‘s premium image and easy availability. The company currently faces limited competition in modular switches, as the only premium brands available are Legrand, Schneider and Anchor Roma.
Future growth expected to be driven by construction of new houses and increasing disposable incomes Domestic switchgear and modular switches are expected to
benefit from the current demand for premium urban housing and rising disposable incomes. According to the Ministry of Urban Housing5, the total requirement of urban housing during the XIth Plan period (2007-2012) works out to 2.65 crore dwelling units (combining the housing shortage at the beginning of the Plan period), which would sustain demand for domestic switchgear and switches. Although a large proportion of this shortage involves low-end housing, around 40% of the total housing units would be worth Rs. 25 lakh and more—the target segment for switchgears and switches.
4
The switchgears industry can be broadly classified in two segments: domestic/ commercial (low voltage) and industrial switchgears (medium and high voltage). However, for Havells, the potential market considered is just the low-voltage segment because of its product focus. 5
Report of the Technical Group constituted by the Ministry of Urban Housing Switchgears and Electrical Switches
Domestic/ Commercial (Rs. 2,200cr) ACBs, MCCBs, Switch fuse unit, Changeovers etc. (Rs. 1,200 cr) Modular Switches (Rs. 1,000 cr) LV Industrial (Rs. 7,130 cr) Control gears, starters and panels (Rs. 5,340 cr) Switchgear (Rs. 1,790 cr) < Rs.15 lakh, 37% Rs.15-25 lakh, 25% Rs. 25-50 lakh, 22% > Rs. 50 lakh, 16%
Switchgears: Key Drivers and Challenges
Growth Drivers
Real estate activities in metros, Tier-I and Tier-II cities
Increasing personal disposable incomes
Increasing consumer awareness
Changing lifestyles leading to greater preference for modular switches
Key Challenge
Establishing market share in new products to be launched in low voltage industrial switchgears, given presence of large players such as L&T, ABB and Siemens.
Table 14: Product-wise Break-up of Havells’ Switchgear Revenues
% of total
Industrial 23%
Domestic 49%
Modular Switches 20%
Others (Capacitors & Motors) 9%
Total 100%
Source: Company data, ICRA Online’s estimates
Figure 15: LV Switchgears Market in India
Source: Company, ICRA Online Research
Note: Havells also includes capacitors and motors to calculate revenues from Switchgears segment
Figure 16: Price- wise Break-up of Proposed Housing Units
The domestic switchgear segment is also expected to benefit from rising consumer awareness, as the expenditure on miniature circuit breakers (MCBs) generally accounts for less than 0.1% of the total cost of a house, but significantly reduces the risk of damage from short circuits and electric current leakages. Moreover, the expenditure on domestic switchgear being a one-time outlay (about Rs. 2,000 for a three bedroom-hall-kitchen house), we believe switchgears would be affordable for a large part of the targeted population.
While the size of the domestic market for electrical switches is estimated at Rs. 2,200 crore, only 46% of this is accounted for by modular switches, and just around 10% of households use them because of their higher prices. While the electrical switches market is expected to grow at an annual rate of 9-11% over the next five years, we expect the growth to be faster for modular switches, given the rising disposable incomes.
Nevertheless, the high dependence of switchgears and switches on real estate growth, especially premium housing, exposes them to the cyclicality inherent in the sector. Havells‘ revenue growth in this segment slowed down to 7% in 2008-09 because of the economic slowdown, and a repetition of the same cannot be ruled out in case GDP growth falters.
Table 15: Expected Movement in Havells' Market Share
2009-10 2010-11(E) 2011-12(E) 2012-13(E) Domestic Switchgear
Industry Sales Rs. Crore 1,200 1,380 1,587 1,825
Growth % 15% 15% 15%
Havells‘ Market Share % 22% 22% 22% 22%
Modular Switches
Industry Sales Rs. Crore 1,000 1,150 1,323 1,521
Growth % 15% 15% 15%
Havells‘ Market Share % 16% 16% 16%
Source: Company, ICRA Online’s estimates
Company plans to diversify into high-growth industrial switchgears, but benefits would accrue only over long term Havells, which currently caters to only a small part of the total switchgears market, plans to expand its product portfolio so as to be able to address the larger market, consisting of industrial switchgears. The industrial switchgears segment is expected to report strong growth during the next few years on the back of the significant expenditure planned in the power sector and in industrial construction. However, Havells is currently a marginal player in this segment as compared with established companies like Larsen and Toubro (L&T) and Siemens. Although Havells started off as an industrial switchgear company, it reduced the focus on this business over the years to target the high potential consumer electrical market. The company is now building up its product portfolio to re-enter this segment. Given strong competition from players like L&T, we expect the growth in the industrial switchgears segment to be modest in the next two to three years.
Electrical Consumer Durables
Till 2009-10, the Electrical Consumer Durables (ECD) division of Havells had just one product—electric fans. Now it has two, with the recent launch of electric water heaters.
One of the fastest growing segments for Havells, benefiting from rapid growth in electric fans demand and increase in market share
The revenues of the ECD division reported a sharp increase till 2009-10 on the strength of high growth in the electric fans industry and the substantial increase in Havells‘ market share during 2006-09. The electric fan industry is now worth about Rs 3000 crore, with Havells controlling around 12% of the market. Despite being a relatively late entrant (the ECD division was started only in 2004), the company has managed to place itself among the top five players in the industry that control about 80% of the market. The company has been able to grow its market share from 6% in 2006 to 12% in 2010 largely on account of its marketing strategy wherein a number of additional product features were offered, while the product was offered at prices almost similar to that of the market leader (Crompton Greaves). Moreover, as Havells‘ fans cater to the premium segment, the growth can be attributed to rising incomes and quality consciousness of Indian consumers. Havells‘ also supported its strategy by aggressive advertising, and a unique energy saving proposition offered in the form of 50W fans.
Moreover, Havells has been able to overtake established, but single-product companies, on the strength of its extensive distribution network. The importance of distribution network in the case of home electronics and kitchen appliances is highlighted by the findings of Technopak (a market research company), whichindicates that ~79-85% of customers are willing to travel only up to 2km for the intended purchase.
In raising its market share at a brisk pace over the period 2006-10, Havells was also able to capitalise on one of the fastest growth periods of the domestic electric fans industry, which reported a CAGR of 18% between 2003-04 and 2009-10E. The growth was largely driven by the real estate boom and the increase in disposable incomes, as replacement demand for fans has historically been limited, since older generation fans generally had a long life span extending up to 20 years. During 2009-10, the revenues of the key players in the electric fans industry increased by a substantial 30% or so, but the spike may partly be attributed to pent-up demand.
Healthy growth prospects for domestic electric fans industry
The domestic electric fans industry is expected to grow at about 30% in 2010-11 with real estate activities picking up once again; the uptrend is already reflecting in the half-yearly numbers of the major fan manufacturers like Havells and Crompton Greaves. Beyond 2010-11, we estimate a growth rate of 18-20% over the next two years. Thereafter, we expect the growth rate to moderate to less than 15% because of the base effect, but see the industry as continuing to benefit from two additional upsides: increasing availability of power and shorter lifespan of newer generation fans.
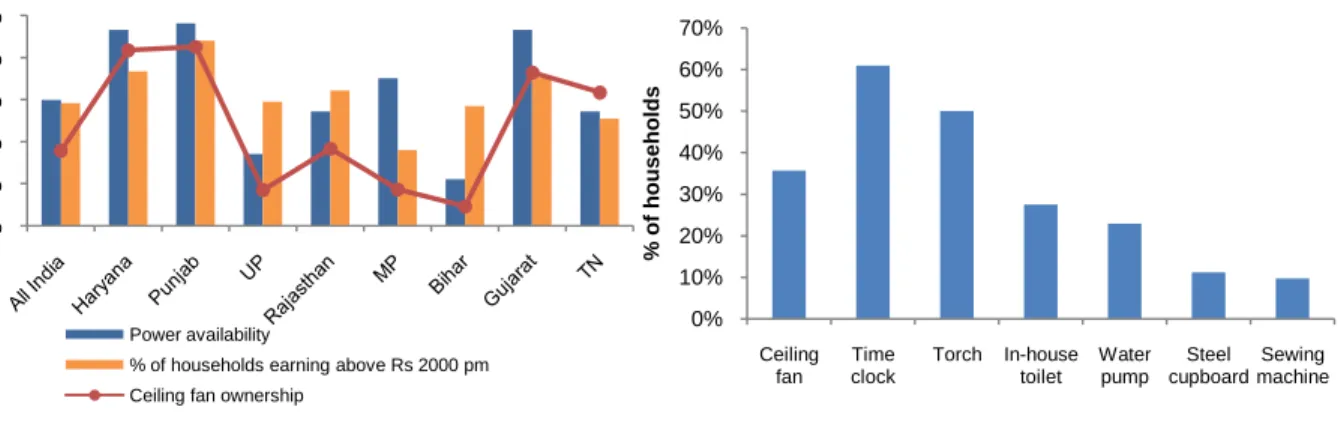
In rural India, the ownership of fans is closely linked to power availability, especially in States where disposable incomes are high. Although Punjab and Haryana are well-penetrated, Havells can benefit from increased power supply and rising rural incomes in Uttar Pradesh, Rajasthan and Bihar, where higher incomes have not yet fully translated into fan purchases because of power shortages. Although the key beneficiaries of this trend would be companies that manufacture lower-priced fans, we expect Havells to capture the affluent households in these regions. Also, a ceiling fan is almost a necessity in the hotter regions of India. As per the findings of a survey conducted by Max New York Life and NCAER, fan ownership ranks higher than ownership of manual water pumps and steel cupboards among rural households.
0% 5% 10% 15% 20% 25% 30% 35% 0 400 800 1,200 1,600 2,000 2,400 2,800 A nnual Grow th ra te R s . C rore
Electrical Consumer Durables: Key Drivers and Challenges
Growth Drivers
Increased penetration of electricity in rural areas
New product launches
Changing lifestyles and disposable incomes
Key Challenges
Loss of market share in electric fans
Intensifying competition in the electrical appliances market
Source: CMIE, ICRA Online’s estimates
Havells’ market position in fans expected to remain strong, with growth supported by adequate spare capacities Havells‘ competitive strength in electric fans is indicated by the pricing premium that its fans are able to command in the market, even against the products of other established players like Crompton Greaves and Bajaj Electricals. Moreover, Havells only sells fans priced above Rs. 1,000 each, which shields it from the intense competition from cheaper Chinese products in the lower end of the market. With the size of the Indian middle class growing, we expect the share of high-end fans to increase gradually.
Table 16: Electrical Fans—Peer Comparison
Amounts in Rs. Crore Revenue Revenue Growth Incremental
Revenues Realisation Company 2008-09 2009-10 2008-09 2009-10 2009-10 2008-09 2009-10 Havells 275.3 357.6 14% 30% 82.3 1,229 1,202 Crompton Greaves 598.3 764.5 20% 22% 166.2 1,068 1,176 Usha International 357.4 495.2 13% 37% 137.8 988 1,004 Bajaj Electricals 296.5 379.3 21% 28% 82.8 933 943
Orient Paper & Industries 291.0 384.0 -16% 36% 88.5 914 903
Khaitan Electricals 195.7 258.0 -20% 32% 62.3 945 927
Note: Orient Paper exported fans worth Rs. 48 crore out of the revenues mentioned, resulting in a lower share in the domestic market. For calculating incremental revenues in 2009-10, adjustment for export sales has been made
Source: Companies’ Annual Reports, ICRA Online’s estimates
The growth in Havells‘ electric fan sales is expected to mirror the growth of the industry over 2010-11(E) to 2012-13(E). Incremental growth in market share is not expected to be substantial because of intense competition from Crompton Greaves and Bajaj Electricals. The latter, for instance, has a tie-up with China-based Midea (world‘s largest fan company), which would help it introduce newer models. Havells however does benefit from having the third largest fan manufacturing capacity in India, with ample spare capacity to service volume growth of 15-20% over the medium term. The company‘s facility at Haridwar (Uttarakhand) is the largest integrated fan manufacturing factory in India, which allows it to have a cost advantage over other players that outsource production to other smaller units in India.
ECD division displays strong profitability, but full impact on EPS would be felt only after new product launches The profit margins of Havells‘ ECD division are robust because of premium pricing, which makes it the second-most profitable segment for the company. However, the division‘s overall contribution to the company‘s 2009-10 standalone revenues was just around 15% (about 6.6% on a consolidated basis), which limited the impact of the benefit on the EPS. As the ECD division is expected to demonstrate the highest revenue growth (CAGR of 22%) among all segments during 2010-11 to 2012-13(E)
0% 20% 40% 60% 80% 100% 0 20 40 60 80 U nit s i n la k hs
Installed capacity Units sold Utilisation
0% 10% 20% 30% 40% 50% 60% 70% Ceiling fan Time clock Torch In-house toilet Water pump Steel cupboard Sewing machine % o f h o u seho ld s 0% 20% 40% 60% 80% 100% % of ho us e ho lds Power availability
% of households earning above Rs 2000 pm Ceiling fan ownership
Source: The Max-NCAER Financial Protection Survey
Figure 18: Region-wise Power Availability and Fan Penetration Figure 19: Ownership of Household Goods in Rural India as per Survey
Source: The Max-NCAER Financial Protection Survey
Figure 20: Capacity Utilisation across Major Fan Manufacturers
because of new product launches while sustaining EBITDA margins close to 22%, it is expected to be the key contributor to Havells‘ future EBITDA growth (on a standalone basis).
Table 17: EBITDA Margin Comparison for ECD Segment
Note: For Havells, EBITDA margin has been calculated by adjusting the contribution for unallocated expenses that have been apportioned among the four segments on the basis of sales
Source: Companies’ Annual Reports, ICRA Online’s estimates
While the contribution margins in Havells‘ ECD division improved to 28% in 2009-10 from about 21% in the previous two years, we believe this improvement largely reflects the softening of raw material prices over the last one year (reduction in raw material prices was not reflected in lower MRPs). Nonetheless, over the medium term, the margins would be supported by increasing capacity utilisation and scale benefits when new products are introduced using a common distribution network. Moreover, Havells‘ water heaters are catering to the premium segment, which allows it to earn adequate profits on the same. Future growth to be driven by new products such as water heaters, but company would face intense competition in new categories
We expect future profit growth of Havells‘ ECD division to be driven by new product launches such as water heaters. The size of the water heaters market is estimated at Rs. 800 crore, and it is expected to grow at about 20% per annum over the medium term, driven by rising disposable incomes, currently low penetration levels (only about 1.7 crore households own water heaters as of 2009-10). Havells has targeted the premium consumer segment and expects to capture a market share of 5% by 2011-12, which is achievable considering the unique product attributes offered by the company, such as prevention of electric shocks and highest power efficiency (five-star rated). We expect additional revenues of Rs. 50-60 crore from water heaters from next year onwards, which should sustain growth of the ECD division.
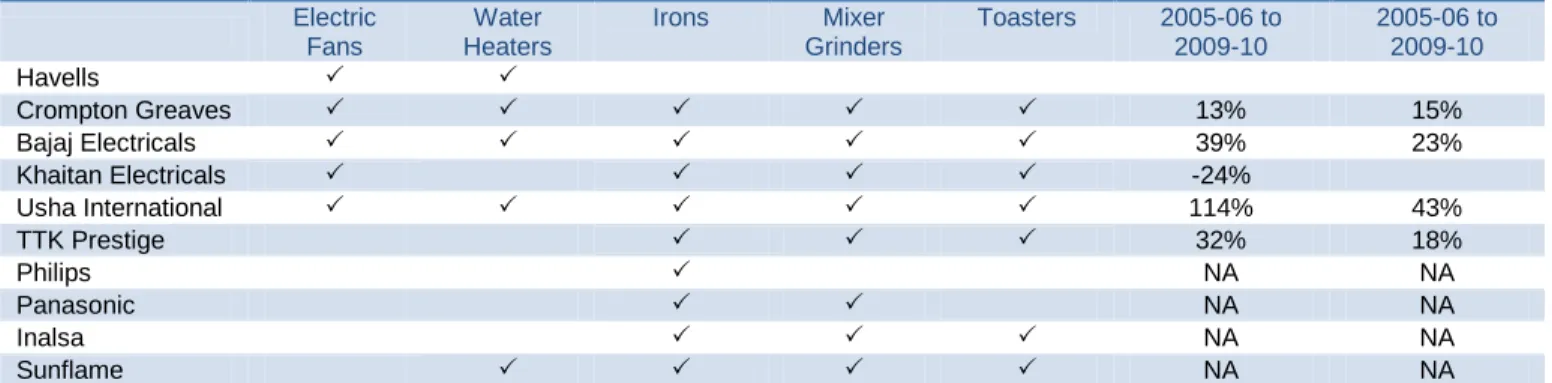
The various listed players present in the electric appliances industry have reported strong profit growth during the past five years, and since this business is driven by rising disposable incomes and availability of power, we expect the electric appliances industry to grow at a healthy pace over the medium term. However, the electric appliances industry is already cluttered, featuring both premium MNC brands like Philips, Panasonic and Morphy Richards (owned by Bajaj Electricals) and relatively inexpensive brands like Sunflame, Prestige, Usha and Inalsa. Even retail chain owners like the Future Group have launched their in-house brands (Onkyo), which are priced much lower.
Table 18: Product Portfolio and Growth Trend for Domestic ECD Companies
Electric Appliances Kitchen Appliances EBITDA CAGR
of ECD Business Revenue CAGR of ECD Business Electric Fans Water Heaters Irons Mixer Grinders Toasters 2005-06 to 2009-10 2005-06 to 2009-10 Havells Crompton Greaves 13% 15% Bajaj Electricals 39% 23% Khaitan Electricals -24% Usha International 114% 43% TTK Prestige 32% 18% Philips NA NA Panasonic NA NA Inalsa NA NA Sunflame NA NA
Source: Companies’ Annual Reports and websites, ICRA Online Research
Company EBITDA margin
2008-09 2009-10
Havells 13.4% 19.8%
Crompton Greaves 11.6% 14.7%
Bajaj Electricals 9.4% 12.8%
Orient Paper & industries 10.8% 13.5%
Khaitan Electricals 3.7% 6.4% TTK Prestige 9.9% 16.2% 0% 5% 10% 15% 20% 25% 30% % E BIT DA m a rg in
Figure 21: Movement in EBITDA Margin for Havells’ ECD Division
Source: Company’s Annual Reports, ICRA Online’s estimates
Sudden spurt because of favourable raw
material price movement
Despite intense competition, we believe Havells is well poised to capitalise on the high growth potential of the electric appliances industry, given the company‘s:
established brand image and distribution network;
launch of products in less cluttered categories, such as 5-star rated appliances that appeal to energy conscious customers, and targeting of unexplored niches like Residual Current Circuit Breakers (RCCBs) in the case of water heaters, which make the appliance electric shock proof; and
ability to command price premium on the strength of differentiated products, established brand and distribution reach, as seen in fans and switchgear, and even in water heaters, which command a significant price premium over competing products of existing players.