Performance study of a standalone direct pumping photovoltaic
system used for drip irrigation
Assia. Harkani
1,2*, Abdellah. El Aissaoui
2, Hicham. Fihri Fassi
1, Ousama. El Kacimi
2 (1. Laboratory engineering, industrial Management and Innovation FST, Settat 26000,Morocco;2. Laboratory of agricultural machinery, INRA,Settat 26000, Morocco)
Abstract: Photovoltaic (PV) energy attracts more people to pump water as a friendly environment technology and provide autonomy in many remote areas. Morocco characterized by its important solar potential, promote use of this alternative energy in agriculture. Photovoltaic water pumping systems (PVWPS) coupled directly to drip irrigation network represents an affordable technique that can be promoted without use of any capacitive device for electric or hydraulic energy storage. This paper aims to study performances of a standalone photovoltaic pumping system confronted to actual behaviour of incident irradiance. The system is based on a photovoltaic generator, a maximum power point tracking (MPPT) and direct curent (DC) converter, and a DC diaphragm pump connected to calibrated (Flow versus Pressure) orifices to simulate small drip irrigation network, mounted in parallel scheme to vary the pump operating point according to timely varied irradiance. The result showedthat daily trend of solar irradiance influence considerably operating behaviour of the pump, consequently the performance of the standalone PV system is affected as there is inadequation between charges of the PV generator and the DC pump. The hydraulic efficiency trends showed a dispersion and varying performances according to irradiance change and to hydraulic system unstability. A method of governing hydraulic performance is proposed to improve the system efficiency and pressure stability as requirements for water distribution uniformity in drip irrigation network supplied by a standalone PV pumping system.
Keywords: standalone, photovoltaic pumping system, performances, irradiance, efficiency, MPPT, DC pump
Citation: Harkani, A., A. El Aissaoui, H. F. Fassi, and O. El Kacimi. 2019. Performance study of a standalone direct pumping photovoltaic system used for drip irrigation. Agricultural Engineering International: CIGR Journal, 21(3): 114–122.
1 Introduction
In many parts around the world and in developing
countries, agriculture production is mainly based on
rainfall for crop production and something on small
pumping systems based on groundwater for irrigation. In
Morocco, small scale farming is dominant and needs
significant technological solutions for improving it’s
subsistence.
In the last decades, agricultural production systems
are most vulnerable to energy prices rising (fuel and
electricity) and consequently final costs of agricultural
Received date: 2017-11-27 Accepted date: 2019-05-20
* Corresponding author: Assia Harkani, PhD student, Laboratory of Agricultural Engineering, INRA, PO Box 586 Settat 26000, Morocco. Email: [email protected]. Tel: 00212 65-202- 9341.
products are influenced.
According to subsequent fuel price rising, farmers
transformed their diesel based irrigation pumping systems
to butane, meanwhile butane is considered as a low cost
energy that is subsidized. Approximately more than
100000 ha that are irrigated in this way, with a
consumption of 3349.1010 KJ year-1 (Moumen, 2014).
As alternative, the promotion of using alternative energy
is becoming important according to existing average
irradiance in Morocco (about 2.253 kW hm-2 year-1) (Giz,
2011). Moroccan government initiated a national program
on photovoltaic pumping in 2013 to promote irrigation
pumping for small scale farming representing a
workforce of 90% and an area of 44% (Missaoui, 2014).
Odeh et al. (2006) compared PV water pumping system
to diesel based system, and showed better technical and
capacities up to 8000 m4/d, 4100 m4/d and 2600 m4/d for
interest rate values of 0% (subsidized project), 10%
(average market rate developing countries) and 20%
(high market rate), respectively.
Photovoltaic water pumping systems (PVWPS) are
mainly used for drip irrigation to save energy and water
and promote sustainability of farming systems (Reca et
al., 2016). Performance of PV pumping systems for
irrigation depends mainly on its design. Sizing is
considered as the important step that could lead to system
reliability and cost effectiveness (Renu et al., 2016).
However, knowledge on crop, soil and irrigation systems
adaptation are required (Firatoglu and Yesilata, 2004;
Glasnovic and Margeta, 2007; Gad and Safya, 2011).
Adaptation of PV panels to pump requirement cannot be
fullfiled without integration of a robust energy conversion
of Direct Current to Alternating Current (DC-AC) or
Direct Current to Direct Current (DC-DC) for a pumping
systems performances. Several studies were done on
PVWPS performance and use maximum power point
tracking (MPPT technologies) (Sefriti and Boumhidi,
2015). Akihiro et al. (2009) simulated PVWPS
performance using MPPT algorithms of Incremental
Conductance (IncCond) and Perturb and Observe (P&O)
on Matlab/Simulink. They found that low efficiency of
PVWPS can be improved by 35% using MPPT
technology and the system valorized more than 99% of
the PV panel’s energy to satisfy more than 87% of water
requirement. Khan et al. (2012) studied performance of
standalone PVWPS based on DC-DC converter coupled
to a DC pump. The system efficiency has been improved
by integrating close loop control with DC-DC buck
converter to increase its daily pumping output. Essam et
al. (2017) developed a standalone PVWPS based on
batteries energy storage to drive brushless direct current
(BLDC) motor-pump. They proposed an integrated
control strategy based on use of MPPT, speed control and
hysteresis current of the BLDC motor and batteries
charging/discharging optimization to improve an overall
system efficiency.
In last decades, use of DC pumps has been promoted
to improve performance of PV based irrigation systems.
In fact, technologies emergence of BLDC motors and
positive displacement pumps improved cost effectiveness
by decreasing maintenance rate and efficient use of DC
pumps in PV agricultural irrigation. Compared to
centrifugal pumps, positive displacement pumps are
characterized to efficiently work at high pressure (more
than 100 m) and low flow rate requirements. But, it
cannot be appropriate to be associated directly with PV
panels without adequate linking between photovoltaic
energy input and irrigation network charge. Positive
displacement pumps are only used for DC low-voltage
applications (24 to 48 V) to deliver small daily flows (up
to 5 m3 day-1). Hamidat et al. (2003) studied performance
of PVWPS using both centrifugal and positive
displacement pumps. They used a multistage centrifugal
pump coupled to alternating current (AC) motor and
three-phase inverter. The second pump is coupled to
DC-DC converter actuating a BLDC motor. They showed
that the positive displacement pump was an efficiency of
45% compared to centrifugal pump efficiency reached
only 14%. In other study, Hamidat and Benyoucef (2008)
compared PVWPS performances of centrifugal and
positive displacement pumps simulation for different sites
characterized by atmospheric conditions (Saharan climate
and raining in summer). A comparison between electrical
and hydraulic performances of both centrifugal and
positive displacement pumps showed better efficiency,
less energy losses and high water volume pumped by the
positive displacement pump. Protogeropoulos and Pearce
(2000) and Kashyap et al. (2013) stated that more
improvements are needed for standalone PVWPS to
satisfy water demand in small drip irrigation systems with
control of surrounded pressure change due to influence of
daily insolation variation.
This paper aims to study performance of a standalone
PVWPS based on a DC positive displacement pump
faced to actual problem of overcoming hydraulic
instability of connected drip irrigation network due to
varying solar irradiance. Studying a standalone PVWPS
based on a DC pump is of importance to find better
adequation between pressure potential of a positive
displacement pump to deserve a hydraulic network
(mounted of parallel nozzles to simulate drip irrigation
lines). The parallel scheme simulates operating behavior
of a small drip irrigation system that requires a constant
2 Materials and methods
To evaluate performances of the standalone PVWPS,
a test bench (Figure 1) based on a PV panel (Monocrystal
Silicon Module, SharpTM 175Wp), an MPPT controller
(Victron Blue Solar 48/24/12V), a DC diaphragm Pump
(FLOJET, 12 VDC, 144W) and a hydraulic ramification
of seven identical calibrated orifices (Albuz, 11004,
1.3 L.min-1 at 3 bar) mounted in parallel scheme to simulate
outputs of a connected irrigation network and to evaluate
flow rate withreference to pressure potential created by
the pump using orifices hydraulic models (Q vs P).
Figure 1 Test bench of a photovoltaic DC pumping system without capacitance
The PV panel current (Ipv) and voltage (Vpv), the
MPPT converter current (Imppt) and voltage (Umppt) and
the pump downstream pressure are acquired during one
day from 8:00 am to 6:00 pm (sampling frequency of
100 Hz, sampling interval of 5 min hr-1).
The acquired data were treated to select
systematically five values per second for evaluating
electrical and hydraulic efficiencies according to pump
operating point behaviors influenced by variation of the
solar irradiance and number of the orifices switched on
(from one to seven).
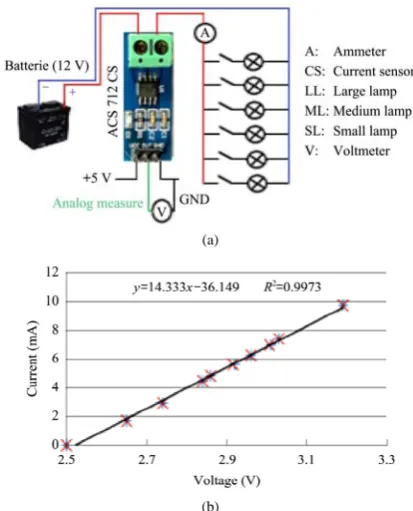
Voltage and current sensors (ACS712) were installed
at upstream and downstream points of the MPPT
converter to evaluate electrical power at the both levels
using Equations (1) and (2):
Ppv= Vpv×Ipv;
Pmppt = Vmppt×Imppt (1)
Ipv = (a1×Vs1) + b1;
Imppt = (a2×Vs2) + b2 (2)
where, Ppv, Pmppt, a1, b1, a2, b2, Vs1 and Vs2 arepower of
PV panel, power of MPPT converter, intercepts and
constants ofcurrent calibration curves and Voltages
sensors outputs, respectively. The operating pressure was
measured using an analogue sensor (Wika Tronic Line,
Pmax = 10 bar) mounted between the pump and the seven
orifices to evaluate its flow rate according to the
hydraulic models (Equation (3)):
Q = K×PX (bar) (3)
where, Q, P, K and X are flow rate (L min-1), pressure (bar),
discharge coefficient and exponent of the hydraulic orifice
model, respectively. The parameters K and X were taken
experimentally by calibration of the seven orifices (Table
1).
Table 1 Hydraulic parameters of the seven orifices
Orifices number K X
Orifice 1 1.1557 0.5006 Orifice 2 1.1718 0.5186 Orifice 3 0.5778 0.5384 Orifice 4 0.968 0.5745 Orifice 5 1.1576 0.5053 Orifice 6 1.1369 0.5042 Orifice 7 0.7663 0.4759
The current sensors were calibrated using an acid lead
battery source supplying a circuit of parallel mounted
automotive lamps (12 VDC, 55 W) (Figure 2(a)). The
calibration model is presented in Figure 2(b). All data
were acquired as voltage analogue input using LabviewTM
software and DAQ NI-6009data acquisition system. The
actual data were taken using the calibration curves
(Figure 2(b)) and Excel software.
(a)
(b)
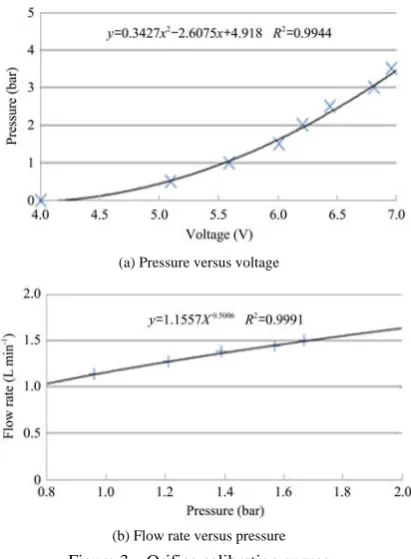
The orifices calibration curves (Figure 3) were taken
experimentally by varying pressure level according to
engaged number of orifices (from one to seven) to take
thirty five points of pressure vs flow rate. Figure 3(b)
shows the calibration curve due to one engaged orifice.
(a) Pressure versus voltage
(b) Flow rate versus pressure
Figure 3 Orifice calibration curves
The pump flow rate was computed according to the
orifice calibration curves obtained for each orifice. The
parameters of each orifice are represented in the Table 1.
The calibration curve of the pump was taken using
12 VDC acid lead battery and pulse width modulation
(PWM) to set the pump rotational speed (rotation per
minute or rpm) using two voltage supply of 6 and
12 VDC. Two pump calibration curves (referenced to
both voltages) were served as references curves (Figure 4)
to evaluate operating points of the pump and relatives
performances taken experimentally during the study day.
Figure 4 Pump calibration curves for 6 VDC and 12 VDC
Irradiance datas were taken using meteorological station
located at the research center (X: –7.624233, Y:
32.953487). The daily irradiance data occurred in May
25th, 2017 was taken as reference (Figure 5).
Figure 5 Daily solar irradiance of May 25th, 2017
3 Results and discussions
Performance of the PVWPS studied by monitoring
the pump behavior (From 8:00 am to 6:00 pm)
showedchanges of the pump efficiencyaccording to daily
solar irradiance.
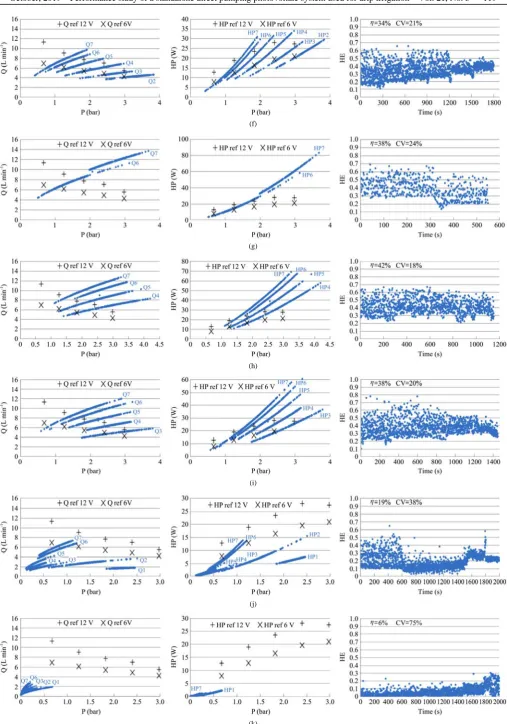
Figure 6(a) shows the pump response relative to low
irradiance of 90 W m-2 (8:00 am). Seven flow behaviors
are presented with reference to the number of engaged
orifices to displace the pump operating point as flow rate
decreasing causes pressure increasing. This displacement
show that is possible to operate pump not only to satisfy
requirement of operating the orifice around a stable and
predefined operating pressure (network requirement of a
drip irrigation system) but also to satisfy condition of
better performance. In fact, adaptation between the
number of engaged orifices and actual irradiance is needed
to actuate the pump around its better performance. As the
pressure is satisfied, a better performance is correlated
with an engaged part of the hydraulic network (number of
engaged orifices).
The characteristic curves, flow vs pressure [Q = f(P)]
and hydraulic power vs pressure [Ph = f(P)] don’t converge
with reference curves of the pump (Figure4) as solar
irradiance is lacking in the morning for the best
performance convergence.
Graph two (Figure 6(a) /8:00 am) illustrates varying
behavior of hydraulic powers due to the variation of flow
and pressure induced by variation of the number of orifices
operating point and prediction of its convergence for best
efficiency and/or for satisfying operating pressure required
for best uniformity distribution of connected drip
irrigation system.
Graph three (Figure 6(a)/ 8:00 am) shows the overall
system efficiency varying from 1% to 63% (average of
20%). This shown dispersion in efficiency is due to the
standalone system behavior as any capacitance is set to
regulate and stabilize instantaneous behavior of flow vs
pressure influenced by solar irradiance change.
Similarly, the system behavior (Figure 6(d)) at 11am is
influenced by low incident irradiance (385 W m-2).
Consequently, the pump efficiencies are affected. All
characteristic curves are kept below the reference curves
of the pump calibration using 6 and 12 VDC supplies
(Figure 4).
(a)
(b)
(c)
(d)
(f)
(g)
(h)
(i)
(j)
(k)
The system performance at 6:00 pm (Figure 6(k))
showed a behavior similar to of 8:00 am. This is
practically due to lack of incident irradiance (63 W m-2).
The third graph (Figure 6(k)) shows an efficiency varying
from 3% and 65% with an average of 20%. This difference
in flow/pressure behavior was induced mainly by
sunlight/shadow alternance occurred. As the pump not
performed at low level of sunshine, the flow/pressure
adequacy was required to optimize pump efficiency
according to adaptation of hydraulic equivalence model of
the connected orifices (effect of the orifices number
switched on). However, at 9:00 am, convergence of the
performance curves is observed (Figures 6(b), 6(c), 6(e),
6(f) and 6(g)) as irradiance at 9:00 am, 10:00 am, 12:00 am,
1:00 pm and 2:00 pm were important to operate the pump
without decreasing the number of operating orifices. The
superposition of the actual curves with the references
makes it possible to locate the optimal operating point of
the pump for each behavior (number of switched orifices).
The solar irradiance increase influenced positively the
pump efficiency to be more than 35%. The results obtained
at 10:00 am (Figure 6(c)) showed three hydraulic [flow vs
pressure; power vs pressure] behaviors. In fact, the
incident irradiance (533 W m-2) impacted the pump to
operate with three orifices that converge the operating
point to increase efficiency to be 49%. The system has
shown good hydraulic performance, since the pump holds
the maximum pressure (4.5 bar). According to mid-day
(12:00 am) irradiance (528 W m-2), the system showed
interesting performance (around 40%) as the hydraulic
characteristic curves are situated above the reference
curves and the number of switched on orifices is maximal.
In fact, the excessive irradiance (528 W m-2) made
possible to operate the pump with the maximum number of
orifices without inducing any decrease in the pump
efficiency as showed before in the morning incident
irradiance. At the midday, the system showed better
hydraulic performance as the pump reached the maximum
flow rate vs pressure characteristics (16 L min-1 vs
4.6 bar).
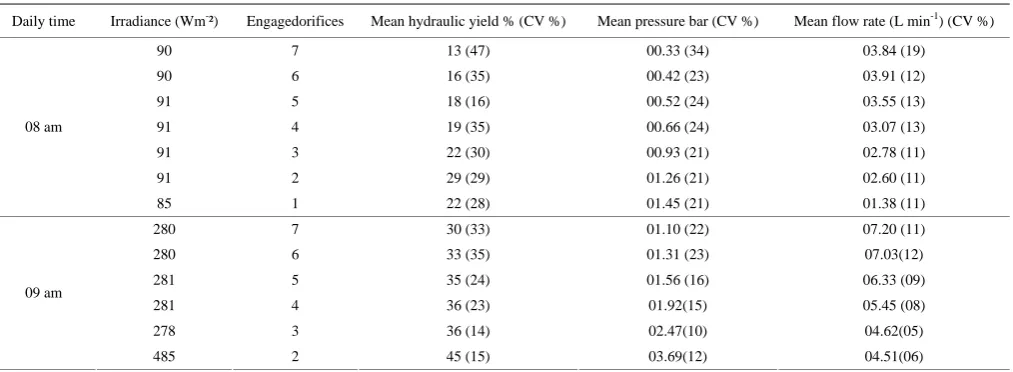
According to the pumping system response for each
configuration of the number of switched on orifices, a
significant dispersion in terms of efficiency is shown
Table 2. Table 2 summarizes the standalone system
behavior during a day, for low irradiance, the system
operates in normal mode ( all orifices switched on) with
low yields, while switching on orifices make the pump
operating point move to the optimal point which make the
system forced to perform (high yield). For high irradiation
the system performs in normal mode. There is a negative
influence of change in irradiance on the pump
performance for a standalone PVWPS if the pump
operating point kept static. In fact, the pump operating
point needs adjustment to maintain highly hydraulic
performance and pressure stability. The adaptation of the
pump operating point done using orifices switching on/off
is of importance to efficiently valorize actual irradiance at
upstream level to adequately fit it with a portion of a
connected drip irrigation network (number of switched on
orifices).
Table 2 Daily performance of PVWPS according to irradiance change and portion of switched on orifices (experimental test results)
Daily time Irradiance (Wm-²) Engagedorifices Mean hydraulic yield % (CV %) Mean pressure bar (CV %) Mean flow rate (L min-1) (CV %)
90 7 13 (47) 00.33 (34) 03.84 (19)
90 6 16 (35) 00.42 (23) 03.91 (12)
91 5 18 (16) 00.52 (24) 03.55 (13)
91 4 19 (35) 00.66 (24) 03.07 (13)
91 3 22 (30) 00.93 (21) 02.78 (11)
91 2 29 (29) 01.26 (21) 02.60 (11)
08 am
85 1 22 (28) 01.45 (21) 01.38 (11)
280 7 30 (33) 01.10 (22) 07.20 (11)
280 6 33 (35) 01.31 (23) 07.03(12)
281 5 35 (24) 01.56 (16) 06.33 (09)
281 4 36 (23) 01.92(15) 05.45 (08)
278 3 36 (14) 02.47(10) 04.62(05)
09 am
Daily time Irradiance (Wm-²) Engagedorifices Mean hydraulic yield % (CV %) Mean pressure bar (CV %) Mean flow rate (L min-1) (CV %)
540 7 49 (22) 02.78(15) 11.70(08)
538 6 49 (16) 02.99(15) 10.88(06)
10 am
520 5 47 (17) 03.27 (15) 09.32(08)
610 7 63 (09) 03.30(06) 05.70(07)
529 6 43 (08) 02.58(02) 05.89(01)
275 5 32 (09) 02.27(02) 05.07(01)
235 4 26 (07) 02.10(02) 04.62(01)
150 3 23 (12) 02.08(06) 03.50(03)
88 2 11 (08) 01.53(04) 02.44(02)
11 am
59 1 04 (28) 01.09(19) 01.06(04)
520 7 44 (22) 02.66(15) 11.46(08)
12 am
535 6 47 (15) 02.99(10) 10.90(05)
280 7 30 (31) 01.12(22) 07.27(12)
278 6 31 (25) 01.30(17) 07.04(09)
280 5 34 (24) 01.61(16) 06.44 (08)
281 4 36 (22) 02.08(15) 05.68(08)
275 3 35 (09) 02.60(06) 04.75 (03)
01 pm
110 2 39 (08) 03.33(06) 04.29(03)
520 7 44 (19) 02.67(12) 11.47(06)
02 pm
279 6 32 (25) 01.35(23) 07.14(12)
514 7 41 (21) 02.20(16) 10.36(08)
530 6 44 (17) 02.66(11) 10.24(06)
510 5 42 (17) 02.57 (17) 08.21(09)
03 pm
289 4 40 (15) 02.89(18) 06.75 10)
370 7 36 (26) 01.70(20) 09.04(11)
298 6 39 (26) 01.95(18) 08.70(09)
289 5 39 (19) 02.18(13) 07.55(07)
287 4 39 (14) 02.58(10) 06.40(05)
04 pm
278 3 36 (11) 02.83(12) 04.95(06)
130 7 23 (37) 00.69(25) 05.68(13)
130 6 23 (40) 00.72(28) 05.14(15)
130 5 12 (36) 00.30(25) 02.64(13)
130 4 13 (28) 00.35(19) 02.19(10)
130 3 14 (24) 00.47(19) 01.95(10)
130 2 27 (14) 01.40(16) 02.75(08)
05 pm
130 1 22 (06) 02.21(04) 01.72(02)
68 7 02 (76) 00.05(56) 01.36(31)
64 6 03 (72) 00.06(54) 01.33(29)
61 5 03 (63) 00.08(48) 01.31(26)
61 4 04 (52) 00.12(41) 01.23(22)
57 3 05 (52) 00.16(44) 01.09(23)
51 2 09 (41) 00.26(35) 01.15(19)
06 pm
79 1 16 (43) 00.36(41) 01.33(23)
4 Conclusion
The performance of a standalone PVWPS is monitored
under varying solar irradiance and varying hydraulic
operating point of the pump/orifices connection. The
portion of hydraulic network (number of switched on
orifices) can be simulated by an equivalent hydraulic
model of a defined number of a calibrated orifices. The
equivalent model of a given hydraulic circuit can be taken
experimentally as done in this work for establishing a
governing diagram of the performance pump with
reference to incident irradiance and to pressure setting
atdownstream level.
References
Essam, E. A., A. M. Zaki, and M. M. El-Sotouhy. 2017. Design and control of a standalone PV water pumping system.
Journal of Electrical Systems and Information Technology (JESIT), 4(2): 322–337.
Firatoglu, Z. A., and B. Yesilata. 2004. New approaches on the optimization of directly coupled PV pumping systems. Solar Energy, 77(1): 81–93.
Gad, H. E., and M. Safya. 2011. Using photovoltaic array for solar water pumping in Toshka region. In Proc. the fifteenth Fifteenth International Water Technology Conference. IWTC15, Egypt 1(1), 12, 28–30, May.
Giz, Aderee. 2011. Étude du potentiel de développement de l’énergie photovoltaïque dans les régions de Meknès-Tafilalet, Oriental et Souss-Massa-Drâa.
Glasnovic, Z., andJ. Margeta. 2007. A model for optimal sizing of photovoltaic irrigation water pumping systems. Solar Energy, 81(7): 904–916.
Hamidat, A., and B. Benyoucef. 2008. Mathematic models of photovoltaic motor-pump systems. Renewable Energy, 33(5): 933–942.
Hamidat, A., B. Benyoucef, and T. Artani. 2003. Small-scale irrigation with photovoltaic water pumpingsystem in Sahara regions. Renewable Energy, 28(3): 1081–1096.
Kashyap, M., S. Chanana, and A. J. Singh. 2013. Solar powered pmdc motor drive.In Proc.Conference on Advances in Communication and Control Systems (CAC2S), Dehradun, 18-22 April 2013.
Khan, A. Md. T., A. Md. Rishad, S. I. Ahmed, and S. I. Khan. 2012. Design and performance analysis of water pumping using solar PV. In Proc. 2nd International Conference on the
Developments in Renewable Energy Technology (ICDRET), 1–4. Dhaka, Bangladesh, 5-7 January.
Missaoui, R. 2014. Programme for large-scale deployment of solar pumping in irrigation water saving projects. Facilitating Implementation and Readiness for Mitigation (FIRM) Project, Morocco.
Moumen, M. 2014. Guide D’Irrigation Localize De L’Agriculteur. Maroc: FAO, Office Régional de la Mise en Valeur Agricole Doukkala.
Odeh, I., Y. G. Yohanis, and B. Norton. 2006. Economic viability of photovoltaic water pumping systems. Solar Energy, 80(7): 850–860.
Protogeropoulos, C., and S. Pearce. 2000. Laboratory evaluation and system sizing charts for a ‘second generation’ direct PV-powered, low cost submersible solar pump. Solar Energy, 68(5): 453–474.
Reca, J., C. Torrente, R. Lopez-Luque, and J. Martínez. 2016. Feasibility analysis of a standalone direct pumping photovoltaic system for irrigation in Mediterranean greenhouses. Renewable Energy, 85(C): 1143–1154.
Renu, B., P. Basudev, O. S. Sastry, K. Atul, and M. Bangar. 2017. Optimum sizing and performance modeling of solar photovoltaic (SPV) water pumps for different climatic conditions. Solar Energy, 155(15): 1326–1338.
Sefriti, B., and I. Boumhidi. 2015. Neural network incremental conductance MPPTalgorithm for photovoltaic water pumping system. In Proc. 10th International Conference on Intelligent Systems: Theories and Applications (SITA), 1–6. Rabat, Morocco, 20-21 October.
Nomenclature
Symbol : Meaning
AC : Alternating current.
BLDC : Brushless Direct Current.
DC : Direct Current.
HP(W) : Hydraulic Power
HE : Hydraulic Efficiency
Imppt : Output Current of MPPT.
IncCond : Incremental Conductance.
Ipv : Photovoltaïc Panel Current.
K : Discharge coefficient of nozzle
Ktep/ Koe : kiloton d'équivalent pétrole;
kilotonne of oïl equivalent
MPPT : Maximum Power Point Tracking.
P (bar) : Pressure
P&O : Perturb and Observe.
PV : Photovoltaïc
PVWPS : Photovoltaic Water Pumping System
PWM : Pulse Width Modulation
Q (L min-1) : Flow rate
Rpm : Rotation per minute
Umppt : Output Voltage of MPPT
Vpv : Photovoltaic Panel Voltage
vs : Versus