Chapter 1 –
Speed & Vectors
Math Reference
I) Significant Figures/ Scientific Notation
Significant figures
(or significant digits) correlate with the precision of ameasurement made by a person. In physics problems information is given in the form of times, distances, speeds, etc. that must have been measured by someone (even if the problem was 'made up'). The answer to the problem is limited by the precision of the information used, so the answer is rounded off to the appropriate number of significant figures. An answer with too many or too few significant figures is meaningless. For example, a meter stick is used to find the approximate length of a room. I place the meter stick on the floor and mark its end with my foot, then scoot the meter stick along until it reaches my foot, mark another meter and so on. I measure the length of the room as close to 11 meters -- I only know 2 significant figures for certain. Now for some reason I want to divide this length into three (3) equal parts.
11
m
3
=
3.666666667
m
, according to my calculator. This answer is absurd because: 1) it is far more precise than my originalmeasurement, and 2) I can't possibly measure one billionth of a meter with a meter stick. The correct answer is 3.7 m which has the same number of significant figures as the original measurement. The rules for determining the significant figures of a number are given below.
Rules for Significant Figures
For a whole number with no decimals -- only digits 1 through 9 are counted Example:54,800 5, 4, and 8 count 3 Sig. Figs.
Exception! The "Sandwich Rule" -- zero between two digits counts Example:5048 5, 0, 4, and 8 count 4 Sig. Figs.
For a whole number with a decimal point -- all digits (0-9) count Example:4800. 4, 8, and 2 zeroes count 4 Sig. Figs. For a number with a whole number and decimal part -- all digits (0-9) count
Example:54.003 5 Sig. Figs.
For a number with only a decimal part -- all digits to the right of place-holder zeroes count Example:0.00420 4, 2, and last 0 count 3 Sig. Figs.
For Exponents -- Exponents are never significant.
Example:342 only the 3 & 4 are significant never the exponent 2 Sig. Figs. For Scientific Notation –only the numbers to the right of the times symbol can be significant.
Example: 3.4 x 10² only the 3 & 4 are significant never the numbers in the 10 or the exponent 2 Sig. Figs. For Addition or Subtraction - the answer is rounded off to the least number of decimal places of any of the given information used
Example:15.2 + 37.68 = 52.88, rounded to 1 decimal place 52.9
For Multiplication or Division - the answer is rounded off to the least number of significant figures of any of the information used Example: 5.34 X 92 = 491.28, rounded to 2 sig figs 490
Counting numbers (1, 2, 3, or ½…) and equivalencies (1 m = 100 cm) are exact and are not used to determine the number of sig figs.
Example: 14.6805 kg X 2 = 29.3610, 6 sig figs as in the first number.
Scientific Notation
A cumbersome number is more easily written and communicated using scientific notation which expresses the original as a decimal number (1 < X < 10) multiplied by a power of ten. . Only have 1 non zero number in front of the decimal (3.25 correct 0.325 incorrect 32.5 incorrect)
All significant figures must be included in the decimal number
If you have a big number, you need to move the decimal to the left, so the exponent for the 10 is positive.
Example: 32500 = 3.25 x 10000 = 3.25 x 10
4Or, since the decimal starts at the end of the number,
32500.
, you have to move the decimal 4 places left to put it between the 3 and the 2. If you have a small number, you need to move the decimal to the right, so the exponent for the 10 is negative.
Example: 0.00325 = 3.25 x 0.001 = 3.25 x 10
-3Or, to put the decimal between the 3 and the w, you have to move it 3 places to the right.
Your calculator and scientific notation: “E” means “times ten to the”. So, 3.25E4 means 3.25 x 10⁴ You can type this number into your calculator as “(3.25*10^4)” or use the EE button to type in “3.25 E 4”
Practice:
For each problem below, rank the following sets of numbers from smallest (1) to largest (4). 1) _____ 3.6 _____ 4.7 x 10² _____ 1.3 x 10⁴_____ 7.3 x 1032) _____ 3.6 _____ 4.7 x 10⁻² _____ 1.3 x 10⁻⁴ _____ 7.3 x 10⁻³
3) _____ 3.6 x 10² _____ 4.7 x 10² _____ 1.3 x 10²_____ 7.3 x 10²
4) _____ 0.73 _____ 4.7 x 10⁻² _____ 1.3 x 10⁴_____ 410
©Fyzics Softext Inc. page 1
Chapter 1 –
Speed & Vectors
Now determine the number of significant figures in each of the following. Write the number of "sig figs" for each to the left of the number, and then write each of the numbers using scientific notation to the right of the number.
5) ________ 15,700 = __________________ 10) ________ 0.038 = _______________________ 6) ________ 200,050 = _________________ 11) ________ 1125 = _______________________ 7) ________ 0.001250 = ________________ 12) ________ 0.00005 = _____________________ 8) ______ 0.010480 = ________________ 13) ______ 150,700 = 9) ______ 0.1480 = __________________ 14) ______ 40000 =
II) Rounding with Significant Figures
Physicists round answers to the correct number of “sig figs” in order to not represent more precision in their answer than the values used to reach an answer. Round by looking at the digit to the right of the last sig fig. If the number is 5, or greater, round up. Do not have a cascade of rounding by looking more than one digit to the right.
Practice:_ Round the following numbers to the given number of sig figs for each column.
1 Sig Fig 2 Sig Figs 3 Sig Figs 4 Sig Figs 15) 31,546,000 =
16) 123,456= 17) 3.141593 =
III) Equations
d
t
=
vt
t
It is often easier to work on a problem if you manipulate the equation, solving it for the unknown, before any substitutions
are made. Remember Algebra?
Example: d = vt is the original equation; solve it for v; and voila!
d
t=v or
v
=
d
t
Extra Explanation: d = vt states that ‘d’ equals ‘v’ times ‘t’. In order to isolate ‘v’ from ‘t’ one must use the inverse, or opposite, function. Since ‘v’ is multiplied by ‘t’, one must divide.
Practice: Solve each equation below for the variable indicated. 18) F = ma solve for m solve for a
19) d = ½at2 solve for a solve for t
20)
F
=
m v
2R
solve for m solve for v solve for R21) vf2 = vi2 + 2ad solve for a solve for d solve for vi
IV) Metric Units (SI) International System
SI prefixes from large to small:(meter, liter, or gram)
Base Unit
103 102 101 100 = 1 10-1 10-2 10-3
Additional SI prefixes used in physics:
1012 109 106 10-6 10-9 10-12
The MKS units are
Chapter 1 –
Speed & Vectors
Length Mass Time
Chapter 1 –
Speed & Vectors
Metric Units (SI) International System(continued)
Example: Use the equivalencies to the right for these conversions
Practice: Convert the following measurements to the new units shown. Show all work!
28) How many centigrams in a kilogram? ________________cg = 1Kg 29) Which is bigger a meter or a kilometer? ___________________________________________
V) Unit (or Dimensional) Analysis
Problems can be solved relying on units and unit cancellation. The original information from the problem is written in fraction form and then multiplied by factors that are composed of a numerator that is equivalent to its denominator until the required units are reached. Example: _ 75 mph = ?? m/s (mph is really miles per hour; mi/hr)
Practice: Solve the problems using unit analysis. 30) Change 18 m/s to mi/hr.
31) Change 35.5 mi/hr to m/s.
32) How many seconds are in one year? (HINT: final units should be seconds -- what about beginning units?) 33) Convert 75 cm/s to km/hr
34) Convert 85 km/hr to m/s.
35) Which would you rather have: a kilobuck or a megacent? Why?
36) Convert 4.2 cm/yr to m/s (This is the approximate rate of tectonic plate movement or how fast your fingernails grow!)
©Fyzics Softext Inc. page 4 75 mi 1 hr 1 min 1600
m
hr 60 min 60 s 1 mi
= 33.33333333 m 1 s
= 33 m/ s
22) 12.3 kg = ________g 23) 35 g = ________kg 24) 4.78 cm = ________m 25) 30 km = ________m 18) 63 cm = ________m 19) 0.03m = ________m
26) 0.12 mm = ________m 27) 6500 g = ________kg 20) 20 mm = ________m 21) 12.5 km = ________m
100 cm
= 35/100
= 0.35 m
1 m35cm
Complete these Equivalencies
1 m = _________cm
1 m = _________mm
1 km = _________m
1 kg = _________g
Chapter 1 –
Speed & Vectors
VI) Significant Figures & Rules for Doing Math
For Multiplication or Division - the answer is rounded off to the least number of significant figures of any of the information used Example: 5.34 X 92 = 491.28, rounded to 2 sig figs 490
Do the following calculations and round to the appropriate significant figure.
Assume all numbers are measured numbers
Problem
Answer without
Sig Figs
Answer with Sig
Figs
Problem
Answer without
Sig Figs
Answer with Sig
Figs
12 x 2 =
3.2 x 2.6 x 2.0 =
3.6 x 26.425 =
3.66/2.35 =
3.66 x 26 x 2 =
3.66/2 =
VII) Calculator Keys
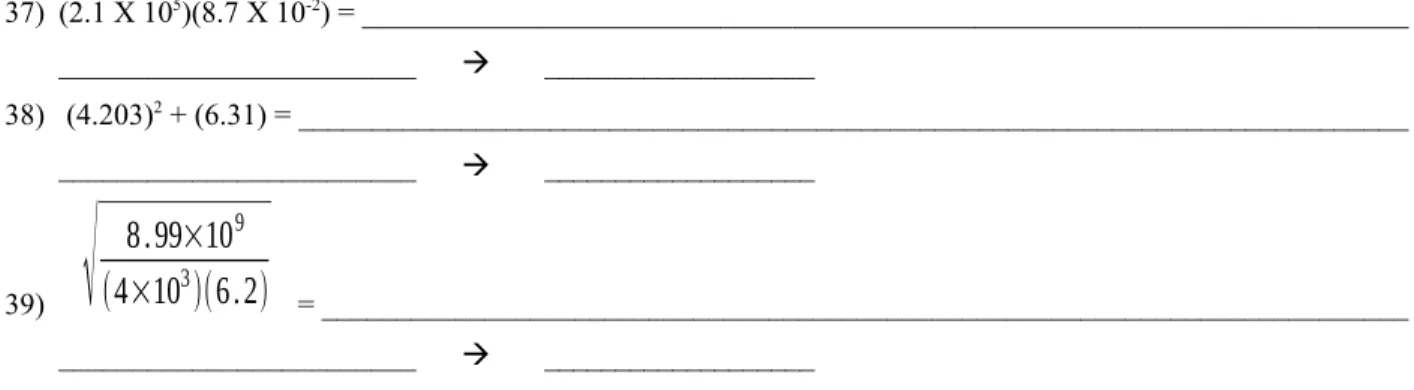
As you solve the following problems, use your calculator in an efficient manner and write down the exact keys used in the correct order. Once you have solved the problem, copy the complete answer given by your calculator and finally, the answer rounded to the correct number of significant figures.
37) (2.1 X 10⁵)(8.7 X 10⁻²) = ______________________________________________________________________
________________________ ___________________
38) (4.203)2 + (6.31) = ___________________________________________________________________________
________________________ ___________________
39)
√
8.99
×
10
9(
4
×
10
3)(
6.2
)
= _________________________________________________________________________________________________ ___________________
VIII) Slope
Slope = change in rise of change in run = Δy/Δx = (y2-y1)/(x2-x1) with coordinate pairs (x1, y1), (x2, y2)
40) What is the slope of the line that runs through the following two points: (2, 4) and (5,7)
©Fyzics Softext Inc. page 5
5 30
20
1 0 d (m)
t (s) 10
2 3 4
40
Graph #2
50 3
2
10 0
d (m)
t (s) 1
20 30 40
4
Graph #1
41) Showing all work below calculate the slope of graph #1
Chapter 1 –
Speed & Vectors
Speed
Going fast can be thrilling! But how fast is fast? Going fast on a bike is still much slower than going fast in a car, which is still much slower than a fighter jet. A medium speed in a car can
be much faster than most bicyclists, but much slower than a Formula 1 racecar at the speedway. Superman can travel "faster than a speeding bullet", but just how fast is a speeding bullet?
Speed is the rate at which an object travels. Hopefully, you can remember the formula that uses rate from your math courses:
rt. In physics a 'v' is used as the symbol for rate which is called speed. ('v' is used to represent the term velocity which is similar to speed. This will be discussed later.) So the formula becomes d = vt. The lowercase letter 'd' is the symbol for distance and the lowercase letter 't' is the symbol for time. These symbols must be written in this specific manner. For example, a capital ‘D’ means density, not distance!
If the time and distance are known, the speed can be calculated by rearranging the above equation to solve for 'v':
v
=
d
t
A verbal definition of speed would therefore be the distance traveled divided by the time it took to travel that distance.
Example #1: An airplane flies at a constant speed for 11.5 hours traveling a distance of 2145 miles. Find the speed of the airplane.
Solution:
Given: d = 2145 miles t = 11.5 hours v = ?
Equation:
v
=
d
t
Substitution:
v
=
d
t
=
2145 mi
11.5 hr
Answer: v = 186.5217391304 mi/hr 187 mi/hr (rounded to 3 sig figs!)
But what if the trip isn't made at a constant speed? If all you know is the total distance and the total time you cannot know the speed at any particular time. The plane might have times when is is traveling slower and times when it is traveling faseter then the value calculated. If this is the case where the plane does change its speed then all you can calculate for the trip is the average speed, which is the total distance divided by the total time.
For example, as someone drives to Colorado Springs, there are stoplights, city streets, and expressway travel. The speed at any instant may not be known, but the average speed of an object that travels a certain distance in a known time can be calculated.
Example #2: Mr. Evans drove the 68 miles to Colorado Springs leaving at 4:15 PM one afternoon. He drove on I-25 until 5:00 PM when he left the expressway for 15 minutes so that he could drive slowly and sightsee. Mr. Evans continued to drive until 5:30 PM when he arrived at his destination in Colorado Springs. Find the average speed for this trip.
Solution: **********The average speed during the trip can be found by using the speed formula, but the values for total distance and total time must be used. Given: d = 68 mi
t = 4:15 PM to 5:30 PM = 1 hour and 15 minutes = 1.25 hr
v = ? Equation:
v=dtotal
ttotal
Substitution:
v=dtotal
ttotal
=
68 mi
1.25 hr
Answer: v = 54.4 mi/hr 54 mi/hr (rounded to 2 sig figs!)
** Note that the time was not left as a mixture of hours and minutes. Instead 15 minutes was changed to 0.25 hour, so the whole problem was done in hours. We could have done the whole problem using minutes instead of hours. One hour and 15 minutes equals 75 minutes.
v =
d
t
=
68 mi
75 min
= 0.9066666667 mi/min 0.91 mi/min (rounded to 2 sig figs!)©Fyzics Softext Inc. page 6
Internet Resources
Chapter 1 –
Speed & Vectors
Chapter 1 –
Speed & Vectors
The speed formula can be used to find distance or time as well as speed, as long as the values for the other two variables are known. It is necessary to use Algebra (yes, math will be used in this science course!) to rearrange the equation so that the variable that you are solving for is alone on one side of the equation. This is called "solving for the unknown" and should be done before any substitutions of known values are made.
Example #3: During the drive to Colorado Springs, Mr. Evans maintained a constant speed of 65 mph by using his 'cruise control'. Of course, he could only do this for the 45 minutes that he was on the expressway! What distance did he travel on the expressway?
Solution:
Given information: v = 65 mi/hr
t = 45 min = 0.75 hr (Use hours because the speed is in mi/hr)
d = ?
Equation: d = vt
Substitution: d = (65 mi/hr)(0.75 hr)
** Notice that the 'hr' terms will cancel and drop out. Complete the calculations: d = 48.75 mi 49 mi
Example #4: The pilot just announced that our plane is flying at a rate of 525 mi/hr. How many minutes will it take to cross the state of Colorado which is 450 miles wide?
Solution:
Given: v = 525 mi/hr
d = 450 mi
t = ?
Equation:
t
=
d
v
Substitute:t
=
d
v
=
450 mi
525 mi/hr
Calculate: t = 0.857142857 hr (Keep this number in your calculator!) The question requires that the answer be in minutes, so…
= 51.42857143 min
t = 51 min
Reading Questions:
answer these questions on this paper and you do not need to use complete sentences.1) In math what was the name for speed?
2) In Physics what is the definition of speed?
3) What symbol is used for the following terms:
a) Distance =
b) Time =
c) Speed =
4) What is meant by average speed?
5) When using the formula d = v *t, what are the formulas for velocity and time?
t =
v =
©Fyzics Softext Inc. page 8 0.857142857 hr 60 min
Chapter 1 –
Speed & Vectors
Solve the following problems on your own paper. Follow the procedure shown in the examples. Show all 4 steps (although the title of each step does not need to be written): Given, Equation, Substitution, Calculated Answer (with correct sig figs and units!). We want you to be able to use your work to study.
Do not do your work on
this paper
.
(Notice that the answers are given at the bottom of the page so that you can check your work to see if it is correct! If you don't get the problem correct the first time, try it again - no need to erase your original work.)Problems
1. What is the average speed of an airplane if it travels 621 miles in 3.0 hours?
2. What is the average walking speed of a 185 lb 81 year-old man who walks 27 miles in 8.5 hours? 3. How far does a car go in 4.25 hours if it is traveling at a constant speed of 35 mi/hr?
4. An airplane flies at 235 mi/hr. What distance will it cover in 15 minutes? 5. How many minutes will it take the airplane from problem #4 to travel 150 miles?
6. It will take a high-speed train 28 minutes to travel from Fort Collins, CO to Pueblo, CO, a distance of 265 miles. What is the speed of the train in miles/hour?
7. How many hours does it take for a car moving at an average speed of 65 mi/hr to travel 115 miles?
8. Light waves travel at the speed of light (surprise!), which is about 3.00 x 10⁸ m/s. Radio waves also travel at this fantastic
speed.
a) How far will light travel in a year? Express your answer in meters. (This is called a light year and is a distance, not a time.) b) The nearest star to the earth is, of course, the sun. It takes 8.3 minutes for light from the sun to reach the earth. How far away is the sun from us, again in meters?
c) Other than the sun, there is a star system consisting of about five stars that is approximately 3.8 x 10¹⁶ m from earth. This is
the Alpha Centauri star system. Suppose you send a radio message to the star system, it is received, and immediately a response is sent back to you. How long would this take?
FOR QUESTIONS 9 & 10: A humming bird flies 23.5 meters in 5.792 seconds. 9. How far did the hummingbird fly in 2.50 seconds?
10. How far would the hummingbird fly in 9.2 seconds?
11. Could you run a mile in under 4.0 minutes if you were running at a constant speed of 24 ft/s? (5280 ft/mi) Support your answer with calculations.
*12. A gnat's wings flap up and down at a rate of 300 beats/s. Each beat causes the gnat to move 0.020 cm. How long does it take the gnat to fly 18 cm?
*13. A bowling ball traveling with constant speed hits the pins at the end of a bowling lane 16.5 m long. The bowler hears the sound of the ball hitting the pins 2.50 seconds after the ball is released from his hands. What is the speed of the ball? The speed of sound is 340 m/s.
©Fyzics Softext Inc. page 9
Answers: 1) 210 mi/hr 2) 3.2 mi/hr 3) 150 mi 4) 59 mi 5) 38 min 6) 570 mi/hr 7) 1.8 hr
8a) 9.46 x 10¹⁵ m 8b) 1.5 x 10¹¹ m 8c) 2.5 x 10⁸ s or 7.9 yr 9) 10.1 m
Chapter 1 –
Speed & Vectors
Graphing Time and Distance - Constant Speed
The diagram below shows the position of a toy car along a table every tenth of a second. It shows that the car is moving to the right at a constant speed. How do you know that the motion is constant? The motion of the car will be analyzed by recording data from a ticker tape and graphing it. The graph will be used to find the answers to the following questions.
1) How far did the car travel in 0.325 second?
2) How much time did it take the car to travel 5.75 cm? 3) What distance would the car travel in 0.86 second? 4) What was the average speed of the car (using slope)?
A graph of distance versus time will have time on the x-axis since the distance from the starting point depends on how much time has elapsed. To get the data needed for the graph a ticker tape analysis will be done. A long tape is attached to a moving object and threaded through a device that places tick marks on the tape at regular intervals of time - say every 0.100 second. As the object moves, it drags the tape through the "ticker," thus leaving a trail of dots. The trail of dots provides a history of the object's motion.
To prepare a graph of the car's motion measure the distances on the ticker tape and record them in a data table. The top tape will
be used for this example. The beginning point of the measurements will be the set of points at the left of the top tape. This set of points represents 'zero' seconds and 'zero' centimeters. Draw a line across the tape at the zero point and label it. All distance measurements are made from this point. Measure from the zero point to the first set of points to the right which is the distance the car moved in the first 0.100 second and record. Measure from the zero point to the second set of points - the total distance the car moved in 0.200 second. The data table below contains the measurements from the top tape. The graph shows the plotted data.
©Fyzics Softext Inc. page 10 d =0 cm
.
.
.
.
.
.
.
.
.
.
.
.
.
.
.
.
.
.
.
.
.
.
.
.
.
.
.
.
.
.
.
.
.
0 0.
.
.
.
.
.
.
.
.
.
.
.
.
.
0 s 0 c m x Distance - Time8.0 _ 10.0 _
t (s)
d (cm)
0.000
0.00
0.100
1.10
0.200
2.15
Chapter 1 –
Speed & Vectors
This graph can be used to determine the distance of the toy car at any time, not only the plotted times. Interpolation is the estimation of values of points on the line between the plotted points. "Inter" means 'between'.
In addition to finding points that exist between the plotted points, the graph can be extended to find points that are beyond the original graph. Extrapolation is the estimation of values of points on the line beyond the plotted points.
©Fyzics Softext Inc. page 11
0 0.1 0.2 0.3 0.4 0.5 0.6 0.7 0.8 0.9 t (sec)
x x
x x
x
x
d
(c
m
)
4.0 _
0 _ 2.0 _ 6.0 _
This section of the line was created using
Chapter 1 –
Speed & Vectors
Question #1: How far did the car travel in 0.325 second?
Solution: Draw a vertical line through the 0.325 second point on the x-axis. At the point where the vertical line intersects the plotted line, draw a horizontal
line to the left until it intersects the y-axis. This occurs at a distance of approximately 3.5 cm. This means that the car had traveled approximately 3.5 cm in 0.325 second, or that the car was approximately 3.5 cm from the starting position after 0.325 second.
• On the graph to the right look for this line
Question #2: How much time did it take the car to travel 5.75 cm?
Solution: Repeat the procedure above, only use a horizontal line to intersect the plotted line. At this point drop a vertical line to the x-axis to determine that the
time elapsed was 0.52 second. (You guessed it. You can't be exact doing this procedure, so get as close as you can!) • On the graph to the right look for this line
Question #3: What distance would the car travel in 0.86 second?
Solution: Since the graph is a straight line, Using extrapolation extend the plotted line with a straightedge (then extend the axes and labels if necessary). Repeat the procedure used for interpolation. According to the graph, the toy car would travel a distance of approximately 9.5 cm in 0.86 second.
• On the graph above look for this line
Finding and Using Slope
Δy
Δx
A distance-time graph can also be used
to determine the speed of the plotted object. A graphed line has a slope. To find the slope of a line, many of us have memorized "rise over run" which means the change in the y value(∆y) (read as delta y and equal to y2-y1) divided by the
change in the x value (∆x) (read as delta x and equal to x2-x1).
In order to determine a change, there must be a beginning and an end; two points which should be marked on your graph as shown below.
To find the slope of a plotted line:
1. Select two points on the line -- the farther apart, the better -- and circle them.
©Fyzics Softext Inc. page 12
0 0.1 0.2 0.3 0.4 0.5 0.6 0.7 0.8 0.9 t (sec)
x x x x x x x Distance - Time d (c m ) 4.0 _ 0 _ 2.0 _ 6.0 _ 8.0 _ 10.0 _
(0.8 s, 8.8 cm)
(0.05 s, 0.6 cm)
0 0.1 0.2 0.3 0.4 0.5 0.6 0.7 0.8 0.9 t (sec)
x x x x x x x Distance - Time d (c m ) 4.0 _ 0 _ 2.0 _ 6.0 _ 8.0 _ 10.0 _
(0.05 s, 0.6 cm)
Chapter 1 –
Speed & Vectors
2. Determine the x and y values of each point and label the points. The first point's coordinates are (x1, y1), and the second
point's coordinates are (x2,y2).
3. Calculate the
∆
y by finding y2-y1.4. Calculate the ∆x by finding x2-x1.
5. Divide ∆y/∆x. Remember to include units!
Changin g Speed Changing
Speed
0
0
Chapter 1 –
Speed & Vectors
Question #4: Using the graph on the previous page, what is the average speed of the car (using slope)?
Solution: The slope of the plotted line in the graph above is the average speed of the car:
Δy
Δx
=
y
2−
y
1x
2−
x
1=
8 . 8 cm
−
0. 6 cm
0 . 80 s
−
0. 05 s
=
8 .2 cm
0 .75 s
=
10 . 9 cm/s
=
11 cm/s
Notice that the answer is rounded to 2 figures because this is the number of significant figures we could read from the graph. The units of the slope are cm/s which are units of speed. Therefore, the slope of the plotted line on a distance - time graph gives the speed of the object! The line on this particular graph is straight, which means the slope is constant. Since the slope is constant, the speed of the toy car is constant.
Graphing Time and Distance - Changing Speed
Now consider a car moving to the right with an increasing speed. The toy car is speeding up or accelerating. The motion of the car will be analyzed by recording the data from a ticker tape and graphing it. The graph will be used to find the answers to the following questions.
1) What distance did the car travel in 0.275 second? 2) How much time did it take the car to travel 3.75 cm? 3) What was the instantaneous speed of the car at 0.65 second? 4) What was the average speed for the entire trip?
Below is a comparison of ticker tapes to show the difference between constant motion and changing motion. The bottom ticker tape shows the car speeding up, traveling more distance every 0.1 second. The bottom tape will be used for the analysis.
The data table and resulting graph are shown below.
©Fyzics Softext Inc. page 14
d = 0 cm
0 0.1 0.2 0.3 0.4 0.5 0.6 0.7 0.8 t (sec)
x x x x x
x Distance -
Time x
x
d
(c
m
)
4.0 _
0 _ 2.0 _ 6.0 _ 8.0 _
t (s) d (cm)
0.000 0.00
0.100 0.25
0.200 0.65
0.300 1.25
0.400 2.05
0.500 3.15
0.600 4.70
Chapter 1 –
Speed & Vectors
Note that a motion described as constantly increasing speed results in a line of constantly increasing slope when plotted as a distance-time graph.
Chapter 1 –
Speed & Vectors
Question #1: What distance did the car travel in 0.275 second?
Solution: Repeat the steps used for Question #1 on the Constant Speed graph. The car traveled a distance of approximately 1.1 cm.
• On the graph below look for this line
Question #2: How much time did it take the car to travel 3.5 cm?
Solution: Repeat the steps used for Question #2 on the Constant Speed graph. It took the car 0.54 second to travel 3.5 cm. • On the graph to the right look for this line
Extrapolation on a curved graph may be difficult, so we will skip that!
Question #3: What was the instantaneous speed of the car at 0.65 second?
Solution: To find the instantaneous speed of the car at 0.65 second, we need to find the slope of the curved line at that instant of time. A tangent is a straight line that has the same slope as the infinitesimally small section of the curve at a point. Use a
straightedge to mimic the slope of the curved line at 0.65 second, then draw the tangent. Use two points on the tangent, as far away from each other as reasonable, to find the slope. See the graph below.
The slope of the tangent in the graph above is:
Δy
Δx
=
y
2−
y
1x
2−
x
1=
8 . 4 cm
−
0 . 0 cm
0 . 80 s
−
0 .39 s
=
8 . 4 cm
0 . 41 s
=
20 . 4878 cm/s
=
20. cm/s
©Fyzics Softext Inc. page 16
0 0.1 0.2 0.3 0.4 0.5 0.6 0.7 0.8 t
(sec) x x x x x x Distance - Time x x d (c m ) 4.0 _ 0 _ 2.0 _ 6.0 _ 8.0 _ (0 .3 9 s , 0 .0 cm ) 0 0 .1 0 .2 0 .3 0 .4 0 .5 0 .6 0 .7 0 .8 t ( se c) x x x x x x D ist an ce - T im e x
x (0.8
0 s , 8 .4 c m ) (0 .3 9 s , 0 .0 c m ) d (cm) 4.0 _
Chapter 1 –
Speed & Vectors
Question #4: What is the average speed of the car for the entire trip?
Solution: The easiest way to find the average speed for a changing speed graph is to find the total distance traveled and the total time, then use the speed equation. The last data point gives the information that we need.
d = 6.50 cm t = 0.700 s v = ?
v
=
d
t
=
6.50 cm
0.700 s
=
9.2857142 cm/s
=
9.29 cm/s
The slope of any part of the line on a distance-time graph reveals useful information about the speed of the object at that particular time. Whatever characteristics the speed has, the slope will exhibit the same (and vice versa). If the speed is constant, then the slope is constant (i.e., a straight line). If the speed is changing, then the slope is changing (i.e., a curved line). If the speed is positive, then the slope is positive (i.e., moving upwards and to the right).
The graph below shows an object whose speed is changing at different rates since the plotted line is not a straight line, nor is it a smooth curve. To determine the highest speed of the object, find the area where the slope of the line is the greatest. To determine when the object travels the slowest, find the area on the plotted line where the slope is the least (closest to horizontal which would be zero!).
It is fairly easy to judge when the slope is very large or very small. But it is more difficult to find the value of the slope - the actual speed at a single point. Once the tangent is drawn, it is fairly easy to calculate the speed at that point. All you need to do is find the slope of the tangent just as you would find the slope of any other line Drawing a tangent requires practice and patience. There is always some guesswork in drawing a tangent, so answers will vary some.
©Fyzics Softext Inc. page 17
d
t (hr) d (mi)
0 0 0.5 1.5 0.8 3.4 1.2 4.9 1.5 4.9 1.9 6.2 2.2 6.5
Chapter 1 –
Speed & Vectors
Problems -
do these problems on your own paper.1. The science department is a competitive bunch and will engage in an occasional sports contest. Mrs. Sabadosh and Ms. Williams decide to run a race around the 400.0-m track. Mrs. Sabadosh maintains a speed of 7.8 m/s while Ms. Williams runs at a speed of 7.2 m/s. Who wins the race and by how many seconds?
2. The data table at the right shows the progress of a runner-walker for a total distance of 7 miles.
a) Graph the data.
b) Find the average speed for the entire trip.
c) During what time interval was the speed the highest? d) What was the speed during this interval?
e) During what time interval did the runner-walker stop?
f) During what time interval was the speed the lowest (but not zero)? g) What was the speed during this interval?
3. Analyze the ticker tape below (taken at 10 Hz) by measuring, recording time and distance in a data table, and graphing it. Use your graph to answer the questions.
a) Was the speed constant? How do you know? b) What was the average speed (using slope)? c) How far did the object go in 0.65 s?
d) How long did it take the object to travel 6.0 cm?
e) Use your graph to find how far the object would travel in 0.9 second?
f) Use your average speed (part b) to determine how far the object would travel in 10 seconds.
©Fyzics Softext Inc. page 18 0
Instantaneous Speed
- speed at any given instant in time, for example - the
speed given by the speedometer of a car at any given instant in time.
Average Speed
- total distance divided by the total time.
Answers:
Chapter 1 –
Speed & Vectors
Graphing Time and Speed
You have looked at many distance-time graphs. But this is not the only type of graph that is important to us. It is also important that you can understand and interpret a graph of speed against time. In this type of graph, you place speed on the vertical axis and you leave time in the same place, on the horizontal axis.
To construct a speed-time graph, consider the following example;
You drive your car for 2.0 hours at 30. miles per hour. Then you drive for 2.0 hours at 60. mph. Finally, you drive at 70. mph for 1.0 hour. The v-t graph for this would look like;
Speed vs Time for a Drive
Notice that when the speed is constant, the line is horizontal. In other words, on this graph when the speed is not changing the slope of the line is zero. To construct the distance time graph, you need to find the distance that you traveled in each segment, then take the sum of the distances to find the total distance. Because you traveled for 2.0 hours at 30. mph, and because d
= vt, the total distance traveled in the first interval is;
d
=
vt
=
30
mi
hr
×
2.0 hr
=
60 mi
During the second interval:
d
=
vt
=
60
mi
hr
×
2.0 hr
=
120 mi
During the third interval:
d
=
vt
=
70
mi
hr
×
1.0 hr
=
70 mi
The total distance traveled at the end of 4.0 hours was 60 mi + 120 mi = 180 miles. During the third interval, the distance traveled was 70 miles. After 5.0 hours, the total distance traveled was 180 mi + 70 mi = 250 miles. So, the graph of the total distance versus the total time would look like this (see next page);
©Fyzics Softext Inc. page 19
t (hr)
v
(mi/hr)
(mi)
d
t (hr) d (mi)-- -- -- 0 0
2.0 30. 60 2.0 60.
2.0 60. 120 4.0 180
Chapter 1 –
Speed & Vectors
Total Distance vs. Time for a Drive
Now we can compare this d-t graph to the v-t graph of the same trip. During the first interval, the speed is constant. The v-t graph shows a horizontal line, because the speed is not changing. But the d-t graph is not a horizontal line. It is a line with a constant positive slope. This says that the distance increases the same amount for each increase in time. When the speed increased during the second interval, the slope of the d-t line increased. This is because the speed is indicated by the slope of the d-t graph. Note that on the v-t graph the horizontal line gets higher, but it is still horizontal. This is because the speed is constant again, but at a new, higher value. Finally, the speed goes up one more time. So the v-t graph goes up again- but it is still horizontal because the speed is now constant again. Note that on the d-t graph the slope of the line increases again (you may have to place a ruler on the graph to see this).
Information from a d-t graph can be used to construct a v-t graph and vice-versa.
There is one more example problem that may look different, but just requires the use of d=vt with a little thought!
Example: At the Indy 500 time trials one car drove three laps (4000 m/lap - at least 2 sig figs!) at 89 m/s and then another seven laps at 57 m/s. What was the average speed of this car for all ten laps?
Solution: Find the total distance and the total time to use in the speed equation. d1 = 3 x 4000 m = 12000 m v1 = 89 m/s
t1=d1
v1=
12000 m
89 m/s =134 . 83146 s
d2 = 7 x 4000 m = 28000 m v2 = 57 m/s
t2=d2
v2=
28000 m
57 m/s =491 . 22807 s
dt = d1 + d2 =12000 m + 28000 m = 40000 m
tt = t1 + t2 = 134.83146 s + 491.22807 s = 626.05953 s
vave=dt
tt=
40000 m
626. 05953 s= 63. 89776 m/s = 64 m/s (The average speed is not
v1+v2
2 ! Why not?)
©Fyzics Softext Inc. page 20
d-t v-t: The slope on a d-t graph is speed. Find the slope(s) and plot these values against time on a v-t graph.
Chapter 1 –
Speed & Vectors
Problems
(do these problems on your own paper except for #1)
1. Draw velocity-time graphs for the motion shown in the distance (position)-time graphs below on the left. Carefully calculate the velocity (slope) for each part of the motion in the distance (position)-time graph and plot it correctly on the velocity-time graph.
a)
b)
c)
2. a) A runner runs 100.0 m at a speed of 5.0 m/s and then walks the next 100.0 m at 1.0 m/s. What is the average speed of the runner?
b) The runner now runs for 100.0 seconds at 5.0 m/s then walks for 100.0 s at 1.0 m/s. What is the average speed? c) Explain why the answer to part a) is not 3.0 m/s, but the answer to part b) is!
3. A band of pioneers was heading out to the old west to claim their piece of land. They left St. Louis and traveled for 5 weeks, making good time in covering 250 miles. Then they had trouble. The wagon train was stopped for 1 full week with the wagons circled up. They finally escaped but had to travel very fast. In two weeks they covered 150 miles. Then they came to the mountains, and they slowed down, taking 6 weeks to cross the 180 miles of mountains.
a) From this description, complete a data table of interval time, interval distance, total time, and total distance. Then draw a graph of total distance versus total time for the trip.
b) Compute the average speed for the entire trip. c) Compute the maximum speed.
*4. You are driving home from school steadily at 19.5 m/s for 5300 m. It then begins to rain and you slow to 16.5 m/s. You arrive home after driving 23 minutes.
a) How far is your home from school?
b) What was your average speed? [22 km, 17 m/s]
©Fyzics Softext Inc. page 21
Chapter 1 –
Speed & Vectors
5. Sketch d-t and v-t graphs for the following situations: (Sketch the v-t graph directly below the d-t graph so that the time is the same for both graphs)
a) a car travels down Wadsworth at a constant speed, then slows to a stop for a red light.
b) a ball rolls across the floor at a constant speed, then instantly reverses direction as it hits the wall and bounces back at a slightly slower constant speed.
c) a bicyclist travels at a constant speed, then accelerates to a higher constant speed.
d) a car stopped at a red light accelerates as soon as the light turns green until the speed limit is reached. It then continues at a constant rate.
e) a student walks steadily away from a motion detector, stops for a few seconds, then walks toward the motion detector speeding up
f) a student walks toward a motion detector at a rapid constant rate, then instantaneously slows to a lower constant rate
6. A car is being test run and the data at the right are obtained by having the driver look at the speedometer every second. Assume the given speed is maintained for the entire second and changes instantaneously. a) Construct a v-t graph with the information shown.
b) Construct a data table showing t, t, v, d, d.
c) Construct a d-t graph.
d) Find the average speed for the entire test run.
7. A satellite moves at 6900 mi/hr. a) Convert this speed to m/s
b) Calculate how many seconds it would take the satellite to complete one orbit around the earth at a distance of 4.2 X 10⁴ km from the center of the earth.
c) Convert your answer to hours.
8. The winning Dragster at Bandimere completed the quarter mile track (0.250 mi) in 5.83 seconds. What was its average speed in mi/hr?
9. During the 1996 Summer Olympics, Donovan Bailey ran the 100-m dash in 9.84 s. His data is shown at the right. (The distance is exactly 100 m)
a) Construct a d-t graph with the information shown. b) Construct a data table showing t, t, d, d, v.
c) Construct a v-t graph.
d) Find the average speed for the entire race. e) Convert your answer for d) to mi/hr
10.A blue toy car (travelling at a constant rate of 12.35 cm/s) is racing with a similar red toy car along a track that is 3.50 meters long. The blue toy car finishes the race 1.42 seconds ahead of the red toy car. Assume constant speeds for both cars for the entire length of the track. How fast was the red toy car traveling?
*10. Having nothing better to do, the avid physics student decided to determine how fast she could ride her bike. She knew that the diameter of her bicycle tire was 24 inches, so she carefully counted the rotations of the tire as she rode to the corner, a trip that lasted 5.3 seconds. She found that there were approximately 31.7 rotations from her driveway to the corner. What was her average speed in ft/s and mi/hr?
©Fyzics Softext Inc. page 22
Car - Test Run t (s) v (m/s)
0.0 0.0 1.0 4.5 2.0 9.0 3.0 9.0 4.0 3.0 5.0 2.0 6.0 2.0 7.0 6.0 8.0 6.0 9.0 2.0 10.0 0.0
D. Bailey d (m) t(s)
0 0 10 1.9 20 3.1 30 4.4 40 4.9 50 5.6 60 6.5 70 7.2 80 8.1 90 9.0 100 9.84
Answers:
Chapter 1 –
Speed & Vectors
Vectors
So far everything that you have learned in this class has assumed that all motion is in a straight line in the same direction. We know that this is not true in most situations. For example, suppose your friends told you that they walked four blocks. How far are they from where they started? Of course the answer depends on the directions that they walked. They could have walked four blocks in a straight line, in which case they are four blocks from where they started. But they could have walked one block, turned right and walked another, then another right, another block, turn right, one more block and ended up right where they started (four blocks and four right turns.)
You see, direction is very important! In most real situations you must know the direction the object is moving to tell much about the speed or distance the object has traveled.
Numbers where direction is not important are called scalars. Numbers where direction is important are called vectors. To remind us that direction is important to a number, we put an arrow-like symbol, v , above the letter used for speed to remind us that v is a vector – velocity. While a scalar indicates only the size (or magnitude) of a measurement, a vector has two parts, magnitude and direction. Scalar measurements include your age, shoe size and mass.
Vector quantities are represented by vector diagrams. An example of a scaled
displacement diagram is shown at the right. There are several characteristics which make this a correctly drawn vector diagram.
Internet Assignment
1. Additional explanations and examples can be found on http://www.glenbrook.k12.il.us/gbssci/phys/Class/BBoard.html. Select Vectors - Motion and Forces in 2 Dimensions from the left column menu. Read Lesson 1: Vectors - Fundamentals and Operations. Be able to answer questions about the information presented.
2. For practice problems on vectors, go to http://www.glenbrook.k12.il.us/gbssci/phys/morehelp/vectdirn/practice.html. Do problems 7-12 on your own paper (problems 1-6 would be good practice, but the scale is a problem).
©Fyzics Softext Inc. page 23
Scale: 1 cm = 10 m
R = 26 m
3 2
1 2 2
A
correctly drawn vector diagram
includes: 1. a clearly stated scale;2. the vector, from the tip of the arrowhead to the end of the tail, is drawn to scale in the correct direction; and
3. the magnitude and direction of the vector are clearly stated. In this case, the diagram shows the magnitude is 26 m and the
2.8 m 2.0 m
2.0 m Start
45 315
Scale: 1 cm = 0.5 m
If you had 2.0 + 2.0 = ?
Chapter 1 –
Speed & Vectors
Addition of Vectors
Consider the following;
Normally this would be an easy question, but the sum of two vectors could be very different because it depends on their directions. For example, if you walk 2.0 meters east, then turn around and walk 2.0 meters west, the vectors would be in opposite directions as drawn to the left.
Or, if you walked 2.0 meters east, then turned and walked 2.0 meters south, the vectors would be at a right angle to each other as drawn below.
Scale the resulting distance (5.6 cm = 2.8 m) and measure the angle So, 2.0 m + 2.0 m could be 2.8 m@315º (or 45º south of east)
In general 2.0 + 2.0 is equal to "some number equal to or larger than zero and less than or equal to 4.0". It all depends on the direction. This means that 2.0 + 2.0 = 4.0 is only a true statement for scalars, and is not generally true for vectors.
It is easy and phun to add vectors. Simply draw the vectors with your ruler in the correct direction. Make them the correct size by using a scale and your ruler. Then place the tail of the second vector at the head of the first vector. If there are more than two vectors, continue placing the next vector’s tail at the head of the last vector drawn. Draw the resulting vector from the first vector's tail to the head of the last vector. Here is an example;
Example #1: The directions were clear, but the resourceful physics student wanted to save time and energy! The instructions below were given to a group of students starting at point ‘A’. The resourceful physics student wished to meet the group at the end of their trip without having to follow each direction.
Walk north for 2.0 blocks, then east for 7.0 blocks, then north for 3.0 blocks, and finally west for 4.0 blocks.
a) How many blocks did the group actually walk?
b) What is the displacement of the group? (How far will the resourceful physics student have to walk?)
c) The physics student can walk 1.2 blocks in 7.5 minutes. How long will it take for the student to meet the group at the end of their trip?
SOLUTION -- a) To find the total number of blocks actually walked, add each distance without regard for direction.
2.0 + 7.0 + 3.0 + 4.0 = 16 blocks b) To find the displacement (how far and in what direction), draw a vector diagram. The vectors can be drawn tail-to-head as you read the instructions. It may be helpful to identify each vector as you draw it. *** North is to the top of the paper!
©Fyzics Softext Inc. page 24 2.0 + 2.0 = ?
Point ‘A’
Scale: 1 cm = 1 block
31
1
2
3 4
R
5
9 east
= 0
3 4 2 1 2.0 m
2.0 m
start
If you had 2.0 + 2.0 = ?
Chapter 1 –
Speed & Vectors
c) To find the time that it takes the resourceful physics student to walk this far, use d = v t.
Given: d = 5.9 blocks
v = 1.2 block/7.5 minutes = 0.16 block/minute
t = ?
Equation: t = d/v = 5.9 blocks/0.16 block/min = 36.875 min 37 min
Would it make any difference if the vectors were added in a different order? Let’s try it!
The order of the vector addition will be:
Gonorth for 3.0 blocks, east for 7.0 blocks, north for 2.0 blocks, west for 4.0 blocks,
As the vector diagrams on page 19 & 20 show, there is no difference in the resultant if you add the vectors in a different order. Vector addition is commutative, they can be added in any order without changing the resultant! If you find this hard to believe, try another order for the addition….
In addition to using vectors to determine displacement, vectors are also used to determine resultant velocity (speed with direction) and resultant forces (more on this later). These vectors are added in the same way that displacement vectors are added, and the resultants can be used to solve additional problems.
Example #2: The airspeed of a plane flying south is 400 km/hr. The wind has a velocity 220 km/hr from the west. Find the resultant velocity and displacement of the plane after 3.5 hours.
First, to find the resultant velocity it is necessary to add the two velocity vectors by drawing them to scale and graphically adding them. The two vectors can be drawn from the same point. Then copy one vector (either one) so that its tail is at the head of the first vector as
shown below.
Next, use the resultant velocity of 460 km/hr, 29 east of south (or at 299), to solve the displacement part of the problem. This problem is just asking what distance has been covered by the plane in the same direction as the resultant velocity, not just south or east.
Given: v = 460 km/hr
t = 3.5 hr Equation: d = v t
Substitution: d = (460 km/hr)(3.5 hr)
Answer: d = 1610 km ==> 1600 km, 29 east of south (or at 299)
©Fyzics Softext Inc. page 25 1
4 2 3
The resultant, R, indicates a distance of 5.9 blocks and if we use east as 0o
and go counterclockwise the direction is 59o. Therefore the resultant is
R = 5.9 blocks@ 59
Another way of measuring the angle is by using compass directions so since the angle between vector 1 (due North) and the resultant is 31. East of North or 31o E of N
2.2 cm
4.0
cm 4.6 cm 2 9 2 9 9
Scale: 1 cm = 100 km/hr
In summary
When adding vectors:
1. draw them to scale, in their correct directions;
2. move (copy) one vector so that its tail is at the head of the first;
3. draw a resultant from the tail of the first vector to the head of the last vector moved (copied);
4. measure the angle of the resultant to obtain the direction of the vector (Use either method unless otherwise stated); and
Chapter 1 –
Speed & Vectors
Internet Assignment
1. Learn more about Speed and Velocity on http://www.glenbrook.k12.il.us/gbssci/phys/mmedia/kinema/trip.html. Read this page and view the animation for deeper understanding.
2. For practice problems on adding vectors, go http://www.glenbrook.k12.il.us/gbssci/phys/mmedia/vectors/va.html.
Problems -
do these problems on your own paper.
Solve the following problems using vector diagrams. Remember that vector answers require both magnitude (with units) and direction!
1. An airplane is headed east with a velocity of 520 km/hr. The wind has a velocity of 90 km/hr in a northerly direction. a) What is the resulting velocity (ground speed) of the airplane?
b) How far would the plane travel in 3.6 hours?
2. Mr. Reeves navigates his small motorboat across a stream that flows to the south at 3.5 km/hr. The boat is pointed due east and can move at 5.5 km/hr through the water.
a) What is the boat's velocity with respect to the students standing on the shore?
b) After 45 minutes, Mr. Reeves (in his boat) reaches the other side. How far does the boat travel? c) How far downstream is Mr. Reeves at the end of the 45 minutes?
d) How wide is the stream?
3. A private plane is headed northeast (45) at 420 km/hr. The wind at flying altitude is blowing with a velocity of 160 km/hr to the east.
a) What is the plane's resultant velocity? b) How long will it take the plane to fly 675 km?
4. A treasure map gives the following directions that will lead to the buried gold: 200 paces west, 500 paces north, 150 paces at 300, and finally, 75 paces south. If the bulldozer is to meet you where the treasure is buried, what simple directions can you give the operator? (Now that you know everything there is to know about vectors!)
5. On a somewhat windy day geese are seen flying with a velocity of 6.2 m/s south. The wind is blowing southeast (315) at 7.5 m/s. What is their displacement after flying for 2 hours?
6. A car travels east at 35 km/hr for 1.5 hours, then turns north and travels at 55 km/hr for 45 minutes. Find the displacement of the car.
7. A phenomenal physics student leaves SLHS and walks north for 3 km, east for 7 km, south for 6 km, north for 5 km, west for 3 km, and south for 5 km.
a) Find the displacement of this tired and lost physics student.
b) State the direction that this tired and lost physics student should head in order to return to SLHS.
*8
. A phast-thinking physics student wishes to row straight across a river that is flowing east. The physics student rows the boat at an angle of 143º and notes that the resulting velocity of the rowboat is 6.0 m/s due north relative to the shore.a) What is the velocity of the river current?
b) At what speed is the physics student rowing the boat?
©Fyzics Softext Inc. page 26
Answers:
1a) 530 km/hr at 10º 1b) 1900 km 2a) 6.5 km/hr at 328º2b) 4.9 km 2c) 2.6 km 2d) 4.1 km
Chapter 1 –
Speed & Vectors
Review Problems – Speed/Vectors
- do these problems on your own paper.Since solving pysics problems is a skill rather than memorization, there will be problems on the unit test that you have not seen before. These "new-to-you" problems are not really new, but just the "same old problems" with different numbers and/or situations. There will also be problems that are combinations and/or extensions of the homework problems that will test your ability to reason using the physics that you have learned. The best preparation for the unit test is to complete all of the review problems as well as re-doing homework problems.
1. An airplane flying from Los Angeles to New York City completes the 2750-mile trip in 4 hours and 38 minutes. Find the average speed of the airplane during this trip.
2. A gun fires a bullet with a muzzle speed of 3.0 X 10² m/s. The bullet hits the Bull's Eye of a target 1.2 X 10² m away.
Calculate the time of the bullet's flight. (You may assume the bullet travels in a straight line.)
3. A blue battery-operated toy car travels west at a constant rate of 12.35 cm/s for 1.5 minutes. The car hits a wall and changes its direction. It now travels with the same speed south for 1.2 minutes. What is its displacement?
4. Use the graph at the right to determine the instantaneous speed of a toddler on a tricycle at 12 seconds, 25 seconds, and 32 seconds. Find the average speed for the entire trip.
5. During the Kinetic Vehicle Race in last year's Gator Games, the winning vehicle leapt from the starting line with a speed of 5 mi/hr, which lasted until the halfway point of the mile-long course. The vehicle was clocked at only 2 mi/hr for the last half mile of the race. Find the average speed of the winning Kinetic Vehicle.
6. A bicyclist travels 24.5 miles in 0.818 hours. If this pace were maintained, how far would the bicyclist travel in 3.25 hours? 7. A toddler takes a walk through the park. He walks 4 meters during the first 3 seconds. Then during the next 2 seconds he
slows down and only walks one additional meter. At this point the toddler stops to watch an ant crossing the sidewalk, which takes 2 more seconds. At this point the toddler hurries to catch up to his mother and covers 3 meters in one second. Complete a data table (t, t, d, d) and construct a d-t graph.
8. Another toddler in the same park wanders aimlessly looking at bugs and worms. She starts by walking east for 7 steps, then turns south and walks 5 steps. She then heads northeast at 45 degrees walking 4 steps and then west for 6 steps. This entire trip takes 48 seconds.
a) How far from her starting point is she?
b) What was her average speed for the entire trip in steps/second?
9. Analyze the ticker tape below (taken at 10 Hz) by measuring and recording time and distance in a data table, and then graphing it.
a) Was the speed constant? How do you know? b) Find the average speed for the entire tape.
c) During what time interval did the object have the fastest speed? Find the fastest speed. d) During what time interval did the object have the slowest speed? Find this speed.
Chapter 1 –
Speed & Vectors
10. The graph below shows the distance a battery-operated toy car traveled over an obstacle course with respect to time. a) During what time interval was the car traveling the fastest? How
fast was it traveling?
b) During what time interval was the car stuck against the wall? How did you determine this?
c) During what time interval was the car moving back towards its starting position? What was its average speed during this time d) How long did it take the car to travel the first 2.8 meters? What
was its average speed during this time?
e) How long did it take the car to travel the first 4.4 meters? What was its average speed during this time?
f) How far did the car travel in 7.0 seconds? What was its average speed during this time?
11. A batter hits a baseball giving it a horizontal speed of 45 mph. It is caught 2.8 seconds later. How many feet did it travel from home plate? (Assume the baseball travels in a straight line and at constant speed.)
12. Describe the motion shown in the d-t graphs below. Sketch a v-t graph for each.
a) b) c) d)
13. Describe the motion shown in the v-t graphs below. Sketch a d-t graph for each. a) b) c) d)
14.A phearless physics student decides to cross a rapidly running stream in a rowboat. The student rows eastward at 2.9 km/hr. The rapidly running stream is flowing south at 7.5 km/hr. The student reaches the other side in 11 minutes.
a) What is the student’s velocity relative to an observer on the side of the stream? b) How wide is the stream (in meters)?
©Fyzics Softext Inc. page 28
Answers:
1) 594 mi/hr 2) 0.40 s3) 1400 cm at 218 4) ~0.80 m/s, ~0.38 m/s, ~2.5 m/s, 0.85 m/s
5) 3 mi/hr 6) 97.3 mi 8a) 4 steps at 330
8b) 0.5 step/s 9a) no 9b) 13 cm/s 9c) 0.4s-0.5s, 22 cm/s 9d) 0.7s-0.8s, 4.5 cm/s 10a) 12s-14s, 0.80 m/s 10b) 14s-20s 10c) 20s-26s, -0.10 m/s 10d) 12s, 0.23 m/s
Chapter 1 –
Speed & Vectors
Review Problems – Graphical Analysis
1. Below each d-t graph, completely describe the motion shown in the graph. a. b. c.
2. Below each v-t graph completely describe the motion shown.
a.
b.
c.
d.
3. Sketch the velocity-time graphs for each described motion.
4. Draw correct graphs below of distance (position)-time and velocity-time for a student that:
moves away from the detector at a slow and steady velocity for the first 5 seconds, then
moves away at a medium-fast, steady velocity for the next 5 seconds, then
stands still for the next 5 seconds, then
moves toward the detector at a slow and steady velocity for the next 5 seconds, and then stands still for the last 5 seconds.
©Fyzics Softext Inc. page 29
d
t
d
t
d
t
t
v
t
v
t
v
t
v
t
v
t
v
t
v
v
t (
Chapter 1 –
Speed & Vectors
Problems (Instantaneous Speed)
Name PerFor each set of questions use the graph at the right to find the speed at the necessary points by drawing a tangent to the curve at each point. Do #1-5 on this paper, the rest on your own paper.
1. a) Find the instantaneous speed at t = 2.5 s.
b) Find the instantaneous speed at t = 4.5 s.
c) Find the average speed over the entire time interval.
2. a) Find the speed of the car as it passed the 40 meter point.
b) Find the speed of the car at 1.0 second.
c) Find the average speed of the car for the first 40 meters.
3. a) Find the speed of the car at 0.5 hr.
b) Find the speed of the car at 2.5 hr.
c) What is the average speed for the entire trip?
©Fyzics Softext Inc. page 30
d
is
ta
n
c
e
(c
m
)
time (s)
d
is
ta
n
c
e
(m
)
time (s)
d
is
ta
n
c
e
(k
m
)
time (hr)
d
(m
)
v
(m
/s)
t (
s)
5
10
15
20
25
t (
s)
t
Chapter 1 –
Speed & Vectors
4. a) Over what time interval was the speed the highest? What was the highest speed?
b) Over what time interval was the speed the lowest? What was the lowest speed?
c) What was the average speed for the entire trip?
5. a) What was the average speed for the entire trip?
b) What was the speed of the object at the 20-meter mark?
c) What was the speed at 4 seconds?
d) During what time interval did the object stop?
e) What was the average speed during the first 2.5 seconds?
©Fyzics Softext Inc. page 31
Answers:
1a) ~6.0 cm/s 1b) ~20 cm/s 1c) 8.4 cm/s2a) ~4.0 m/s 2b) ~12 m/s 2c) ~14 m/s 3a) ~12 km/hr 3b) ~2.5 km/hr 3c) 9.0 km/hr
4a) 2.5-3.0 min; ~24 m/min 4b) 1.2-2.0 min; ~4.0 m/min 4c) 10. m/min 5a) 6.6 m/s 5b) ~18 m/s
Chapter 1 –
Speed & Vectors
Problems (Vectors #1)
Name PerSolve each problem below using vector diagrams. The first vector for each problem has been drawn for you. Find and state the scale used. Draw and add the remaining vector(s) on this paper. Use a dashed line for the resultant. Label each vector. Then scale out the resultant and state its value and direction. (Use North toward the top of the paper or counterclockwise from east = 0)
1. Mr. Evans hopped on his motorcycle and rode 330 kilometers south and then headed east for 260 kilometers. What was his displacement from his starting point?
Scale:
2. Mrs. Roding can row a boat at 2.8 km/hr west across the Mississippi River. However the river current moves her boat south at a rate of 2.2 km/hr.
a) What is her velocity relative to a person watching her from the top of the St. Louis Arch? Scale:
b) How far would the rowboat travel in 30 minutes?
3. Mr. Reeves buried a treasure for his daughter and then gave her these directions: “Walk 10 steps north, then 12 steps east, then 4 steps at 225O, and finally 6 steps south. Dig!”
a) What is her displacement from her starting point? Scale:
b) If Mr. Reeves can walk 3 steps per second, how long would it take him to walk to the treasure from his daughter’s starting point if he takes the shortest Route?
©Fyzics Softext Inc. page 32
R = ______________________________
R = ______________________________
R = ______________________________
Answers:
(Your answers may vary by 0.3 cm and/or 3)Chapter 1 –
Speed & Vectors
Problems (Vectors #2)
Name PerState the scale used. Add the vectors. Use a dashed line to indicate the resultant and label it with an R. Give the correctly scaled magnitude and the direction of each resultant vector. State the direction with respect to due east (a dotted line is given as a reference).
1. Magnitude Direction 2. Magnitude Direction
3. Magnitude Direction 4. Magnitude Direction
5. Magnitude Direction 6. Magnitude Direction
(continued on next page)
©Fyzics Softext Inc. page 33 35 m
47 m
560 m/ s
360 m/s
4.2 mi/hr
4.9 mi/hr
0.068 km
0.031 km
42 km/hr
3
.8
m 4.
0
m
6.
0
m
Chapter 1 –
Speed & Vectors
7. Magnitude Direction 8. Magnitude Direction
9. Magnitude Direction 10. Magnitude Direction
11. Magnitude Direction 12. Magnitude Direction Make your own drawing:
1= 3 mi east, 2 = 5 mi at 75
13. Magnitude Direction 14. Magnitude Direction Make your own drawing: Make your own drawing:
1= 4.8 m/s at 30, 2= 3.2 m/s at 180 1= 27 steps at 90, 2= 16 steps at 240,
3= 45 steps at 0.
©Fyzics Softext Inc. page 34
24 m/s 46 m/s
19
00
m
52
00
m
13
00
m
24 km 51 km
16 km
490 m 310 m
270 m 26 cm/s
27 cm/s
38 cm/s
Answers:
1) 79 m at 23 2) 400 m/s at 79 3) 4.8 mi/hr at 43 4) 0.046 km at 1845) 63 km/hr at 257 6) 10.3 m at 16 7) 22 m/s at 0
8) 5300 m at 6 9) 84 cm/s at 5 10) 24 km at 192 11) 690 m at 8
Chapter 1 –
Speed & Vectors
Speed & Vectors Review:
To receive points you must write down both what the question asked as well as the answer.Use this problem for the next 6 questions: Mr. Evans car travels East for 5.51 kilometers in 15 minutes. The car comes to an intersection and changes its direction. It now travels north for 12.4 kilometers in 19.5 minutes. What is the car’s