Design and development of manually push type urea super
granule applicator
Md. Mehedi Hasan
1, Md. Abedur Rahman
2,3*, Muhammad Ashik-E-Rabbani
1(1. Department of Farm Power and Machinery, Bangladesh Agricultural University, Mymensingh-2202, Bangladesh;
2. Department of Civil and environmental Engineering, Graduate School of Science and Engineering, Saitama University, Saitama, Japan; 3. Department of Irrigation and Water Management, Bangladesh Agricultural University, Mymensingh-2202, Bangladesh)
Abstract: To lessen overwhelmed high human strain and tedious work in urea application for rice cultivation, a manually operated push type Urea Super Granule (USG) applicator was designed and developed. There are four small drive wheels inserted in lieu of float which was fabricated using small steel rings instead of the traditional skid concept. The discharge tubes were reformed with the additional bent PVC tubes. The average effective field capacity and field efficiency of the USG applicator was 0.16 ha h-1 and 88.1%, respectively. In the field test, the average missing rate, applicator capacity, the distance amid two dropped USG, covering performance and force requirement in developed model were 6.25%, 13.21 kg h-1, 41.61 cm, 77.5% and 69.18 N. The developed applicator saves cost about nineteen times than manual operation. The developed applicator may be useful to small growers of rice growing countries like Bangladesh which not only be cost effective but will also save both time and energy.
Keywords: Urea Super Granule, USG applicator, design and development, performance evaluation
Citation: Hasan, M. M., M. A. Rahman, M. A. Rabbani. 2018. Design and development of manually push type urea super granule applicator. Agricultural Engineering International: CIGR Journal, 20(2): 80–87.
1 Introduction
Bangladesh is basically an agriculture-oriented
country and around 16% Gross Domestic Product (GDP)
comes from the agricultural sector. Rice is the staple food
crop of the people and meets almost 80% of the food
demand of the country. Shortage of labor in rice
production is the chief due to migration of people to town
and necessity of mechanization for rice production
(Mohammad et al., 2011). Urea emerges as an important
nitrogen fertilizer for rice production in Bangladesh and
approximately 80% of total urea production is used by the
rice plant (Prasad and Data, 1979). It was exposed that
symbolic loss of urea is experienced, causing a fertilizer
Received date: 2017-08-10 Accepted date: 2018-01-09
*Corresponding author: Md. Abedur Rahman, Department of Civil and environmental Engineering, Graduate School of Science and Engineering, Saitama University, Saitama, Japan; and Department of Irrigation and Water Management, Bangladesh Agricultural University, Mymensingh-2202, Bangladesh. Email: [email protected], [email protected]. Tel: +8801738614993.
use efficiency of 30% only (Hoque et al., 2013).
Nitrogen loss is induced due to ammonia
volatilization, surface runoff, leaching, denitrification and
seepage, etc. Due to a significant loss of nitrogen, the
farmer’s in Bangladesh has not able to sort more
resourceful use of fertilizer to upsurge their rice yields.
To avoid disproportionate volatilization loss of nitrogen
fertilizer; deep placement of granular urea into the
anaerobic soil region is an effective method (Hoque et al.,
2013). Depending on nitrogen use and different climatic
condition, deep placed USG (Urea Super Granule) not
only save urea fertilizer with a mean of 33%, up to 65%
but also upsurge grain yields up to 50% with a mean of
15% to 20% above the same quantity of broadcasted
nitrogen as prilled urea, particularly in the inferior range
of nitrogen rates (Savant and Stangel, 1990). It was also
stated that deep placement of USG at a depth of 6-10 cm
in wet land paddy field can save 30% of nitrogen than
split-applied prilled urea (Bautista et al., 2001; Hoque et
al., 2013).
the soil by manually which is not only laborious but also
time-consuming. Prasad and Data (1979) outlined that
only 15% to 35% of the applied nitrogen fertilizer is
utilized by the rice plant. Roy (2011) discovered that 33%
of urea goes unused in wetland rice production. However,
urea in the form of USG (Urea Super Granule) has been
proved to be superior to regular granular urea in all
aspects. Instead of common doses of 247 kg of granular
urea, only 160 kg of USG is required (35% less) and it
upsurges rice yield up to 20% per hectare (Hossain, 1998).
If urea is applied in super granule form, a significant
amount of urea production could be reduced, which will
end up in saving of natural gas, whereas natural gas plays
a prime input to produce urea fertilizer.
Granular urea is currently applied manually just like
transplanting in between rice seedlings in the field.
Basically, granular urea is placed at a depth of 60-70 mm
under the soil at a center of four consecutive hills of two
adjacent rows. The manual placement of granular urea is
labor intensive and very slow field operation i.e. 0.07 to
0.12 ha workday-1 (Savant et al., 1991). Therefore, it
leads a path to design and develop a manually operated
low-cost granular urea applicator.
In Bangladesh, International Fertilizer Development
Corporation (IFDC) is working on an efficient application
of fertilizer, dissemination of granular urea/USG and
development its applicators for several years. Along with
different research institutions and private organizations
have taken initiatives towards development of USG
applicator. But amid all developed applicators have some
common problems i.e. high missing rate, over and above
one USG per cup, blockage in the discharge tube,
additional power required to operate and high rate of
cracking of USG, high self-weight, soil bearing capacity
is not sufficient to facilitate even movement of the wheel
on the wet soil surface etc. So, concentrating on
aforementioned issues, the aim of the present study is to
design and development of a manually push type USG
applicator along with the performance evaluation. The
advantage and constructing differences were four small
drive wheels inserted in lieu of float to minimize friction
along with ease of handling of the applicator and unlike
others a frame was inserted to enhance durability and
stability of the applicator. Also cost of the applicator kept
in an affordable range for the small growers.
2 Materials and Methods
2.1 Design considerations
The following factors were considered to design
manually push type USG applicator: (i) the machine
should be as simple to build and easy to tuning, (ii) float
is replaced by the drive wheels to reduce the friction of
the machine, (iii) the size of the USG (e.g. 2.7 g and
1.8 g), (iv) the modification of discharge tube, (v)
distance between applied USG to USG and row to row
placement, (vi) be easy to repairable and to maintain, (vii)
the cost of machine need to be within the capacity of rural
small farmers. The USG applicator was designed for both
size 1.8 g and 2.7 g of USG. For simulation no software
is used only trial and error method was followed. The
diameter of an individual USG was varied from 20 to
25 mm. USG is chemically same as the fine urea,
however, USG is slightly larger and harder. Since the size
of the USG is bigger it has no chance to spillage from the
aperture on hopper wall. Moreover, the capacity of the
hopper (900 g) is maintained to prevent overtopping.
Table 1 The specification for the USG
Parameter Value
Nitrogen concentration 46% (Minimum)
Moisture 05% (Maximum)
Biuret 1.4% (Maximum)
Granulation 2-4 mm, 90%-94% (Minimum)
Melting point 132 Degree Celsius
Colour Standard White or Pure White
Radiation Non-radioactive
Diameter 20-25 mm
Weight 1.8 -2.7 g
Disappear Time in water 0.373 h
Disappear Time in air 52.9 h
2.2 Design and development of manually push type
USG urea applicator
The manually push type USG urea applicator (Figure
1) consists of the following major parts: cage wheel,
plastic metering disk, plastic hopper, discharge tube,
frame with a handle made of Mild Steel (M.S.) flat bar
and Mild Steel (M.S.) sheet, drive wheel, respectively.
The plastic is Poly Vinyl Chloride (PVC) because this
type was readily available, durable and long lasting. The
descriptions of different parts are given herein:
spikes were made by a plastic sheet having a diameter of
460 mm to share the dispersed weight load of the
applicator equally with the small size cycle rings. The
groove was made 8 mm rod at both ends and inserted into
the center of cage wheel and locked by a hook. This rod
assists to work the metering disk with the rotation of the
cage wheel. Twenty-four flat spikes were provided to
guide the metering device to drop per USG in every
40 cm distance. It also worked as a power transmission
device to put the dropped USG into the soil.
Figure 1 Isometric and photographic view of the applicator
Figure 2 Different views of the cage wheel
2) Plastic Metering Disk: The metering disk (Figure 3)
of 145 mm diameter with four cups at 60° angles
connected with cage wheel and fixed inside the hopper
with a hollow metal tube. The external and internal
diameter of the USG picking cup was 22 and 20 mm,
respectively. The space for a USG was 6.5 mm.
Figure 3 Different views of the drive 1heel and metering disk
3) Drive Wheel: The both external and internal
diameter of the drive wheel (Figure 3) ring was 208 and
160 mm, respectively. The width of the drive wheel was
30 mm (20 mm internally). The length of the shaft of the
drive wheel was 100 mm.
4) Hopper: The hopper (Figure 4) having a capacity
about 900 g (measured by electric weighing scale) and
both discharge tubes were made of plastic and secure
with the frame, metering disk and cage wheel. The length,
depth and height of hopper were 160, 120 and 90 mm,
respectively with round tapering at the bottom.
5) Frame with Handle: Frames (Figure 6) for holding
the different components of the applicators were made by
hold each drive wheel. The length, height, and width of
the frame were 600, 510, and 320 mm respectively. The
frame was tightened with the drive wheel using nut and
bolt. The handle was made of a square bar of 1230 mm
length, attached with a 320 mm U shape components of
20 mm flat bar to push the applicator in the forward
direction. The length of the holding part of the handle
(Figure 5) was 304 mm. A 40 mm diameter semicircular
constituent was used to hold the discharge tube rigidly.
6) Discharge tube: Discharge tube and small metal
guide strip (Figure 7) were used to decrease the missing
rate and were secure with hopper by a small nut. The
height of the discharge tube was 330 mm with 100 and
40 mm diameter, respectively at top and bottom. The
discharge tube was connected with the total components
were fixed with the frame.
Figure 4 Different views of the hopper
Figure 5 Different views of the handle of the applicator
Figure 6 Different views of the frame of the applicator
Figure 7 Different views of the discharge tube of the applicator
2.3 Theoretical considerations
The theoretical considerations were reviewed by
Kepner et al. (1978) and Ahmed et al. (2013). The
governing factors for the performance evaluation of USG
applicator comprises: field condition, ease of operator,
adjustment of applicator, soil type, soil moisture, land
topography, field size and shape etc.
2.3.1 Missing rate and distance of dropped USG
The missing rate of the applicator is estimated from
the ratio of number of USG missing to pick up by
metering disk into discharge tube to the number of USG
more than one per cup. Arithmetically, missing rate was
expressed as follows:
1 2
% missing N 100
N
= × (1)
where, N1 is the number of USG missing to pick up by
metering disk into discharge tube; N2 the number of USG
pick up by metering disk if no missing occurred and no
more than one per cup.
Distance of dropped USG was maintained by the
applicator and measured very carefully. During operation,
operator and one observer measured the distance of USG
dropped in the field separately. After the observation, the
average distance between two dropped USG is calculated.
2.3.2 Applicator capacity
The rate of urea application using the applicator is
called Applicator capacity. The capacity was determined
by the following equation:
kg
Applicator capacity ( )
h
Total weight of USG dropped, kg
Time taken to operate, h
=
(2)
2.3.3 Field capacity
The effective field capacity may be defined as the
actual rate of field when the applicator was operated
within a specified time. The theoretical and effective field
capacity of the applicator was calculated as follows:
ha Theoretical field capacity ( )
h 10
Sw
= (3)
where, S is the forward speed, km h-1 and w the width of
coverage, m.
ha Field coverage, ha
Effective field capacity ( )
h =Actual time of operation, h
(4)
2.3.4 Covering performance
USG is a highly volatile in water and disappears in air
within short time. Thus, covering performance is an
important parameter to evaluate the performance of an
applicator. If the USG remains uncovered, plants are
unable to uptake the nutrient from it. Covering
performance of the applicator is defined as the percentage
of USG covered by the applicator. Also, the covering
performance represents the coverage of USG by mud.
The uncovered USG is lost by mixing with water (solvent)
contact. During operation, a machinist and a spectator
computed the number of USG covered by the applicator
separately. The covering performance of the applicator is
determined by the following equation:
1 2
Covering performance C 100
C
= × (5)
where, C1 is the No. of USG covered practically and C2
the No. of USG covered theoretically.
2.3.5 Pushing force requirement
The force requirement of operation was estimated in
the field testing the bed by using spring balance and
involving three persons. Spring balance was fixed
between pulling wire and one person pulled the applicator,
while another person logged the data of spring balance
and rest person holds handle of the applicator alongside
with line of action.
2.3.6 Cost comparison
The costs per hectare of operation of the applicator
have been compared with the cost of manual operation.
The total cost of the applicator comprises both fixed and
variable cost, like depreciation, interest, labor cost, repair
and maintenance cost. The cost was determined by using
its maximum effective field capacity of the applicator.
3 Results and Discussion
The performance evaluation was carried out in the
field experiment and for the USG size of 2.7 g only.
3.1 Missing rate
The USG applicator was tested on a field with 970 cm
length and 400 cm width. It was found that on an average
6.25% of missing rate (Table 2) was occurred for both the
left and right hopper, respectively. Karim et al. (2015)
estimated 3% missing rate for pulling type USG
applicator. Ahamed et al. (2014) calculated the missing
rate of BARI, BRRI and BAU model for the USG size of
1.8 g and 2.7 g were 10.2%, 6.2% and 1.4%, respectively.
Whether the constructional difference over BARI, BRRI
and BAU models were improved cage wheel, metering,
four drive wheels, and a main frame. On the other hand,
for USG size of 1.8 g, the corresponding values were
found 8.6%, 4.0% and 0.6%, respectively. The average
distance among the dropped USG was found 41.61 cm
(Figure 8), when the applicator was operated in dry land.
distance between USG to USG for the both hoppers were
40 cm. Wohab et al. (2017) figured that the
“injector-type” and “push-type single row” applicators
consistently employed USG at proper depth and spacing
under different rice field conditions. However, the study
proclaims an acceptable output of missing rate but several
reasons identified that may increase missing rate were
skidding of the applicator due to uneven surface, failure
of conveying USG to the cup of the metering device,
clogging in the discharge tube and type of soil etc., which
left a scope to the further improvement of the USG
applicator.
Table 2 Field test result of missing rate
Number of USG dropped practically Missing rate (%) Obs No. Total length of field
(cm)
Standard distance to drop USG (cm)
Number of USG dropped theoretically
LH RH LH RH
Average Missing Rate (%)
1 970 40 24 23 22 4.17 8.33
2 970 40 24 22 23 8.33 4.17
3 970 40 24 23 22 4.17 8.33
4 970 40 24 23 22 4.17 8.33
5 970 40 24 23 22 4.17 8.33
6.25
Note: *LH, RH indicates left hopper and right hopper, respectively
Figure 8 Average distance among dropped USG
3.2 Applicator capacity
The study demonstrates that the average applicator
capacity (Table 3) for the both left and right hopper of the
USG applicator was 13.21 kg h-1. In case of USG size of
2.7 g, Ahamed et al. (2014) found the applicator capacity
of the BARI and BAU model were 21.20 kg h-1 and
17.33 kg h-1 respectively. However, the applicator capacity
of the same model was 13.60 kg h-1 and 15.10 kg h-1,
correspondingly with respect to the USG size of 1.8 g.
The study reveals that the performance of the applicator
capacity is reasonable because the higher value of
applicator capacity will cause overfalling and lower value
will result a higher missing rate.
Table 3 Field test result of applicator capacity
No. of USG dropped
No. of USG in hopper before operation
No. of USG in hopper after operation
Weight of USG dropped (g) Obs.
No.
Time taken to Operate
(s)
LH RH Weight of
dropped USG
(g) LH RH LH RH LH RH
Total weight of USG dropped (LH+RH) (g)
Applicator Capacity
(kg h-1) Avg.
1 34 23 22 2.7 150 150 127 128 62.1 59.4 121.5 12.86
2 35 22 23 2.7 100 100 78 77 59.4 62.1 121.5 12.50
3 30 23 22 2.7 100 100 77 78 62.1 59.4 121.5 14.58
4 33 23 22 2.7 100 100 77 78 62.1 59.4 121.5 13.25
5 34 23 22 2.7 100 100 77 78 62.1 59.4 121.5 12.86
13.21
Note: LH, RH indicates left hopper and right hopper, respectively
3.3 Field capacity
Machine was operated on a field size of 40 m×10 m,
for the determination of the field capacity. The estimated
average effective field capacity and field efficiency
(Table 4) of the USG applicator was 0.163 ha h-1 and
88.1%, respectively. Karim et al. (2015) estimated the
effective field capacity was 0.14 ha h-1 and field
efficiency was 78.4% of the applicator for applying USG.
Furthermore, the effective field capacity was found
0.147 ha h-1 and 0.154 ha h-1 for the BARI and BAU
model, respectively in case of USG size of 2.7 g.
However, the corresponding findings were 0.144 ha h-1
and 0.146 ha h-1 with respect to the USG size of 1.8 g
(Ahamed et al., 2014). He also assessed field efficiency
for USG size of 2.7 g was 91.3% and 86.5% for the BARI
and BAU model respectively and for the USG size of
1.8 g corresponding values were 91.7% and 89.6%,
compared to the previously conducted studies.
3.4 Covering performance
Covering performance of the USG applicator is
tabulated in Table 5. The Average covering
performance was found 77.5%. Wohab et al. (2017)
disclosed that in case of Injector-type and Push-type
single row applicators, the average performance was quite
similar. The finding shows a quite standard result to
accumulate nitrogen in the soil. Also, about 22.5% USG
was left uncovered which was lost by volatilizing to air.
Reasons behind this loss were by skidding of the applicator
due to uneven surface and the operational speed.
Table 4 Field test result of field capacity
Obs. No.
Effective field capacity (ha h-1)
Avg. Effective field capacity (ha h-1)
Speed, (km h-1)
Width of coverage (m)
Theoretical field capacity (ha h-1)
Field efficiency (%) 1 0.162 2 0.168 3 0.165 4 0.160 5 0.161
0.163 2.31 0.80 0.185 88.1
Table 5 Field test result of covering performance
No. of USG dropped
No. of USG uncovered
No. of USG covered practically
No. of USG covered theoretically
Covering performance (%) Obs. No. Length of field,
(cm)
LH RH LH RH LH RH LH RH LH RH
Avg. Covering performance
(%)
1 970 23 22 2 6 21 16 24 24 87.5 66.67
2 970 22 23 3 5 19 18 24 24 79.17 75.00
3 970 23 22 2 6 21 16 24 24 87.5 66.67
4 970 23 22 2 5 21 17 24 24 87.5 70.83
5 970 23 22 2 6 21 16 24 24 87.5 66.67
77.5
Note: LH, RH indicates left hopper and right hopper, respectively
3.5 Pushing force requirement
The field test result of pushing force requirement
indicated in Table 6. For the pulling type USG applicator
with the weights of 12 kg, Karim et al. (2015) figured
pulling force was 108 N. With the machine weights of
11.97 kg, the average pushing force was found 69.18 N,
which implies the ease of handling of the machine.
Pushing force is highly correlated with two governing
factors such as weight of the applicator and the amount of
moisture in the muddy soil.
Table 6 Field test result of pushing force requirement
Obs. No. Pulling force (kg) Pulling angle (degree) Pushing angle (degree) Pulling force (N) Pushing force (N) Average pushing force (N)
1 6.6 30 25 56.07 61.87
2 7.2 30 25 61.17 67.49
3 7.7 30 25 65.42 72.18 69.18 N
4 7.4 30 25 62.87 69.37
5 8.0 30 25 67.97 75.00
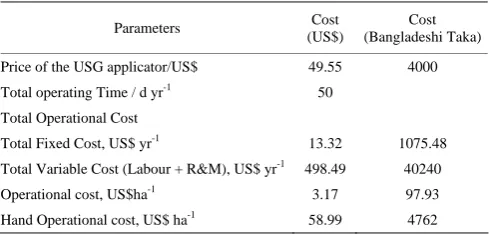
3.6 Economic performance
Economic performance of the USG applicator was
given in Table 7. Assuming an economic life of five years
of the applicator with 10% salvage value, it was estimated
that the operating cost of the applicator was Bangladeshi
Tk. 256 ha-1, whereas the operating cost for manual USG
application was Bangladeshi Tk. 4762 ha -1. Finally, the
study demonstrates that the applicator saved about 19%
cost compared to manual application. Additionally, the
total operating time was 50 d yr-1. Hoque et al. (2013)
figured their applicator saved up to 16.667% cost rather
than the manual application. While performing the
economic performance only labor cost was taken into the
account.
Table 7 Economic performance of the USG applicator
Parameters Cost
(US$)
Cost (Bangladeshi Taka)
Price of the USG applicator/US$ 49.55 4000
Total operating Time / d yr-1 50
Total Operational Cost
Total Fixed Cost, US$ yr-1 13.32 1075.48
Total Variable Cost (Labour + R&M), US$ yr-1 498.49 40240
Operational cost, US$ha-1 3.17 97.93
Hand Operational cost, US$ ha-1 58.99 4762
4 Conclusions
A urea super granule applicator was designed and
safeguard the increased agricultural yield. The main
constructional difference between this device and the
traditional device was the insertion of a four-drive wheel
instead of traditional float device. The four-drive wheel
helped minimize friction and ease of handling. Also, a
main frame was installed to enhance durability and
stability of the applicator. For better performance the
cage wheel and metering device were redesigned. The
developed applicator requires a small pushing force of
69.2 N, which leads a stress-free operation of the
applicator. The value of effective field capacity and field
efficiency was found 0.16 ha h-1 and 88.1%, respectively
in the field test. Furthermore, in the field test, the study
reveals that the average missing rate, applicator capacity,
the distance of dropped USG and covering performance
were 6.25%, 13.21 kg h-1, 41.61 cm, and 77.5%,
respectively. And from the economic perspective, the
urea super granule applicator can save approximately
19% cost compared to the manual application. The
developed urea super granule applicator could be
introduced to the small growers in Bangladesh as well as
in other rice growing countries.
References
Ahamed, M. S., A. T. M. Ziauddin, and R. I. Sarker. 2014. Design of improved urea super granule applicator. International Journal of Applied Science and Engineering Research, 3(1): 98–104.
Ahmed, M. R., M. M. Billah, and A. T. M. Ziauddin. 2013. Battery operated USG applicator. Progressive Agriculture, 23(1&2): 75–80.
Roy, A. H. 2011. Research on the next generation of fertilizers.
Presented at the Syngenta Foundation for Sustainable Agriculture, IFDC, Basel, Switzerland.
Bautista, E. U., M. Koike, and D. C. Suministrado. 2001. Mechanical deep placement of nitrogen in wetland rice. Journal of Agricultural Engineering Research, 4(78): 333–346.
Hoque, M. A., M. A. Wohab, M. A. Hossain, K. K. Saha, and M. S. Hassan. 2013. Improvement and evaluation of Bari USG applicator. CIGR Journal, 15(2): 87–94.
Hossain, M. T. 1998. USG demonstration result for 1996-97 and 1997-98. In National Workshop on Urea Super Granule Technology (USG), BARC, Dhaka, Bangladesh, 25 June 1998. Karim, M. F., M. Alam, M. R. Ali, and O. Kozan. 2015. Design and development of a drum seeder with urea super granule application for rural farmers in Bangladesh. CIGR Journal, 17(3): 61–71.
Kepner, R. A., R. Bainer, and E. L. Berger. 1978. Principles of Farm Machinery. Westport, CT: AVI Publishing Company Mohammed, S. A., D. Ahmad, O. Jamarei, S. Samsuddin, and M.
Norhisam. 2011. Evaluation of a dual-purpose chemical applicator for paddy fields. American Journal of Applied Sciences, 8(4): 362–367.
Prasad, R., and S. K. Datta. 1978. Increasing fertilizer nitrogen efficiency in wetland rice [in tropical Asia]. In Nitrogen and Rice Symposium. College, Laguna (Philippines). 18–21 Sep 1978.
Savant, N. K., and P. J. Stangel. 1990. Deep placement of urea super granules in transplanted rice: principles and practices. Nutrient Cycling in Agro Ecosystems, 25(1): 1–83.
Savant, N. K., P. S. Ongkingco, I. V. Zarate, F. M. Torrizo, and P. J. Stangel. 1991. Urea briquette applicator for transplanted rice. Fertilizer Research, 28(3): 323–331.