Geosci. Commun., 2, 55–67, 2019 https://doi.org/10.5194/gc-2-55-2019
© Author(s) 2019. This work is distributed under the Creative Commons Attribution 4.0 License.
ar
ticle
Identifying and improving AGU collaborations using
network analysis and scientometrics
Tom Narock, Sarah Hasnain, and Ronie Stephan
Notre Dame of Maryland University, Baltimore, MD 21210, USA
Correspondence:Tom Narock ([email protected])
Received: 25 September 2018 – Discussion started: 16 October 2018
Revised: 9 January 2019 – Accepted: 1 February 2019 – Published: 20 February 2019
Abstract. The American Geophysical Union (AGU) is an Earth and space science professional society based in the United States. Research conducted by AGU members ranges from the Earth’s deep interior to the outer planets of our solar system. However, little research exists on the AGU meeting itself. In this work, we apply network analysis and sciento-metrics to 17 years of AGU Fall Meetings. We are interested in the AGU network structure and what its properties can tell us about how the procedures of the AGU Fall Meeting can be enhanced to facilitate better scientific communication and collaboration. We quantify several network properties and il-lustrate how this type of analysis can enhance meeting plan-ning and layout. We conclude with practical strategies for the AGU Program Committee.
1 Introduction
The American Geophysical Union (AGU) is an Earth and space science professional society based in the United States. The AGU publishes scientific journals, sponsors meetings, and supports education and outreach efforts to promote pub-lic understanding of science. Research conducted by AGU members ranges from the Earth’s deep interior to the outer planets of our solar system. Despite theAmericanin its name, roughly 40 % of the AGU’s membership comes from outside of the U.S.1
Each year, the AGU hosts a Fall Meeting that draws tens of thousands of participants. The research presented at these meetings has been discussed and debated extensively. How-ever, little research exists on the AGU meeting itself. In this
1Based on data from the AGU’s membership page: https://
membership.agu.org/ (last access: 6 September 2018).
work, we apply network analysis and scientometrics to 17 years of AGU Fall Meetings. We model the AGU Fall Meet-ings as graphs in which presentation co-authors are con-nected nodes and analyze these graphs to ascertain their structure and properties. We are interested in what the struc-ture and network properties can tell us about the scientomet-rics of the AGU.
Scientometrics is the science of measuring and analyz-ing science itself, such as a discipline’s structure, growth, change, and interrelations (Hood and Wilson, 2001). Vass-ily Nalimov first coined the term in the 1960s and subse-quent work has focused on a discipline’s methodologies and principles as well as individual researchers’ scientific output (Braun et al., 2006; Hirsch, 2005). Here, we are using “scien-tometrics” in the general sense of “the science of science” to understand how science operates and can be improved. Our work is an exploration of possible approaches to developing scientometrics within the Earth and space sciences. We are interested in how science collaboration and networking are taking place and how the procedures of the AGU Fall Meet-ing could be enhanced to facilitate better scientific commu-nication and collaboration. We provide suggestions on how our work can be operationalized; however, we are currently not at an operational stage.
2 Dataset, assumptions, and limitations
2.1 Dataset
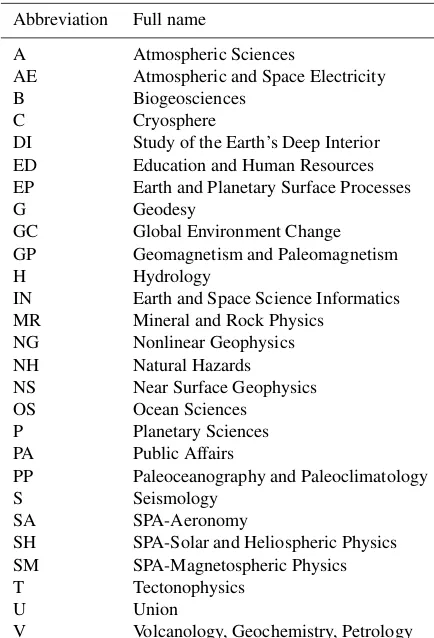
Table 1.The AGU sections covered in this study.
Abbreviation Full name
A Atmospheric Sciences
AE Atmospheric and Space Electricity B Biogeosciences
C Cryosphere
DI Study of the Earth’s Deep Interior ED Education and Human Resources EP Earth and Planetary Surface Processes
G Geodesy
GC Global Environment Change GP Geomagnetism and Paleomagnetism
H Hydrology
IN Earth and Space Science Informatics MR Mineral and Rock Physics
NG Nonlinear Geophysics NH Natural Hazards NS Near Surface Geophysics OS Ocean Sciences
P Planetary Sciences PA Public Affairs
PP Paleoceanography and Paleoclimatology
S Seismology
SA SPA-Aeronomy
SH SPA-Solar and Heliospheric Physics SM SPA-Magnetospheric Physics T Tectonophysics
U Union
V Volcanology, Geochemistry, Petrology
Fall Meeting, such as the Ocean Sciences Meetings; however, we limited our study to Fall Meetings only. The Fall Meet-ings are multidisciplinary and provide the largest most com-prehensive subset of data available. Restricting our study to Fall Meetings provides the most data and also ensures equal coverage of the sub-domains covered by the AGU. Our study includes 17 years of data and covers the Fall Meetings from 2000 to 2017.
The AGU is divided into sections representing the subdis-ciplines of Earth and space science. As science evolves over the years, new sections are formed, and older ones can be merged or dissolved. The sections on which we had data to perform our analysis are listed in Table 1.
Data were retrieved by programmatically querying the AGU Abstract Browser’s Linked Open Data interface (http: //abstractsearch.agu.org/about/lod, 6 September 2018; http: //abstractsearch.agu.org:8890/sparql, 6 September 2018). Linked Open Data (LOD, Berners-Lee, 2006; Bizer et al., 2009) are part of the methods and tools collectively known as theSemantic Web(Hitzler et al., 2010), which aim to bring machine-readable meaning to the Web through common data formats, exchange protocols, and computational reasoning. The LOD methodology has become a widely adopted data sharing format and, at last count (Hogan et al., 2011), roughly
30 billion semantic statements were available on the emerg-ing “Web of Data”. In 2012 the AGU’s historical abstracts were converted to LOD (Narock et al., 2012; Rozell et al., 2012), with new meeting data being added each year.
2.2 Limitations and assumptions
higher had we been able to uniquely identify all authors in our dataset. Despite this limitation, we feel our analysis can still provide useful insights into the AGU meetings.
All networks are comprised of nodes (also called vertices) and edges (connections between the nodes). Networks also come in multiple types ranging from directed to undirected. Twitter is an example of a directed network. Edges have di-rectionality in a directed network. For example, Twitter user A can follow user B; however, user B is not obligated to fol-low user A back. The edge between users A and B would have directionality. In an undirected network all edges are bidirectional by default. This is how “friending” works in Facebook. Both users (nodes) must agree to the “friendship” and a link (edge) is created. There are no directed edges al-lowed in an undirected network.
We model each AGU section as an undirected network based on co-authorship. If A co-authored a presentation with B and C, then A, B, and C become nodes in the network with bidirectional links between each (e.g., A–B, A–C, B–C). We do not apply any weighting to the edges. If authors A and B co-authored a presentation at the 2000 Fall Meeting and then again at the 2010 Fall Meeting, this adds no new in-formation to the graph. We also consider edges to be eternal when studying the temporal evolution of the network. For example, if authors A and B co-authored a presentation at the 2000 Fall Meeting, these nodes and edges persist in 2017 even if those authors never co-authored another presentation. We also note that we are measuring co-authorship and not necessarily collaboration. Our dataset does not contain ref-erences and acknowledgements used in presentations. These secondary connections (e.g., citing a paper or acknowledging a discussion) do not show up as edges in our graphs.
2.3 Open-source software
The analysis software used in this study is freely and pub-licly available from Narock and Hasnain (2019). The graph data generated from our software are available in Narock et al. (2018)
3 Network analysis
3.1 Network density
Network density is defined as the ratio of actual connections to possible connections. Possible values for network density range from 0 (no connections at all) to 1 (everyone is con-nected to everyone else). Figure 1 illustrates the concept of network density on sample networks. In panel (a) of Fig. 1 there are three nodes and three potential connections. These three potential connections are realized as all nodes are con-nected to each other. This is representative of the AGU case in which A, B, and C have co-authored presentations with each other, although not necessarily the same presentation. The network in Fig. 1a has a density of 3/3=1.
Figure 1.Example networks and network density.
The network shown in Fig. 1b has the same three poten-tial connections. However, only two of the nodes are directly connected. In this example, A has co-authored a presenta-tion with B and B has co-authored a presentapresenta-tion with C; however, A has not co-authored a presentation with C. The network in Fig. 1b has a density of 2/3=0.67.
It is unlikely that a real-world network such as the AGU would have the network density of Fig. 1a. Given the diver-sity of research topics it is unlikely that the network would be completely connected. But what are the actual density values and how do they change over time?
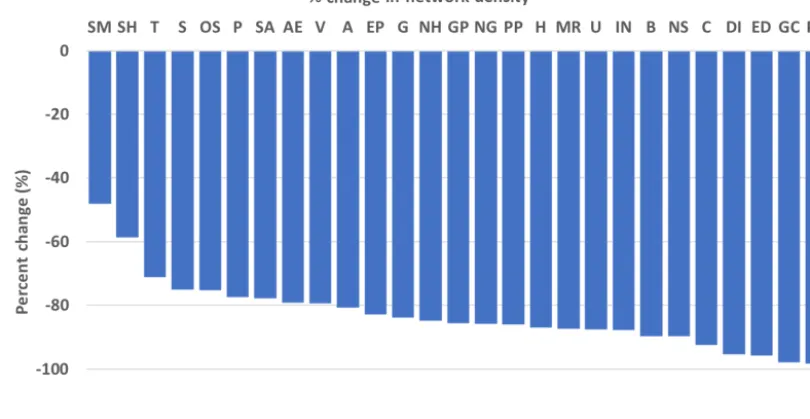
To answer these questions, we first considered each AGU section to be its own network. Yearly network graphs were then created for each section using the Abstract Browser data. Next, we computed the percentage change in network density for each section. We note that percentage change val-ues do not always encompass the entire 17 years of the data. For example, the Earth and Space Science Informatics (IN) section did not come into existence until 2005. Percentage change was computed using the first year in which we had data and 2017. Results are shown in Fig. 2.
Network density decreases for all sections. This tells us that nodes are being added faster than edges. In practical terms, the rate at which new people (nodes) are attending AGU sessions is greater than the rate at which continuing at-tendees (nodes) are making new connections. Again, these percentage change values should be considered a lower limit given our inability to completely disambiguate the authors in our data.
Figure 2.Percentage change in network density.
Figure 3.An illustration of connected components. This graph has
three connected components.
3.2 Connected components
In graph theory, a connected component of an undirected graph (also referred to as a component) is a subgraph within the whole graph. Figure 3 shows an example. The network in the figure is comprised of three connected components. Although not shown here, an isolated node not connected to any other nodes in the network is also considered a connected component. Analysis of connected components within the AGU networks gives us an indication of how fragmented the networks are.
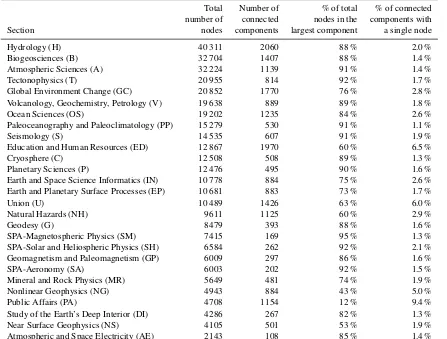
Table 2 lists the connected components of the AGU sec-tion graphs. Specifically, we combined all 17 years of data for each section and computed the number of connected com-ponents for the section, the percentage of the total nodes that make up the largest component, and the percentage of com-ponents comprised of a single node. Sections in Table 2 are ordered by decreasing size (number of nodes).
The diversity of research topics likely guarantees that we are going to have some fragmentation of the network. Not everyone is working on the same topic and we would expect to see the number of connected components greater than 1. Moreover, there is nothing wrong with working by oneself, and single-node components are to be expected. However, quantifying these network features helps in the development of geoscience communication strategies. From Table 2 we see that the majority of available nodes are part of the largest connected component. This is true regardless of section size. The only notable exceptions are Public Affairs and Non-linear Geophysics. Similarly, we see a very small percent-age of single-node components. Notable exceptions here are Public Affairs, Education, and Union. Public Affairs, Educa-tion, and Union often have contributions from other sections, which likely accounts for the increased fragmentation and single-node components, although the Nonlinear Geophysics result is surprising and in need of further research.
3.3 Multidisciplinary authors
Table 2.Connected components of AGU section graphs (sorted by network size).
Total Number of % of total % of connected number of connected nodes in the components with
Section nodes components largest component a single node
Hydrology (H) 40 311 2060 88 % 2.0 %
Biogeosciences (B) 32 704 1407 88 % 1.4 %
Atmospheric Sciences (A) 32 224 1139 91 % 1.4 %
Tectonophysics (T) 20 955 814 92 % 1.7 %
Global Environment Change (GC) 20 852 1770 76 % 2.8 %
Volcanology, Geochemistry, Petrology (V) 19 638 889 89 % 1.8 %
Ocean Sciences (OS) 19 202 1235 84 % 2.6 %
Paleoceanography and Paleoclimatology (PP) 15 279 530 91 % 1.1 %
Seismology (S) 14 535 607 91 % 1.9 %
Education and Human Resources (ED) 12 867 1970 60 % 6.5 %
Cryosphere (C) 12 508 508 89 % 1.3 %
Planetary Sciences (P) 12 476 495 90 % 1.6 %
Earth and Space Science Informatics (IN) 10 778 884 75 % 2.6 % Earth and Planetary Surface Processes (EP) 10 681 883 73 % 1.7 %
Union (U) 10 489 1426 63 % 6.0 %
Natural Hazards (NH) 9611 1125 60 % 2.9 %
Geodesy (G) 8479 393 88 % 1.6 %
SPA-Magnetospheric Physics (SM) 7415 169 95 % 1.3 %
SPA-Solar and Heliospheric Physics (SH) 6584 262 92 % 2.1 %
Geomagnetism and Paleomagnetism (GP) 6009 297 86 % 1.6 %
SPA-Aeronomy (SA) 6003 202 92 % 1.5 %
Mineral and Rock Physics (MR) 5649 481 74 % 1.9 %
Nonlinear Geophysics (NG) 4943 884 43 % 5.0 %
Public Affairs (PA) 4708 1154 12 % 9.4 %
Study of the Earth’s Deep Interior (DI) 4286 267 82 % 1.3 %
Near Surface Geophysics (NS) 4105 501 53 % 1.9 %
Atmospheric and Space Electricity (AE) 2143 108 85 % 1.4 %
B–H entry in Fig. 4 is this 8000 value divided by the total number of nodes in B and H.
Aside from the related space physics sections of SH and SM, we do not see a significant amount of presentations across sections. Authors tend to stay within their primary do-mains.
3.4 Keyword usage across sections
Authors submitting to the Fall Meeting are asked to tag their abstracts with keywords from the AGU’s keyword hi-erarchy (https://publications.agu.org/author-resource-center/ index-terms/, last access: 6 September 2018). We computed counts of each keyword category for each year of our dataset across all sections. For instance, Post-secondary Education andTeaching Methodsare sub-topics within the higher-level Education section of the keyword hierarchy. If the Hydrol-ogy section had an abstract tagged withPost-secondary Ed-ucationin 2005 and an abstract tagged withTeaching Meth-ods in 2005, then this would be counted as twoEducation abstracts for the year 2005. We note that abstracts are not exclusive to one keyword group. Authors are free to self-tag their abstracts with multiple keywords that may span
multi-ple parts of the keyword hierarchy. This is reflected in our analysis where the same abstract may contribute to keyword usage counts in multiple parts of the keyword hierarchy.
For clarity of display, we filtered out keyword groups that did not reach 100 occurrences during the 17 years in which we had data. Figures 5 through 8 highlight specific trends in keyword usage that were observed in our data. The full set of images showing keyword usage from all keyword categories is included in the Supplement.
3.4.1 Scenario 1 – two (or more) seemingly unrelated groups use the same topics
Figure 4.Normalized number of occurrences of authors presenting in more than one section over the years 2000–2017. The fractional values in each pair-wise comparison are the number of authors pre-senting in those sections over the time period 2000–2017 divided by the size of both sections.
in Fig. 5. However, we also see a sharp rise in the Natural Hazards section’s usage of IN keywords from 2016 to 2017. Prior to 2016, the Natural Hazard section never had a year in which they received more than 33 abstracts tagged with IN keywords (see 2010 through 2013 in Fig. 5). Suddenly, in 2017 they received 270 abstracts tagged with IN keywords. This is up from four such abstracts in 2016. The bulk of these 270 abstracts in 2017 can be attributed to theData Assimila-tion, IntegraAssimila-tion, and Fusion andForcasting topics. These two keyword categories accounted for 87 % of the Natural Hazard IN-related abstracts in 2017. In this particular case, it appears to be specific sessions soliciting topics as opposed to organic emergence of collaborations. The vast majority of these submissions are to one session, NH23E.
To us, this is indicative of the power of simple scientomet-ric visualizations. By simply counting keywords we can be-gin to identify emerbe-ging trends, which, as we discuss further in the next section, can be exploited by meeting and section leadership to better structure future Fall Meetings. Further, more detailed analysis, such as the example above, identifies very effective session planning and emerging science, which can further be exploited by section leadership and the AGU Program Committee.
3.4.2 Scenario 2 – increase in volume
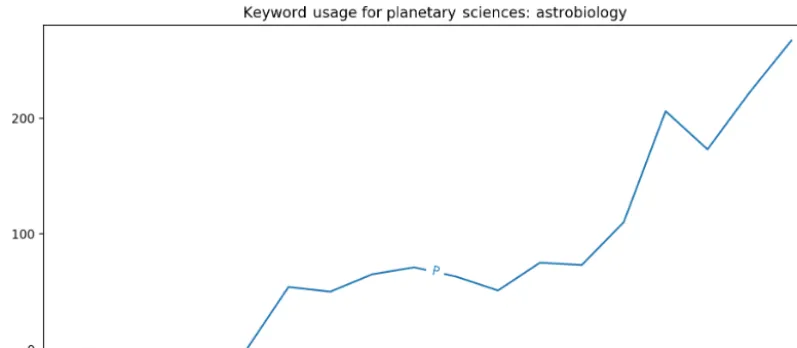
The Planetary Science section is the primary user of Astro-biology keywords as shown in Fig. 6. Usage from 2005 to 2010 was more or less consistent. However, beginning in 2011 a sudden increase in usage is seen that continues to today. A similar trend is seen with Education keywords in
Fig. 7. In 2015, Public Affairs and Union sessions saw an increase in abstracts tagged with Education keywords. How-ever, while Public Affairs usage of Education keywords in-creased gradually, Union’s usage of the same keywords had a sudden uptick in 2017.
It may not be surprising that planetary scientists are using astrobiology terms to tag their abstracts. Meeting attendees may even have anecdotal evidence of observing this them-selves. However, had someone been tracking these data in 2012 and 2013 we could have seen this trend emerging. This information could have gone into meeting planning and po-tentially led to more physical space at the meeting venue, joint sessions, increased public outreach, and other initiatives that could have maximized the dissemination of astrobiology science.
The related trend, Fig. 7, shows Union sessions having a sudden uptick in Education-related. A scientometrics- and data-driven AGU could leverage this information in being proactive with joint sessions and when/where presentations are given at the Fall Meeting. We explore this in more detail in the next section.
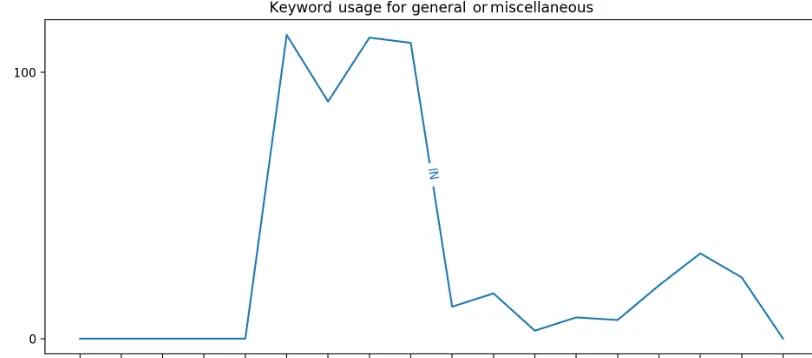
3.4.3 Scenario 3 – keyword usage may indicate new science
The Earth and Space Science Informatics section was formed in 2005. From 2005 until 2008 this section did not have any section-specific keywords in the aforementioned AGU key-word hierarchy. In 2009 IN-specific keykey-words were intro-duced. We see this clearly in Fig. 8 where IN’s usage of General or Miscellaneouskeywords decreased significantly between 2008 and 2011 as IN-specific keywords began to be used. However, we also see a steady increase inGeneral or Miscellaneous from 2011 to 2015. Further analysis of this keyword group reveals steady usage ofGeneral or Miscella-neous: Instruments useful in three or more fieldsandGeneral or Miscellaneous: Techniques applicable in three or more fieldsduring the time period 2011 to 2015. This is suggestive to us that emerging computational approaches and collabora-tions are not adequately reflected in the AGU keyword hierar-chy. This may be more than just the frustration of not finding an appropriate keyword to tag one’s abstract. New science may be emerging that could be capitalized on in subsequent Fall Meetings if we are watching the evolution of the AGU network. Further exploration of this particular trend would involve more data than we currently have available and is outside of our current scope.
4 Scientometrics
Figure 5.Informatics-themed keyword usage.
Figure 6.Astrobiology keyword usage.
of interest. Using network analysis and having section lead-ers be proactive prior to a meeting can improve efficiency of science communication and collaboration.
In regard to network density and connected components, there is no optimal network clustering value. However, lower density networks comprised of many loosely connected clus-ters have been shown to be beneficial (Burt, 2004). In these networks, everyone does not already know each other, and multiple clusters lead to new and unique perspectives. By contrast, when everyone knows everyone else (density=1), you are more likely to repeatedly hear the same ideas (Burt, 2004).
In order for information to spread across a network, there need to be connections between the clusters. We want to avoid the scenario depicted in Fig. 3 and have at least one connection between each connected component in an AGU section. Knowing how many connected components there
are, what the primary research topic of each is (most used keyword), and whom the components are comprised of can be beneficial for meeting planners and section leadership. For the AGU Fall Meeting, session proposal is open to any self-organized group of up to four AGU members. Authors then opt to have their submission assigned to a particular session. We could make this process more proactive by providing section leadership with connected component data and en-couraging connections between specific AGU members. This could range from informal networking events to suggesting session co-conveners.
4.1 Steps towards optimizing meeting space
hav-Figure 7.Education keyword usage.
Figure 8.General or miscellaneous keyword usage.
ing all of its talks grouped in the same part of the build-ing. The poster hall is organized alphabetically by section. What if we leveraged what we are seeing in Figs. 5 and 7 to physically place related sections next to each other? For example, the Fall Meeting could place Natural Hazards posters next to Informatics posters to stimulate more discus-sion. Similarly, Public Affairs and Union sessions could be physically located near Education sessions and, having iden-tified the trend in Fig. 7, attendees could be encouraged to visit related presentations they may not otherwise be aware of. The AGU has been exploring a related idea via their Scientific Neighborhoods (https://fallmeeting.agu.org/2018/ scientific-neighborhoods/, last access: 21 January 2019), al-though, to the best of our knowledge, Scientific Neighbor-hoods are not based on any network analysis.
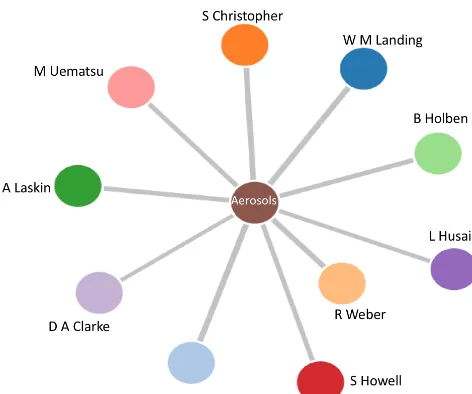
Another option is to facilitate navigation of the meeting via analytics tools built on top of the AGU’s historic meeting
data. A simple example is shown in Fig. 10. This so-called force-directed graph adds additional information to a stan-dard network graph. In a force-directed graph the distance between two nodes is indicative of the strength of the connec-tion. For instance, in Fig. 10 we show the 10 AGU members who most used the oceanographicAerosolskeyword. R. We-ber used this keyword the most over the 17-year period 2000 to 2017. This is indicated in the figure where the R. Weber node is closest to the centralAerosolsnode.
Figure 9.Number of presentations given at AGU Fall Meetings each year.
Figure 10. Force-directed graph of oceanographic aerosols
key-word usage.
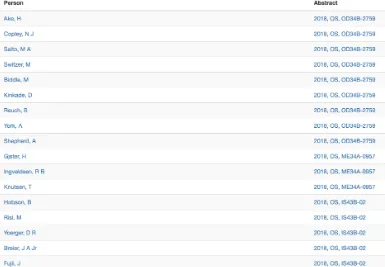
show an example tool we built for the AGU Open API Chal-lenge (https://developer.agu.org/projects/, http://apiprojects. agu.org/project1/, last access: 6 September 2018). After iden-tifying a researcher, possibly through a visualization like Fig. 10, the user is guided through finding that researcher in the historical abstract database (Figs. 11 and 12). The co-authorship network is then leveraged to identify all AGU presenters who have co-authored a presentation with the re-searcher of interest. Figure 13 shows an example for our col-league Peter Wiebe. For brevity, only the 2018 co-authors are shown in the figure. The Abstract column in Fig. 13 lists the year of presentation, the section of the presentation, and the presentation ID. Each row in the Abstract column is a clickable link that will take the user to a web page displaying the presentation title, keywords, and abstract. In this manner, AGU attendees can follow the network to explore existing connections amongst nodes and topics. At present, Fall Meet-ing data will not be available in the Abstract Browser until
Figure 11.Step one of the author search tool.
Figure 12.Step two of the author search tool. The system returns
all matching authors.
after the Fall Meeting concludes. Making these data avail-able prior to the meeting could lead to new tools and apps. The AGU does appear headed in this direction with its recent Open API Challenge.
4.2 Steps toward gender equality
Ford and colleagues (Ford et al., 2018) have identified a gen-der imbalance in AGU presentations. Women are invited and assigned oral presentations less often than men. It was found that male primary conveners allocate invited abstracts and oral presentations to women less often and below the propor-tion of women authors. This trend was apparent regardless of the male primary conveners being students or at more senior career stages. Ford et al. (2018) also identified that women elect for poster-only presentations more so than men.
Figure 13.The result of our author search tool is a web table with links to everyone who has ever co-authored a presentation with the author of interest. Users can explore the abstracts and network connections of those co-authors – and their co-authors.
more open data may exacerbate the problem by exposing pre-senters to more opportunities for bias. We highlight these is-sues here as it is a discussion very much worth having. How-ever, at this time, we are unable to offer any additional data, insights, or strategies.
4.3 Steps toward connections to other networks
GeoLink (Narock et al., 2014; Krisnadhi et al., 2015; Cheatham et al., 2018) is a collection of Linked Open Data that addresses scholarly discovery and collaboration in the geosciences. GeoLink leverages the Semantic Web to pub-lish open data regarding data centers, digital repositories, libraries, and professional societies. One component of the GeoLink knowledge graph (Cheatham et al., 2018) is a col-lection of all National Science Foundation (NSF) funded projects. Figure 14 (reproduced from Narock and Wimmer, 2017) illustrates what can be done when one network is con-nected to another. This figure is produced by subsetting the GeoLink NSF-funded projects by people who have presented at the AGU. In particular, we are looking at Semantic Web and semantic integration– a keyword in the Informatics por-tion of the AGU keyword hierarchy. Combining these two open datasets allowed us to identify which AGU authors had active funded grants at the time of their AGU presentation. We define “active funded grant” as the AGU presentation date falling between the NSF grant’s start and end dates. We then looked at the distribution of funding sources. Figure 14
shows the NSF divisions and offices that have funded an AGU author’s semantic project. This is only one example and specific to one topic area. However, it illustrates the potential of open science and cross-organizational network analysis. We can begin to see how this research topic is funded by the NSF. In addition, we can start to see the scientific re-sults (AGU presentations) attributable to each NSF division. In this regard, AGU scientometrics can go beyond optimiz-ing Fall Meetoptimiz-ings to more general enhancements of open sci-ence and scisci-ence communication. Exponential growth is be-ing observed with the amount of available Linked Open Data roughly doubling each year. Corporations (e.g., the BBC and BestBuy), governments (e.g., the US and UK governments), Wikipedia, social networking sites (e.g., Flickr, Facebook and Twitter), and various academic communities are all con-tributing to the movement (Hogan et al., 2011). We encour-age the AGU to do the same.
5 Conclusions
Figure 14. An example of combining network data. Here, AGU and NSF networks are merged to identify where AGU presenters are receiving their funding.
how we present our science over the next 100 years. We con-clude with a summary of recommendations.
Further explore the percentage change in network density. The AGU is highly invested in collaboration, as evidenced by Science Neighborhoods, Town Halls, and related events. If edges are being added at a rate far below the rate of new nodes, are these collaboration events truly effective?
Explore connected components to identify clusters of re-search topics and who comprises each cluster. Combina-tion with other datasets to identify career status (e.g., stu-dent, early career, senior researcher) can be helpful for the Program Committee in balancing session chairs. Connected component analysis may also be helpful in recommending collaboration amongst components.
The AGU covers a wide cross section of the geosciences. However, the number of researchers presenting across sec-tions appears minimal. The analysis of keywords reveals there are numerous sections interested in the same topics. The AGU should take steps to enhance presentations across sections.
Scientometric analysis can reveal emerging trends and hid-den patterns. We advocate for the release of program data prior to the Fall Meeting and the development of open tools that leverage these data. Narock (2018) presented techniques that can help operationalize this into predictive analytics.
Unique identifiers, such as ORCID and the Global Re-search Identifier Database, can be used to clearly identify researchers and organizations.
Data availability. The software used in this paper is available from https://doi.org/10.5281/zenodo.2536282 (Narock and Hasnain, 2019) and the data are available via https://doi.org/10.6084/m9.figshare.6625673.v1 (Narock et al., 2018). See the Reference section for complete citations.
Supplement. The supplement related to this article is available
online at: https://doi.org/10.5194/gc-2-55-2019-supplement.
Author contributions. TN was responsible for data acquisition
and most of the analysis software used in this project. He also con-tributed as the lead writer of the manuscript. Authors SH and RS assisted with data analysis by contributing portions of analysis soft-ware and assisting in the interpretation of the data.
Competing interests. The authors declare that they have no
con-flict of interest.
Acknowledgements. This research was conducted while Sarah
Hasnain and Ronie Stephan were students at Notre Dame of Mary-land University. We are grateful for National Science Foundation award no. 1704896, EarthCube Building Blocks: Collaborative Proposal: GeoLink - Leveraging Semantics and Linked Data for Data Sharing and Discovery in the Geosciences, which supported them as undergraduate and graduate researchers, respectively.
The first author would also like to acknowledge the contributions of Eric Rozell and the Earth Science Information Partners (ESIP). Eric helped create the Linked Data version of the AGU Abstract Database used in this study while he was a student at Rensselaer Polytechnic Institute, Troy, NY. Eric’s work was made possible through an ESIP mini-grant. The work ESIP enabled, and Eric’s early discussions with the first author, helped lay the groundwork for the research presented here.
Edited by: Hazel Gibson
Reviewed by: Evan Goldstein, Mark Parsons, and Laura Kate Corlew
References
Berners-Lee, T.: Linked Data – Design Issues, available at: http: //www.w3.org/DesignIssues/LinkedData.html (last access: 20 May 2018), 2006.
Bizer, C., Heath, T., and Berners-Lee, T.: Linked Data – The Story So Far, Int. Jo. Seman. Web Informa. Syst., 5, 1–22, 2009. Braun, T., Glänzel, W., and Schubert, A.: A Hirsch-type index for
journals, Scientometrics, 69, 169–173, 2006.
Burt, R. S.: Structural Holes and Good Ideas, Am. J. Sociol., 110, 349–399, https://doi.org/10.1086/421787, 2004.
Cheatham, M., Krisnadhi, A., Amini, R., Hitzler, P., Janow-icz, K., Shepherd, A., Narock, T., Jones, M., and Ji, P.: The GeoLink knowledge graph, Big Earth Data, 2, 131–143, https://doi.org/10.1080/20964471.2018.1469291, 2018.
Ford, H. L., Brick, C., Blaufuss, K., and Dekens, P. S.: “Gen-der Representation of Speaking Opportunities at the Ameri-can Geophysical Union Fall Meeting”, EarthArXiv preprint, https://doi.org/10.17605/OSF.IO/6QHVD, 2018.
Haak, L. L., Fenner, M., Paglione, L., Pentz, E., and Ratner, H.: ORCID: a system to uniquely identify researchers, Learned Pub-lishing, 25, 259–264, https://doi.org/10.1087/20120404, 2012. Hirsch, J. E.: An index to quantify an individual’s scientific research
output, P. Natl. Acad. Sci. USA, 102, 16569–16572, 2005. Hitzler, P., Krötzsch, M., and Rudolph, S.: Foundations of Semantic
Web Technologies, CRC Press, Chapman and Hall/CRC, ISBN: 9781420090505, 2010.
Hogan, A., Zimmermann, A., Umbrich, J., Polleres, A., and Decker, S.: Scalable and distributed methods for entity match-ing, consolidation and disambiguation over linked data cor-pora, Web Semantics: Sci. Serv. Agents World Wide Web, https://doi.org/10.1016/j.websem.2011.11.002, 2011.
Hood, W. and Wilson, C.: The literature of bibliometrics, sciento-metrics, and inforsciento-metrics, Scientosciento-metrics, 52, 291–314, 2001 Krisnadhi, A., Hu, Y., Janowicz, K., Hitzler, P., Arko, R., Carbotte,
S., Chandler, C., Cheatham, M., Fils, D., Finin, T., Ji, P., Jones, M., Karima, N., Mickle, A., Narock, T., O’Brien, M., Raymond, L., Shepherd, A., Schildhauer, M., and Wiebe, P.: The GeoLink Modular Oceanographic Ontology, in: Proceedings of the Inter-national Semantic Web Conference 2015, Volume 9367 of the series Lecture Notes in Computer Science, 301–309, 2015. Narock, T.: Predictive Analytics in Earth Science
Communica-tion (Invited), Session IN11E, American Geophysical Union Fall Meeting, Washington DC, December, 2018.
Narock, T. and Hasnain, S.: narock/agu_analytics: First Re-lease of AGU Analytics Code (Version v1.0), Zenodo, https://doi.org/10.5281/zenodo.2536282, 2019.
Narock, T., Krisnadhi, A., Hitzler, P., Cheatham, M., Arko, R., Car-botte, S., Shepherd, A., Chandler, C., Raymond, L., Wiebe, P., and Finin, T.: The OceanLink Project, International Workshop on Challenges and Issues on Scholarly Big Data Discovery and Col-laboration, 2014, IEEE International Conference on Big Data, Washington DC, USA, 27 October 2014.
Narock, T., Hasnain, S., and Stephan, R.: AGU Network Analysis, figshare, Dataset, https://doi.org/10.6084/m9.figshare.6625673.v1, 2018.
Narock, T. W. and Wimmer, H.: Linked data scientometrics in se-mantic e-Science, Comput. Geosci., 100, 87–93, 2017.
Narock, T. W., Rozell, E. A., and Robinson, E. M.: Facilitating Col-laboration Through Linked Open Data, Abstract ED44A-02 pre-sented at 2012 Fall Meeting, AGU, San Francisco, California, 3–7 December 2012.
Rozell, E. A., Narock, T. W., and Robinson, E. M.: Creating a Linked Data Hub in the Geosciences, Abstract IN51C-1696 pre-sented at 2012 Fall Meeting, AGU, San Francisco, California, 3–7 December 2012.
Shanahan, D. R.: Auto-correlation of journal impact factor for con-sensus research reporting statements: a cohort study, PeerJ, 4, e1887, https://doi.org/10.7717/peerj.1887, 2016.