A
A
M
M
O
O
D
D
I
I
F
F
I
I
E
E
D
D
R
R
A
A
T
T
I
I
O
O
T
T
E
E
C
C
H
H
N
N
I
I
Q
Q
U
U
E
E
S
S
I
I
N
N
S
S
U
U
C
C
C
C
E
E
S
S
S
S
I
I
V
V
E
E
S
S
A
A
M
M
P
P
L
L
I
I
N
N
G
G
O
O
N
N
T
T
W
W
O
O
O
O
C
C
C
C
A
A
S
S
I
I
O
O
N
N
S
S
K
K
.
.
O
O
.
.
A
A
d
d
e
e
t
t
u
u
n
n
j
j
i
i
,
,
A
A
.
.
O
O
.
.
A
A
d
d
e
e
j
j
u
u
m
m
o
o
Department of Statistics, University of Ilorin, PMB 1515, Ilorin, Nigeria
Corresponding Author: K. O. Adetunji,[email protected]
ABSTRACT: Successive sampling is a known technique that can be used in longitudinal surveys to estimate population parameter and measurement of change or sum of study variables and auxiliary variables. However, the problem of ratio estimation is incorporated to successive sampling on the samples selected over two occasions has been considered. This study aimed at proposed Ratio Estimator technique in the context of devising efficient sampling strategies for estimators. The three estimators used as the instrument for parameter estimation in the successive sampling are Simple Estimator (SEst), Linear Estimator (LEst) and proposed Ratio Estimator (PRATEst). The proposed Ratio Estimator procedure was obtained through the properties of biasness, mean square Error (MSE), minimum mean square Errors (MMSE) and Efficiency comparison (EC). Two sets of Real life data were used in this study. The first data was collected from National Population Commission (NPC) of the census conducted in Nigeria for year 1991 and 2006, also the second data set was collected from ministry of education and human capital development on the teachers and students enrolment for 2013/2014 and 2016/2017 academic sessions. In, conclusion, it is clear and also visible that proposed estimator (PRATEst)
is highly rewarding than conventional ones
and therefore, the
proposed estimator is recommended for use in successive sampling scheme.
KEYWORDS: Successive sampling, Ratio Estimator, Auxiliary Variable, Census, Students Enrolment.
1. INTRODUCTION
Successive sampling is used extensively in applied sciences, sociology and economic researches. Many survey these days are repetitive in character. Government agencies like the National Bureau of Statistics and other research based institutes collect information regularly on the same population to estimate some population parameters for current occasion. When same population is sampled repeatedly, it is said that a first sample has been taken (on one occasion) from a population of N units and a second sample is to be taken (on another occasion) on the same population, there is thus an opportunity of making use of the information contained in the first sample. Therefore, problem is
how best to learn from past experience and use it for improving precision of future estimates. Estimates can be made not only for the existing time period (current estimates) but also of the change that has taken place since the previous occasion and of the average over a given period. One characteristics growth of theoretical statistics is the emergence of a large body of the theory which discusses how to make good estimate from data. In the development of theory specifically for sample surveys, little use has been made of this knowledge. There are two principal reasons. Firstly, a survey that contains a large number of items has a greater advantage in estimation procedure that requires little more than simple addition, whereas the superior methods of estimate is statistical theory, such as maximum likelihood, may necessitate a series of successive approximations before the estimate can be found, Secondly, there has been a difference in attitude in the two lines of research. Most of the estimation methods in theoretical statistics take for granted that we know the functional form of the frequency distribution followed by the data in the sample, and the method of estimation is carefully geared to this type of distribution.
2. REVIEW OF RELATED LITERATURE
that for one level of repeated sampling, only sample values that have been drawn from the population of current time can be added to the sample pattern. And for higher levels, both the earlier sample values and current values can be added. ([SS74]) also developed a repeated sampling method to obtain a minimum variance estimate of population values (mean and total) by suitably constructing a linear function of sample at different times.
([RG67]) while developing an improved estimator for simple random sampling on two successive occasion cases, advocated the admissibility of the customary estimators of the population total in sampling on two occasions and also proved that any linear function on the second occasion does not have greater expected function than the first occasion. So a necessary condition for the estimate on the second occasions to be more efficient than the customary estimators based on a completely unmatched sample of the same was developed (i.e. if the same sample is taken on the second occasion, the variance will be thus, for making current estimators (using the difference estimator), the best policy is to replace the sample partially and optimum matching fraction for various value of correlation coefficient when , the best percentage to match never exceed 50% and decrease steadily as correlation increases.
In the same view, ([ARA05]) worked on successive sampling using a product estimate but ([ARA05]) equally considered when auxiliary variables are negatively correlated and double sampling product estimate from the matched sample was presented. Expressions for optimum estimator and its variance also derived. While ([TS08]) looked into the efficient estimator in successive sampling using post stratification. Therefore, the product method of estimation is relevant to these case. If the relation between the auxiliary valuable x and the study variable y is negative, it has also been proved that the optimum estimator which combines a two sampling on successive occasion estimator for the matched part of the sample and a simple random mean for the unmatched part, has less variance than the usual estimator, provided (Artes, Rueda and Arcos, 1998) where is correlation coefficient, is coefficient of variation estimate x and is coefficient of variation of variable y.
Despite all the contributions from ([ARA98]), there are several types of procedures and conditions adopted for estimation of the population parameters, which are:
i. The same sample may be used on each occasion (panel sampling)
ii. A new sample may be taken on each occasion (repeated sampling)
iii. A part of the sample may by drawn afresh. ([Des72]) gave some conditions that should be followed, which are:
i. For estimating change from one occasion to the next, it may be best to retain the sample on each occasion.
ii. For estimating the mean on each occasion, it may be best to drawn a fresh sample on each occasion.
iii. If it is desired to estimate the mean on each occasion and also the change from one occasion to the next, it may be best to retain part of the sample and draw the remainder of the sample a fresh.
However, the use of ratio method of estimation in successive sampling was first suggested by ([Avd68]) and later ([SSS75]). ([Gup70]) suggested the use of product method and later it was embraced by ([ARA88]), ([AG01]). In is contributions, ([Oka92]) gave some estimators of the population ratio when sampling is done with partial replacement of units. In, this case, the estimate of the population total of the character on the recent occasion is first obtained by a suitable combination of two independent estimates of the population totals from the matched and unmatched sample. The estimate of the population total of is similarly obtained. These two estimates of the population totals of and are then used to derive the estimate of the population ratio.
The approach that was used for estimation of current population mean, further extended to develop general theory of estimation in repeated surveys for the current population variance. For the first time in successive sampling, ([SSS01]) considered the problem of estimating the population variance on current occasion. ([A+10]) proposed an estimator by using a linear combination of available sample variances for estimating the current population variance based on matched and unmatched portions of the samples at both occasions and most recently, ([S+11]) suggested a class of estimators for estimation of finite population variance on current occasion. [SSA13]) use unistage sampling over two occasion using SRSWOR and regression estimator was applied in obtaining current estimates with one auxiliary variable.
3. NATURE AND SCOPE OF THE DATA
4. METHODOLOGY
The subject of validity (agreement to acceptability) and reliability (dependable) are complex and controversial but of great importance in research methodology and any research depend strongly on the methods used at various stages of the design of the survey, collection of data, analysis and interpretation of the results.
This study focused on measure of precision, which is a function of the variance for the three estimators under the repetitive survey. It also, centered on checking precision on estimate and percentage gain in relative efficiency, over each occasion under study.
It also discussed the steps taken at the various stages of the study which includes:
Notation and meaning with derivation of methods under study.
4.1 Notations and Meaning
N - is the population size
n - is the sample size taken on the first occasion m - is the number of matched or retained units from the first occasion and used as part of second occasion
u - is the number of unmatched or a fresh unit on the second occasion from the remaining unit of the population
- is the correlation coefficient between the matched units of x and y
- is the proportion of matched or retained units - is the proportion of unmatched or new units
- is the pooled variance of and
- is the sample variance of units (x) on first occasion
- is the sample mean of unmatched units of x
from first occasion.
- is the sample mean of matched units of x from
first occasion.
- is the sample mean of unmatched units of y
from second occasion.
- is the sample mean of matched units of y from
second occasion.
is the sample mean of unmatched units of z from
first occasion.
- is the sample mean of matched units of z from
second occasion.
- is the sample mean of unmatched units of z
from second occasion.
- is the sample mean of matched units of z from
first occasion.
- is the population mean of x units. - is the population mean of y units. - is the population mean of z units.
- is the sample variance of units (y) on second occasion.
- is the sample variance of units (z) on first occasion or second occasion.
- is the estimate of change on the two occasions. ∑ - is the estimate of sum on the occasions.
- is the variances of estimate of change on the two occasions.
- is the variance of estimate of sum on the two occasions.
- is the relative gain in precision of changes over the two sampling schemes.
- is the relative gain in precision of sum over the two sampling schemes
- is the simple estimator of the means on first
occasion.
- is the simple estimator of the means on
second occasion.
- is the linear estimator of the means on first
occasion.
- is the linear estimator of the means on
second occasion.
- is the Proposed ratio estimator of the
means on first occasion.
- is the Proposed ratio estimator of the
means on second occasion.
R1 - is the population ratio of z to x. R2 - is the population ratio of z to y.
- is the estimator of change on Proposed
ratio estimation.
- is the estimate of the sum on Proposed
ratio estimation.
R( ) - is the relative gain in precision of
change on Proposed ratio estimation.
R( ) - is the relative gain in precision of
change on Proposed ratio estimation.
4.2 Derivation of Estimate, Variance and Relative Efficiency of the Sampling Scheme
This section discusses the derivation of the formula for estimate, variance and relative efficiency of the sampling scheme. Basically, we would be employing the method of ([Yat49]), ([Pat50]), ([Das82]), ([CT83]) and ([Oka85]) as template.
1. Simple Estimator (SEst)
a) The unbiased Simple Estimator of mean for first and second occasion respectively
i) (1)
ii) (2)
(3)
ii) Variance of Estimate of change
(4)
b) i) The Estimate of Sum
(5)
ii) Variance of the Sum
(6)
2) Linear Estimator (LEst)
a) The linear estimator for and can also be sought from the form.
i)
Where b and d are constant
(7)
ii)
Where a and c are constant
(8)
b) i) The estimate of change
2 1 + 2 1 (9)
ii) Variance of Estimate of change
(10) c) i) The estimate of Sum
2 + 1+ 1 + 2 (11)
ii) Variance of Sum
(12)
3) Proposed Ratio Estimator (PRATEst) 4.3 Assumptions of the Proposed Ratio
Estimator
1. The Proposed Ratio Estimator (PRATEst) is
derived from Linear Estimator (LEst)
2. The study variable (x, y) and auxiliary (z) are assumed to have the same variance on both occasions.
3. The Proportion of matched and the Proportion of unmatched is equal to 1, i.e.
4. The Correlation coefficient between x, y and z has value ranges from attain its minimum variance when under estimate of sum and attain its optimum variance when under estimate of change.
5. To obtain estimate of change and average, will take the difference and sum respectively between the previous and current estimate. 6. The precision of the estimation is determined by
evaluating the efficiency of the relative gain in information from the sample from 1st occasion to the 2nd occasion.
4.4 Properties of the Proposed Ratio Estimator
1. Bias
2. Mean square Error (MSE)
3. Minimum Mean Square Errors (MMSE) 4. Efficiency comparison
Consider a population containing of N unit. Let a character under study on first (second) occasion be denoted by x(y). It is assumed that the information on auxiliary variable z is available on the first as well as on the second occasion. We consider the population to be large enough and the sample size is constant on each occasion. Using sample random without replacement (SRSWOR), we select a sample of size n on the first occasion of these n units, a sub-sample of size is retained on the second occasion. This sub sample is supplemented by selecting of units afresh from the units that were not selected on the first occasion. Following ([Yat49]), ([Pet50]) and ([Sin05]) methods, we use
(15)
(16)
Where a, b, c and d are constants
To determine the value of constants a, b, c and d.
Find the variance of
and then take the derivatives with respect to constants a, b, c and d, therefore equate the resulting equations to zero to obtain a, b, c and d.
Hence,
a) The Proposed Ratio Estimator of the means are:
i)
ii)
Where
Also, where
Where
Where
b) Estimate of change:
i) The estimate required
Hence
2 2 1 1 + 2 2 + + 2 2 1 1 (17)
ii) Variance of Estimate of change
2 + 2 (18)
c) Estimate of Sum:
i) The estimate required
2 2 + 1 1 + 2 2 + + 1 1 +
2 2 (19)
ii) Variance of Estimate of Sum
2 2 (20)
4) Relative Gain in Precision
a) Relative gain in precision of change in Linear Estimator(LEst) over Simple Estimator(SEst)
Hence,
(21)
b) Relative gain in precision of sum in Linear Estimator(LEst) over Simple Estimator(SEst)
Hence,
(22)
c) Relative gain in precision of change in Proposed Ratio Estimator (PRATEst) over Simple
Estimator (SEst)
Hence,
(23)
d) Relative gain in precision of sum in Proposed Ratio Estimator (PRATEst) over Simple
Estimator (SEst)
Hence,
(24)
5. RESULT OF THE ANALYSIS
5.1 Empirical Study I
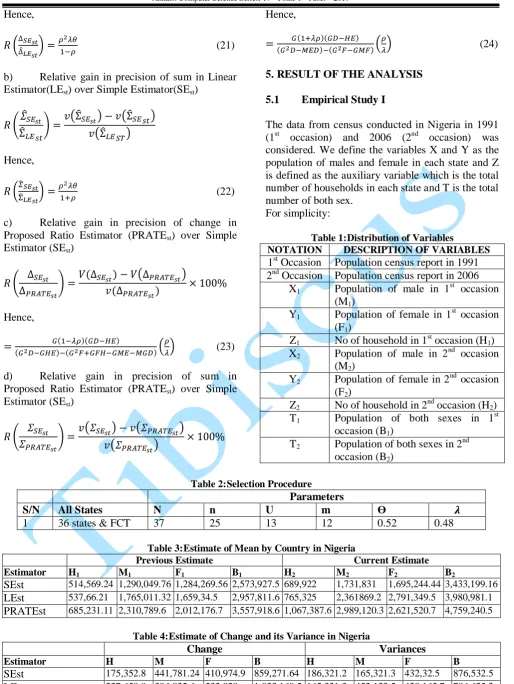
The data from census conducted in Nigeria in 1991 (1st occasion) and 2006 (2nd occasion) was considered. We define the variables X and Y as the population of males and female in each state and Z is defined as the auxiliary variable which is the total number of households in each state and T is the total number of both sex.
For simplicity:
Table 1: Distribution of Variables
NOTATION DESCRIPTION OF VARIABLES 1st Occasion Population census report in 1991 2nd Occasion Population census report in 2006
X1 Population of male in 1 st
occasion (M1)
Y1 Population of female in 1 st
occasion (F1)
Z1 No of household in 1 st
occasion (H1)
X2 Population of male in 2 nd
occasion (M2)
Y2 Population of female in 2nd occasion
(F2)
Z2 No of household in 2 nd
occasion (H2)
T1 Population of both sexes in 1 st
occasion (B1)
T2 Population of both sexes in 2 nd
occasion (B2)
Table 2: Selection Procedure Parameters
S/N All States N n U m Ө
1 36 states & FCT 37 25 13 12 0.52 0.48
Table 3: Estimate of Mean by Country in Nigeria
Previous Estimate Current Estimate Estimator H1 M1 F1 B1 H2 M2 F2 B2
SEst 514,569.24 1,290,049.76 1,284,269.56 2,573,927.5 689,922 1,731,831 1,695,244.44 3,433,199.16 LEst 537,66.21 1,765,011.32 1,659,34.5 2,957,811.6 765,325 2,361869.2 2,791,349.5 3,980,981.1 PRATEst 685,231.11 2,310,789.6 2,012,176.7 3,557,918.6 1,067,387.6 2,989,120.3 2,621,520.7 4,759,240.5
Table 4: Estimate of Change and its Variance in Nigeria
Change Variances
Estimator H M F B H M F B
Table 5: Estimate of Sum and its Variance in Nigeria
Sum Variances
Estimator H M F B H M F B SEst 1,204,491.24 3,021,880.76 2,979,514 6,007,126.7 382,625.6 941,652.6 894,644 1,753,069
LEst 1,302,991.2 4,126,880.5 3,640,671 6,938,792.7 330,648.8 924,267.8 851,323.4 1,584,415.6
PRATEst 1,752,618.7 5,299,918.9 5,001,297 8,317,159.2 191,642.8 621,423.4 600,469.5 1,221,645.9
Table 6: Relative Gain in Precision (%)
Change Sum
S/N COUNTRY ESTIMATOR H M F B H M F B
1. Nigeria LEst 12.7 9.5 2.9 11.4 15.7 1.9 5.1 10.6
PRATEst 95.5 49.5 44.0 44.80 99.7 51.5 49.0 43.5
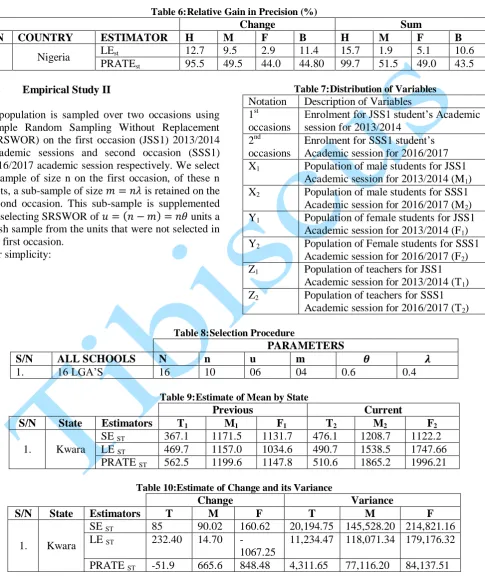
5.2 Empirical Study II
A population is sampled over two occasions using Simple Random Sampling Without Replacement (SRSWOR) on the first occasion (JSS1) 2013/2014 Academic sessions and second occasion (SSS1) 2016/2017 academic session respectively. We select a sample of size n on the first occasion, of these n units, a sub-sample of size is retained on the second occasion. This sub-sample is supplemented by selecting SRSWOR of units a fresh sample from the units that were not selected in the first occasion.
For simplicity:
Table 7: Distribution of Variables Notation Description of Variables 1st
occasions
Enrolment for JSS1 student’s Academic session for 2013/2014
2nd occasions
Enrolment for SSS1 student’s Academic session for 2016/2017 X1 Population of male students for JSS1
Academic session for 2013/2014 (M1)
X2 Population of male students for SSS1
Academic session for 2016/2017 (M2)
Y1 Population of female students for JSS1
Academic session for 2013/2014 (F1)
Y2 Population of Female students for SSS1
Academic session for 2016/2017 (F2)
Z1 Population of teachers for JSS1
Academic session for 2013/2014 (T1)
Z2 Population of teachers for SSS1
Academic session for 2016/2017 (T2)
Table 8: Selection Procedure
PARAMETERS S/N ALL SCHOOLS N n u m
1. 16 LGA’S 16 10 06 04 0.6 0.4
Table 9: Estimate of Mean by State
Previous Current S/N State Estimators T1 M1 F1 T2 M2 F2
1. Kwara
SE ST 367.1 1171.5 1131.7 476.1 1208.7 1122.2
LE ST 469.7 1157.0 1034.6 490.7 1538.5 1747.66
PRATE ST 562.5 1199.6 1147.8 510.6 1865.2 1996.21
Table 10:Estimate of Change and its Variance
Change Variance
S/N State Estimators T M F T M F
1. Kwara
SE ST 85 90.02 160.62 20,194.75 145,528.20 214,821.16
LE ST 232.40 14.70
-1067.25
Table 11:Estimate of Sum and its Variance
Sum Variance
S/N State Estimators T M F T M F
-1. Kwara
SE ST 616.44 1182.11 1128.51 39,276.79 338,597.56 501,249.37
LE ST 1642.95 2143.7 1920.0 31,625.31 302,465.01 447,544.08
PRATE ST 1073.1 3064.8 3144.01 18,621.61 151,135.12 211,311.17
Table 12:Relative Gain in Precision (%)
Change Sum
S/N State Estimators H M F H M F
1. Kwara LE ST 44.4 18.9 16.5 24.2 11.9 12.0
PRATE ST 160.5 88.7 155.3 110.9 124.0 137.2
6. DISCUSSION OF RESULTS
The result of analysis presented in Table 1 – 12 can be summarized as follow:
i. Generally we have undertaken an investigation covering a ratio estimator techniques in the context of devising efficient sampling strategies for successive sampling schemes with a view to derive the unbiased estimator of mean on two occasion (previous and current) using Simple Estimator (SEst), Linear
Estimator (LEst) and Propose Ratio Estimator
(PRATEst) and also to examine the Estimates of change and Sum respectively and establish minimum variance of the three estimators and to achieve the relative gain in precision of the estimators.
ii. This study considered the census figure of the 36 states and FCT of Nigeria in 1996 and 2006 as population as well as Teacher-student Enrolment in kwara state in the year 2013/2014 and 2016/2017 details of populations and variables description is given in Table 1 and 7 respectively. The necessary parameters of populations for computing the estimators are given in Table 2 and 8. (using Random Number table as a selection procedure).
iii. From Table 3 and 9, it was observed that both previous and current Estimate sustained the expected population mean under the variables of interest and auxiliary variables using Simple Estimator (SEst), Linear Estimator
(LEst) and Proposed Ratio Estimator
(PRATEst) compare to actual population mean iv. From Table 4 and 10, it was shown that
Estimate of change in variables of interest (M, F, and B) and auxiliary variables (H and T) over the time interval of the census and school enrolment are unique and consistent considered the actual population value and expected population value. In the same vain it was observed that Proposed Ratio Estimator
(PRATEst) has least variance than other two estimators.
v. From Table 5 and 11, it was observed that Estimate of sum in both variables of interest (M, F and B) and auxiliary variables (H and T) over a given time interval 1999 – 2006 and 2013/2014 – 2016/2017 respectively, were also unique and justifiable considering the actual value and expected value among the three Estimators.
vi. From Table 6 and 12, it was revealed that gain in efficiency exist by using Proposed Ratio Estimator (PRATEst) than usual Linear Estimator (LEst) both at Estimate of change
and sum most especially for auxiliary variable (H and T) with high reasonable gain in precision.
CONCLUSION
In view of the above result, based on the available information, we concluded as follows.
1) For current estimates replacement of part of the sample on the current occasion will go a long way in improving the efficiency of the estimates required.
2) Attempt should be made to retain a greater portion of the samples on the current occasion to enhance the estimate of change.
3) Fresh sample should be taken on each occasion to facilities efficiency when estimating average over time.
4) Percentage gain in precision does not depend on sample size n (i.e. independent of sample size n).
should be viewed by all stakeholders in light of these historical facts with a view to strengthen the process of conducting census regularly and at definite intervals.
6) Kwara state Government should encourage teachers in rural area and monitor student’s enrolment rate at least two intervals in every 3 years as to make case for adequate infrastructure for UBE and SUBEB implementation in public schools.
7) All stakeholders in the education sector should give priority to public schools in order to avoid its total collapse most especially in the rural area of the state.
8) Both theoretical and empirical results of the study are sound, encouraging and of considerable practical importance.
REFERENCES
[Avd68] Avdhani M. S. - Contribution to the theory of sampling from finite population and its application. Ph. D. thesis, Delhi University, 1968.
[ARA05] Artes E., Rueda M., Arcos A. - Successive Sampling using Product Estimate When the auxiliary variables are negatively correlated; Applied Science and Environment vol. 54(3), 342 – 354. 2005.
[ARA98] Arte’s E., Ruad M., Arcos A. - Successive sampling using a product estimate, Applied science and the environment computation mechanics publication in Rome vol. 85 – 90, 1998. [A+10] Azam M., Zaman Q., Salahuddin,
Shabbir J. - Estimation of Current Population Variance in Two Successive Occasions. J. Statist. 17:54-65, 2010. [CT83] Chaturvedi D. K., Tripathi T. P. -
Estimation of population ratio on two occasions using multivariate auxiliary information. Journal of the India statistical Association 21, 113-120, 1983. [Das82] Das A. K. - Estimation of population
ratio on two occasions. Journal of the Indian society of Agricultural statistics, 34(2), 1-9, 1982.
[Des72] Des R. - The design of sample survey (section 6,2) McGraw-Hill Book Company, New York, 1972.
[Gup79] Gupta P. C. - Sampling on two successive occasion, Journal of Statistical Research, 13(13), 7-16, 1979. [Jes42] Jessen R. J. - Statistical investigation
of sample survey for obtaining farm facts, IOWA agricultural experiment statistical research bulleting 304, 1942. [Oka02] Okafor C. F. - Sample survey theory
with application. Afro-orbis publication Ltd UNN (Nsukka), 2002.
[Oka92] Okafor F. C. - The theory and application of sampling over two occasions for the estimation of current population ratio. Statistical. 1,137-147, 1992.
[Pat50] Patterson H. D. - Sampling on successive occasions with partial replacement of units. Journal of the Royal Statistical Society. 12(B): 241−255, 1950.
[RG67] Rao J. N. K., Graham J. E. - Rotation design for sampling on repeated occasions, Journal of American Statistical Association 60, 492-50, 1967.
[Sen61] Sen A.R. - Successive Sampling with two auxiliary variables. Sonkhya: The Indian journal of statistics B vol. 371- 378, 1961.
[Sin05] Singh G. N. - On the use of chain-type ratio estimator in successive sampling. Statistics in Transition. 7(1): 21−26. Statistics In Transition new series, Summer 2015 195 2005.
[SP08] Singh G. N., Priyanka K. - On the use of several auxiliary variates to improve the precision of estimates at current occasion. Journal of the Indian Society of Agricultural Statistics. 62(3): 253−265, 2008.
[SSA13] Sodipo E. O., Solipo A. A., Akanbi O. B. - Estimation of Students population in public secondary schools. America Journal for Social issue humanities vol.3 285-302, 2013.
[SSS01] Sud U. C., Srivastava A. K., Sharma D. P. - On the Estimation of Population Variance in Repetitive Surveys. J. Ind. Soc. Agri. Statist. 54(2): 355-369, 2001.
[SSS75] Sen A.R, Sellers S., Smith G. E. J. - The use of a ratio estimate in successive sampling, Biometrics 31. 673-683, 1975.
[S+11] Singh H. P., Tailor R., Singh S., Kim J. - Estimation of population variance in successive sampling. Qual Quant 45: 477-494, 2011.
[Yat49] Yates F. - Sampling methods for censuses and surveys, 3rd edition Charles Griffin and company Ltd; London. 1949.
[***06] *** - Report on Census Final Result, National Population Commission, Abuja, Nigeria, 2006.