Issues
ISSN: 2146-4138
available at http: www.econjournals.com
International Journal of Economics and Financial Issues, 2015, 5(3), 772-779.
The Relationship between Banking Competition and Stability in
Developing Countries: The Case of Libya
Haytem Ahmed Troug
1, Rashid Sbia
2*
1Department of Economics, University of Exeter, Exeter, England, UK, 2DULBEA, Solvay Business and Economics School, Ministry of Finance, UAE. *Email: [email protected]
ABSTRACT
In our paper, we examined the relationship between non-performing loans, as a measure of stability, and concentration, as a measure of competition, in
the Libyan banking sector. We used aggregate quarterly data for the 15 commercial banks in the country during the period 2002-2013. A broad set of tests were conducted to measure the relationship between the two variables, and alternative robustness tests were conducted to verify our core finding
that less competition in the banking sector leads to a more resilient banking sector. Thus, our results offer empirical support against the “competition-stability” theory and conform the “competition-fragility” literature. We conclude by recommending the need to inspect in more detail (on a bank by bank level) the relationship between competition and fragility in developing countries in general and in Libya in particular.
Keywords: Banking Competition, Financial Stability, Oil Exporting Countries, Middle East and North Africa, Libya
JEL Classifications: C50, C58, G21, G28
1. INTRODUCTION
Finance institutions represent the grease that keeps every economy up and running, and this is why banks’ behaviour and healthy functioning is of interest to both scholars and professionals. There has been enormous amount publications on the effect of
competition in the financial sector on its stability. Unlike any
other industry, a high level of competition is considered to be dangerous as it jeopardizes the stability of the sector by promoting
risky behaviour. Consequently, there is almost a unified voice to the issue of finding the balanced formula between competition and stability. In this regard, regulators always find themselves facing the dilemma of promoting financial stability by restricting
competition in the sector by different means.
Thus, there is a widespread view that permitting institutions to freely compete might endanger the sector’s stability by leading to widespread panics and uncontrollable bank runs that can easily
spread to the economy as a whole. Various financial turmoil’s
turned out to be more devastating than any other crisis in other sectors. As result, we observe various national and international
laws and regulations that aim to the limitation of the financial
sector in general, and the banking sector in specific. The aim of
these regulations is mainly to ensure the stability of the banking sector, and some argue that the most important job of regulators
is to ensure the stability of the sector (Canoy et al., 2001).
Nevertheless, the debate in this matter is still far from conclusive;
some argue that, due to the small margin of profits in competitive
environments, banks tend to take on risky investments and endanger the safety of the sector as a whole (Smith, 1984). This study supports the view that a competitive banking sector tends to be more vulnerable than an uncompetitive one. Other papers,
(Caminal and Matutes, 2002), claim that banks with monopolistic
powers are more prone to take on risky projects. They argue that these banks enjoy excess liquidity that might mislead them of
their financial position and the danger of the projects that they normally aim to finance.
Measuring competition has taking various form, as we will see later on. The oldest measurement of competition is the level of
concentration reflected in the Herfindahl–Hirschman index. This
procedure has been heavily criticized by the later literature like
be a misleading indicator for competition in small economies where the number of banks is relatively small. Most of the recent
literature (Berger et al., 2004) is now differentiating between the
two terms, but none of those paper conducted analysis to measure the effect of competitive behaviour in the banking sector on its stability. Nevertheless, we notice that these papers are including proxies for the regulatory environment that banks operate in.
This paper should be the first one to shed light on this relationship
in Libya, and possibly provoke the conduct of further studies on this issue. The remainder of the paper is organized as follows. We review the relevant literature on the links between competition and concentration in part (2). A summary on the banking sector in Libya and its development during the period of study is presented in part (3). A detailed explanation of the methodology that we’re
going to employ, including the Herfindahl index, is presented
in part (4). In part (5) we present a summary of the data and it’s descriptive statistics. Regression results and extra robustness tests are presented in section (6). Section (7) offers concluding remarks.
2. LITERATURE REVIEW
As we briefly touched on above, the literature on the effect of
competition in the banking sector on its stability is divided into two main streams. The old traditional view considers a competitive banking sector to be more prone to a crisis than a less competitive
one. In a more recent paper, Beck et al., (2010) support this claim by using the profit variable as a mean of comparison. They claim that in a highly competitive sector the profit margin will be very
small for banks, and this will encourage them to take on more risky investments and, thus, endanger the stability of the sector.
Beck et al., (2010) also highlight that a sector with fewer and larger
bank is easier to monitor than a highly competitive sector with a larger amount of bank. This ability to monitor and audit this small number of banks will ensure that the sector stays safe and more stable. In their claim, Beck et al., (2010) state that small competitive banks are always at risk of small margin profits, and their franchise
values are affected by those small margins. That will always
incentives them to take on riskier projects to increase their profit margin and, thus, gain some market power. (Vives (2001) adds to
that by noting that high competition in the banking sector increases the possibility of banks failures that most likely will spread to the
real sector and cause a significant social cost. This, in return, will have a negative effect on the confidence of the customers in the banking sector. Canoy et al. (2001) supports the above by claiming
that in a less competitive market big banks have a legacy and a
reputation to keep. He adds that the only way for these big banks
to keep their legacy is to keep on operating and avoiding any risky projects that might endanger the existence of their institutions. These banks comply to the "too big to fail" principle.
In support to the above, Hellman et al. (2000) show that a high level of competition incentivises financial institutions to take
on riskier investment, but that an adequate capital requirement level and deposit rate ceilings can help restore cautious banking
behaviour. Perotti and Suarez (2002) give more evidence to the competition-fragility literature. After they find that competition
causes a less stable banking sector, they argue that once banks
start to go bankrupt, the authorities could encourage the existing banks to take over those banks and possibly gain more market power. This approach is called the “last bank standing” approach.
Perotti and Suarez (2002) conclude by their claim that a possible
solution if a sector was competitive, and it faced bank failures and instability, would be for the regulators to promote takeovers of bankrupt institutions by existing banks, and that thus supports all of the above literature.
On an opposing stand, Boyd and De Nicolo (2003) argue against
the above claims. As they state that a less competitive banking sector, where banks each control a large size of the market share, is less stable than a more competitive one. They reason that big banks in this market can charge customers higher interest rates. Those higher interest rates are more harder to pay, and they also only attract entrepreneurs with riskier projects an increase in the adverse selection problem, which will endanger the sector as a whole. They also add that the solution to the claims against the competitive banking sectors, where the use of the bank’s own
money in financing should help the stability of the sector. Boyd and De Nicolo (2003) argue that less competitive banking sectors are
more prone to instability than more competitive banking sectors, and they advocate against the concentration-stability theorem.
Also, Fischer and Chenard (1997) investigate the relationship
between stability, regulation, and liberalization. They find in their
study that deregulating the banking sector increases systemic
risk, and they relate that to intensified competition in the period
following the deregulation and an increase in competition in the banking system under examination. Thus, they conclude that a banking sector with higher entry barriers and less competition, and with more active restrictions is less fragile and more stable.
Allen and Gale (2004), however, discuss that the effect of the degree of competition on the financial stability is many-sided
and that a simple evaluation of the negative relationship between competition and stability is misleading. They review several
articles related to the topic, and define the optimal level of
competition resulting from each model. They conclude that all the
models come with different results. They also find that, whenever
deposit insurance is present or when banks start competing for deposits in the presence of increasing returns, competition between banks tends to weaken the health of the banking sector. Lastly,
Allen and Gale (2004) also draw attention to the fact that fragility
also depends on the structure of the interbank market. In this case, a small liquidity shock would spread faster and cause more damage in a competitive market where all banks are price takers. Similar
to that paper, Boyd et al. (2004) also argue that the banking crises
depend on many other factors other than the level of competition in the banking sector of a certain country.
On a related matter, if we take the design of deposit insurance
schemes into consideration, Cordella and Yeyati (2002) show
that risk-based deposit insurance restrains risk-taking behaviour of financial institutions even in the presence of increased competition. Rather, monetary policy is a major determinant as well. Monopolistic banking systems are found to be more fragile
competitive banking markets are more vulnerable if inflation is
above this threshold.
Schaeck et al. (2006), ran a cross-country regression to evaluate
how the competition affects the stability of the banking sector across
38 countries. Here we note that in further stages of the analysis,
developing countries were excluded from the robustness tests for
consistency reasons. He claimed that including those countries would
distort the estimation due to the heterogeneity between the banking sectors in developing countries and the ones in developed countries.
Large degrees of government ownership, on the other hand, is accounted for in the literature and considered to hamper competitive when their share in those institutions is big. But some literature suggest a positive relationship between government ownership
and time to crisis. However, empirical work by Barth Caprio, and Levine (2004) suggests that the relationship between government
ownership and bank fragility is not that straight forward.
In summary, we find that the literature on the relationship between competition and stability is far from conclusive. We find that the
old dogma of a trade-off between competition and stability is challenged lately by various authors that we mentioned above. Nevertheless, empirical results are still wandering between those two views, and some of them even suggest that the relationship doesn’t exist. Likewise, empirical research to date is largely dominated by studies on individual countries and mostly gives
country-specific conclusions, which renders the literature and the findings drawn to date far from conclusive.
3. LIBYA’S BANKING SECTOR
In the last decade, we notice an increase of interest in the banking sectors of developing countries (Demirgüç et al., (1998), and
Ömer et al., (2013)). Nevertheless, a large part of the studies
in the literature are studies concerned with developed markets. There is still, nevertheless, a few empirical studies on emerging markets. The level and determinants of competitiveness of the banking system in developed economies is different from those
in emerging economies as noted by (Fungáčová et al., 2010).
Therefore, the competition policies and rules used for developed countries cannot be taken from the shelves and presented as a model for emerging markets.
Similar to other countries in the region, the banking sector in
Libya is the main provider of financial services to the economy.
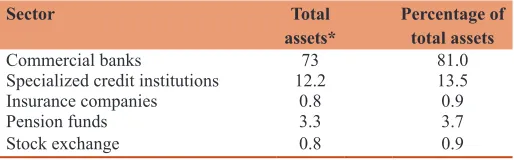
With 15 commercial banks totaling LYD 73.2 billion of assets (in
the end of 2013), the banking sector represents 81% of the total assets in the financial sector, as depicted in Table 1. These banks can be subcategorized into three groups: 5 large state-owned
banks (including 2 banks with a 19% stake owned by foreign
strategic partners), 8 private owned banks (including 3 with
foreign participation of 49%), and 2 joint banks held by the Libyan Government (51%) and foreign states (UAE and Qatar). The first group collects 90% of the deposit base in Libya.
Since commercial banks are the main institutions collecting Libyans’ savings, their deposit base has considerably expanded
during the last 10 years. However, this expansion owns more
to the growing pace of government budget expenses, which is
reflected more by the high oil prices during that period, than to
an active deposits conquest policy. It is worth noting that despite
the licensing of new banks (from 9 to 15 between 2003 and 13), the number of branches per 100,000 adults has not significantly increased (from 11 to 13). With a credit to GDP ratio of 12.4%,
the intermediation of the Libyan banking sector is far below the regional, which adversely affects competitiveness.
3.1. Financial Sector Liberalization
The last 10 years have witnessed a number of measures to liberalize the financial sector and reshape the banking system and to increase
its contribution to economic growth. We will mention some of the
key measures that might had influence the structure of the banking
sector in Libya, and they are:
• 2005: Liberalization of commercial banks’ fees for services
provided to customers, requirement made for commercial banks to establish written credit policy, strengthening of CBL supervision of commercial banks, especially after the
issuance of the Law no. 1 of 2005 on banks. The end goal was to ensure the stability of economic activity, the financial safety
of the banking system, as well as guaranteeing the rights of depositors. To achieve these goals, the Central Bank carries out inspections as well as off-site and on-site control of the operating commercial banks and their branches to ensure they comply with the provisions of the banking law and the decrees organizing banking activity. As part of Law no. 1 of
2005, two external auditors should review and audit banks’ accounts as well as their financial statements.
• 2006: 15% of the Central Bank’s shares in two of the
largest three banks in the country were offered to public subscription and the banks were listed on the Libyan stock
market in the following year. 40 regional banks were merged
into the National Banking Corporation which became itself a commercial bank. The CBL authorized the boards of directors of commercial banks to close bank branches or merge them with other branches. To allow banks to employ highly competent staff, banks were given the freedom to set the remunerations of their employees. Issuance of a regulation on large exposures (total credits and facilities
granted to one single borrower shall not exceed 20% of
regulatory capital). Issuance of a circular allowing banks to grant credits and facilities to foreign companies that are
implementing projects in Libya up to 50% of the cost of the project to be financed.
• 2007: Inception of the Libyan stock market.
• 2008: Issuance of a circular setting further limits on
Table 1: Overview of financial sector components
Sector Total
assets* Percentage of total assets
Commercial banks 73 81.0
Specialized credit institutions 12.2 13.5 Insurance companies 0.8 0.9
credit concentration and establishing standards for credit risk management. Issuance of a circular delineating the duties of the board of directors and those of the executive management.
We will use these dates to test for structural break in our models. Dummy variables can also contribute in evaluating the effect of government intervention.
4. METHODOLOGY
The non-performing loans (NPLs) is the ratio of NPLs to total loans. Where a higher ratio means that there’s riskier loan portfolio in the bank level. This index will be our anchor for stability in the banking sector in Libya.
We will employ the Herfindahl index to measure the degree of
concentration in the Libyan banking sector. This index has been widely calculated in many industries to calculate the level of concentration in those particular industries. Where the calculation takes the following form:
H Si
i N
= 2
1
=
∑
Where, Si is the market share of firm i in the market, and N is the
number of firms. The Herfindahl index (H) ranges from 1/N to one, where N is the number of firms in the market. The interpretation
of the index should be as follows:
• An H below 0.01 (or 100) indicates a highly competitive index. • An H below 0.15 (or 1500) indicates an unconcentrated index. • An H between 0.15-0.25 (or 1500 to 2500) indicates moderate
concentration.
• An H above 0.25 (above 2500) indicates high concentration. Here, we note that there is a variety of other indices that are widely
used to assess both the competition and stability of the banking sector. To name a few of these possible indices, and the reason why they were irrelevant to our analysis:
The Lerner index, which describes a firm market power. It is defined by:
L P MC P
= −
Where, P is the market price set by the firm, in our case it would be
the interest rate opposed by commercial banks on their customers,
and marginal cost (MC) is the firm MC. The index ranges from a high of 1 to a low of 0, with higher numbers implying greater market power. For a perfectly competitive firm (where P = MC),
L = 0; such a firm has no market power.
Despite the superiority of the index, it was excluded from our analysis for various reasons: (i) The inconsistency of income statements reported by commercial banks to the Central Bank of Libya; (ii) the entry of almost 7 new banks to the sector, and the
ongoing mergence of banks might give misleading indicators, as
noted by some officials at the Central Bank of Libya.
4.1. H-statistic
The H-Statistic was created to diagnose which level of competition the market was in. recent papers (Bikker and Groeneveld (2000), Bikker and Haaf (2002), and Bikker (2004)) have emphasized on
the superiority of this index in measuring the level of competition than other previously used indices. These studies argue that the
analytical superiority of the H-Statistic over previously used
measures of competition is due to its formal derivation from
profit-maximizing equilibrium conditions. Moreover, the statistic
is robust with respect to the market since it only draws upon
characteristics of reduced-form revenue equations at the firm
level. Nevertheless, its limitation lies in the fact that the inferences based on the statistic are only valid if the market is in (or close to) equilibrium.
In the analysis, we will test for the stationary of the data to
determine which model fits the data best, and will follow by
cointegration tests to measure if the relationship between the variables is only temporary or permanent. Afterwards, we will test
for structural breaks in the model using the Quandt and Andrews
estimator to detect these breaks without knowing or assuming their period. Implementing shocks will also be useful for our analysis to measure the persistence of the effect of a shock in the covariate on the variable of interest.
5. DATA AND SUMMARY STATISTICS
We focus in the empirical analysis on a set of 15 banks during the
period 2002-2013 using quarterly data. We include in our analysis
a set of macroeconomic variables that are expected to have effect
on the NPL index. In this case, we will be able refine the model
and pursue to measure the relationship of interest while controlling for other variable. In what follows, is the list of the added variables and their expected signs in the model.
5.1. The Coverage of Foreign Assets to Money Supply FA/MS
This variable is a large indicator of how much the monetary
authority can protect the financial sector in general and the banking
sector and the exchange rate in particular especially in developing
countries. We’re expecting a negative coefficient for this variable, but, nevertheless, it could also produce a negative coefficient
depending on the characteristics of each banking sector.
5.2. Credit to the Economy
We are including this variable as the aggregate credit granted by the banking sector in Libya to different agents in the economy. The
sign of the coefficient should be negative for this variable, where granting more credit will inflate the denominator in the NPL ratio
and will decrease the ratio as a whole.
5.3. Inflation Rate
The sign of the inflation rate should be positive. As an increase in the inflation rate will encourage banks to raise interest rates, and
Descriptive statistics for the entire set of variables are presented in Table 2 and Figure 1.
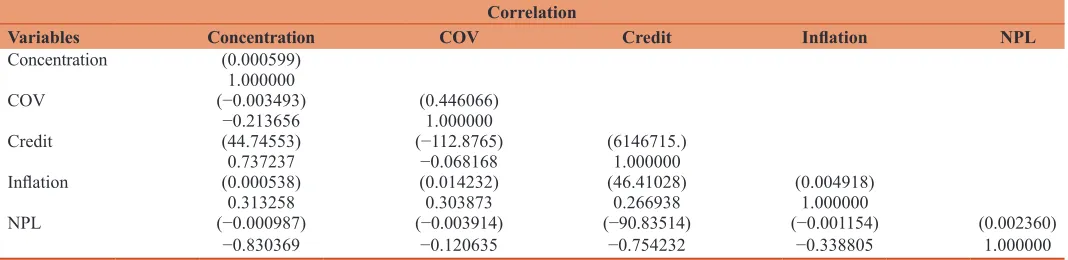
5.4. Correlation Matrix
The correlation matrix will enable us to assess the correlation between the covariates and the variable of interest (NPL). The direction of the relationships should be indicated as well in the Table 3.
Table 3 gives us the first indication of the correlation between all the variables in the model. We first highlight the analysis on coefficients related to the NPL variable; the coefficients of credit
and the ratio of foreign reserves to money supply turned up with signs that were anticipated in the analysis above, on one hand.
On the other hand, the sign of the inflation variable turned out with a conflicting sign than the one we anticipated. This might
be attributed to the stability of the nominal interest rates charged by the commercial banks in Libya during the period of study.
Nevertheless, further analysis will be conducted below to verify
the significance of that result in the model. Also, we notice that
the correlation sign of the relationship between the concentration variable and the NPL variable is negative, indicating that the decline in competition helped in assuring the stability of the banking sector. This might be a strong argument for the mergers of small banks that was promoted by the Central Bank of Libya in order to enhance the quality of human capital in the sector. But, as noted above, further testing will be implemented to verify these preliminary results.
We also notice a positive relationship between the concentration rate and the amount of credit granted to the domestic economy. This might be attributed to various reasons, including the
expansionary fiscal policy that took place in this period, which
in return provided the banking sector with large amounts of
excess reserves. Also, inflation had a positive correlation with
all the other variables that are in the model. Since the direction of the relationship is not clear at the moment, these signs have solid interpretation behind them given the high oil prices and the expansionary policies conducted in that period.
5.5. Normality
The next thing we are going to check for is the normality of the distribution of the NPL. It is likely to be normal. The histogram of the series is going to be plotted in order to see the distribution of the data. We employ the Jarque Bare test which is computed as: Table 2: Descriptive statistics
Variable Mean SD Maximum Minimum
NPL 25.2 4.91 35.5 17 Concentration 0.21 0.025 0.26 0.17
FA/MS 2.8 0.67 4.3 1.7 Credit* 6707.6 2505.5 13,163.2 4298.0
Inflation rate 3.5 7.1 26.9 −9.1
Source: Author’s calculation based on data from the CBL. *In Millions of Libyan Dinars, SD: Standard deviation
Table 3: Correlation and covariance between variables*
Correlation
Variables Concentration COV Credit Inflation NPL
Concentration (0.000599) 1.000000
COV (−0.003493) (0.446066)
−0.213656 1.000000
Credit (44.74553) (−112.8765) (6146715.)
0.737237 −0.068168 1.000000
Inflation (0.000538) (0.014232) (46.41028) (0.004918)
0.313258 0.303873 0.266938 1.000000
NPL (−0.000987) (−0.003914) (−90.83514) (−0.001154) (0.002360)
−0.830369 −0.120635 −0.754232 −0.338805 1.000000
Source: Author’s calculation, *Numbers in the brackets represent covariance between the variables
Figure 1: Descriptive statistics of nonperforming loans
JB n S= K
6 +
1 4( 3)
2 − 2
Where, S is the skewness and K the kurtosis.
As the P value associated with the test 0.311185 is smaller than the significance level, we don’t have statistically significant evidence
to reject the null of normality. The Jarque Bera test follows asymptotically a Chi-squared distribution.
5.6. Graphical Analysis
Figure 2 plots the evolution of the NPL variable and the concentration variable. It’s shown that the two series move in opposite directions, as indicated above in the correlation matrix table. We also note that
the relationship changed during the period of reform (Q 02 2004-Q 02 2006). This may lead us to think that there was a possibility of a
structural change occurring during that period. Just by observation, we cannot judge if these two time series are stationary or not. Running the test for unit roots will enable us to determine whether these two series are stationary or not. This procedure will also be implemented on the other variables of the model.
5.7. Testing for Stationarity in the Series
In this test we employ the Dickey-Fuller statistic (Davidson 2000).
The regression model for the test can be written as follows::
∇yt=(ρ−1)yt 1−+ =ut δyt 1−+ut
The null and the alternative to this test are stated as:
H0: δ = 0 There is unit root H: δ < 0 No unit root
The test statistic is: t = (γ/se[γ])
After adding a drift to our analysis, we found strong evidence to reject the null hypothesis of the series suffering from a unit root
regarding four variables (NPL, COV, inflation, concentration) at the I(0) level. While we found that the credit variable wasn’t
stationary at that level. The credit variable was stationary at the
first difference level I(1)1. 5.8. Cointegration Results
We run a cointegration test on the two variables of interest (NPL, concentration) to test if there exist a long-term relationship between the two. Using the cointegration assumption of a deterministic trend, the resulting trace statistic and the max-Eigen statistic strongly rejected the null hypothesis of no cointegration between the two variables. Both statistics indicate that there is at least one cointegration equilibrium between the two variables1.
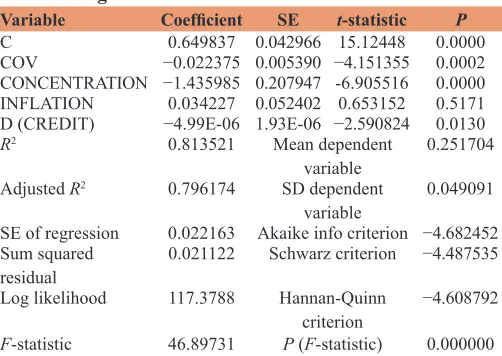
6. REGRESSION RESULTS
The main results of our regression model are presented in Table 4. The coefficients obtained from the model are reported in specification along with their t-statistics and their significance level
as well. Some complementary data is also shown in the Table 4. The regression results show with signs that are consistent with the previous analysis that was conducted above.
We find that the concentration level (lack of competition) has a positive effect on the stability of the banking sector. The coefficient of the concentration variable is significant at the 1% level, and shows that whenever concentration increases by 1% this will lead to a reduction of NPL by 1.4%.
Also, the foreign assets to money supply ratio (COV) variable has a negative sign as well. This leads us to presume that the healthier the sector is the more the borrowers and lenders are willing to renegotiate and restructure the debt term. Nevertheless, this might
just be a country-specific phenomenon, and we cannot affirm this
analysis without additional testing.
Credit granted to the economy shows with the expected sign
and is also significant. However, as noted above this result is
1 The results are available upon request.
Figure 2: Evolution of nonperforming loans and concentration
Source: Author’s calculation
Table 4: Regression results
Variable Coefficient SE t-statistic P
C 0.649837 0.042966 15.12448 0.0000
COV −0.022375 0.005390 −4.151355 0.0002
CONCENTRATION −1.435985 0.207947 -6.905516 0.0000
INFLATION 0.034227 0.052402 0.653152 0.5171
D (CREDIT) −4.99E-06 1.93E-06 −2.590824 0.0130
R2 0.813521 Mean dependent
variable 0.251704 Adjusted R2 0.796174 SD dependent
variable 0.049091 SE of regression 0.022163 Akaike info criterion −4.682452
Sum squared
residual 0.021122 Schwarz criterion −4.487535 Log likelihood 117.3788 Hannan-Quinn
criterion −4.608792
quite symmetric were credit constitutes the denominator of the NPL index and an increase in the denominator will directly lead to a decline in the ratio. We also note that the small size of the
coefficient is attributed to the fact that we are regressing a ratio
on an absolute variable.
The inflation rate coefficient turned out to be consistent with
our previous results, having a negative sign. Nevertheless, it is insignificant. The lack of significance of some of the
macroeconomic control variables (inflation) might be attributable to multicollinearity. Similar results were found in the study by
Detragiache and Spilimbergo (2001). We choose to keep them
in the equation to test our hypothesis regarding the relationship between competition and stability in the banking sector while the macroeconomic setting is controlled for and to capture the behaviour of the macroeconomic environment more dynamically.
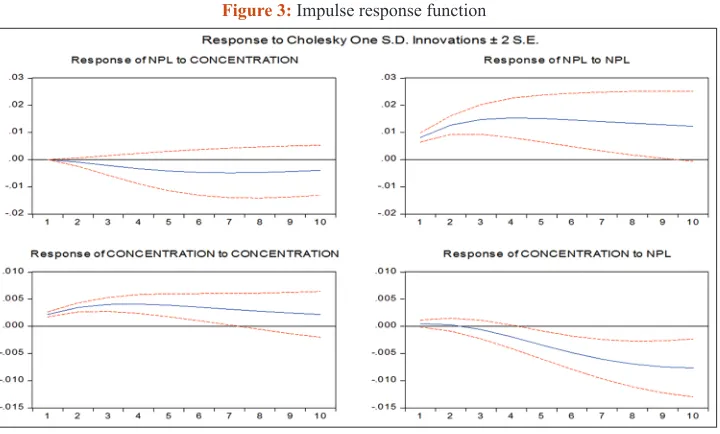
We perform several robustness tests employing structural breaks tests on the residuals. We also perform an Impulse response test to measure to what extent and how long a shock in the concentration rate affects the behaviour of the NPL variable (Figure 3). In addition, we try to detect the presence of seasonal behaviour in the NPL variable which might give us more insight on its development.
First we start with a structural break test to see if the relationship has changed between the NPL variable and the concentration variable. As we have indicated earlier, there are some periods where we expect to have a large impact on the banking sector in Libya. Nevertheless, in our analysis for the structural break
test we will first employ the Quandt and Andrews methodology
of unknown structural breaks. Doing so will prevent us from predetermining when the structural change occurred, if ever (Table 5).
All three tests of the Quandt and Andrews test indicate that there
is a structural break in the data, with high probability. In addition,
the first results indicate that the most probable structural point in the data is 01Q2006. This date goes in line with our first analysis
of the reform measures that were taken during the period under examination. We also test the proposed structural point using the
Chow structural break test for assurance, and the results affirm those in the Quandt and Andrews results1.
Next, we impose a shock on the concentration variable and see what is the effect of such shock on the NPL’s variable. In practice,
a 5% shock to the concentration variable could be the acquisition
of a medium-size bank by a big bank. Since our analysis is mainly concerned with the aggregate data, we will not make any further assumption.
Given the goals of this analysis, we will only focus on the upper-left
graph. Here we notice that a positive shock on the concentration
will lead to a permanent decline in the NPL ratio by almost 16.
This result also comes in support to our pervious findings on the
negative effect of concentration on the NPL ratio.
Lastly, we try to detect any seasonal patterns in the NPL’s ratio variable. As shown in Figure 4, we noticed a magnifying factor in the fourth quarter data. This can be explained by the fact that commercial banks in general, and government-owned banks in
Figure 3: Impulse response function
Source: Author’s calculation
Table 5: Quandt and Andrews structural break test
Statistic Value P
Maximum LR F-statistic (2006Q1) 14.44658 0.0000
Maximum Wald F-statistic (2006Q1) 28.89316 0.0000
Exp. LR F-statistic 4.995995 0.0001
Exp. Wald F-statistic 11.79133 0.0001
Ave LR F-statistic 6.041549 0.0005
Ave Wald F-statistic 12.08310 0.0005 Null hypothesis: No breakpoints within 15% trimmed data
Varying regressors: C CONCENTRATION
Equation sample: 2002Q1 2013Q4 Test sample: 2004Q1 2012Q1 Number of breaks compared: 33
1 The results are available upon request.
specific, were used to negotiating the restructure of loans and the
repayment settlements by the end of each year. Nevertheless, we notice that this phenomenon started to die out by the end of the sample period. We also ran a regression of the seasonally adjusted NPL variable, and found out that the results were similar to the ones obtained from the original model1.
7. CONCLUSION AND POLICY
IMPLICATION
In our paper, we examined the relationship between NPLs, as a measure of stability, and concentration, as a measure of competition, in the Libyan banking sector. We used aggregate quarterly data for the 15 commercial banks in the country during
the period 2002-2013. A broad set of tests were conducted to
measure the relationship between the two variables, and alternative
robustness tests were conducted to assure our core finding that
less competition in the banking sector leads to a more resilient banking sector. Thus, our results offer empirical support against stability” theory and conforms to the “competition-fragility” literature.
Also, we recommend the need to inspect in more detail (on a bank by bank level) the relationship between competition and fragility in developing countries in general, and in Libya in particular. It is important to examine if alternative measures of competitive
behaviour confirm our initial results and which levels of competition,
if any, may be optimal to maintain a stable banking system.
In conclusion, we note that more detailed data on the banking sector
in Libya would yield more fruitful analysis. Given the heterogeneous nature of the banking sector in Libya, it would be more beneficial to
conduct the analysis on a bank by bank level. Comparison studies of “big versus small,” government-owned versus private, and domestic versus foreign gives more in-depth on the structure of the banking sector, especially in developing countries.
REFERENCES
Allen, F., Gale, D. (2004), Competition and financial stability. Journal of Money, Credit and Banking, 36(3), 453-480.
Barth, J.R., Caprio, Jr, G., Levine, R. (2001), The regulation and supervision of banks around the world – A new database. Economic
Issues No. 1. Washington: World Bank.
Beck, T., Coyle, D., Dewatripont, M., Freixas, X., Seabright, P. (2010),
Bailing out the Banks: Reconciling Stability and Competition - An Analysis of State-Supported Schemes for Financial Institutions.
Centre for Economic Policy Research Working Paper, 1-102. Berger, A.N., Demirgüç-Kunt, A., Levine, R., Haubrich, J.G. (2004), Bank
concentration and competition: An evolution in the making. Journal
of Money, Credit and Banking, 36(3), 434-450.
Bikker, J.A., Groeneveld, J.M. (2000), Competition and concentration in the EU banking Sindustry. Kredit und Kapital, 30, 62-68.
Bikker, J.A., Haaf, K., (2002), Competition, concentration and their
relationship: an empirical analysis of the banking industry. Journal
of Banking and Finance, 26, 2191–2214.
Bikker, J.A. (2004), Competition and Efficiency in a Unified European
Banking Market. Cheltenham: Edward Elgar.
Boyd, J.H., de Nicolo, G. (2003), The theory of bank risk-taking and
competition revisited. Working Paper No. 114. Washington: International Monetary Fund.
Boyd, J.H., de Nicolo, G., Smith, B.D. (2004), Crises in competitive
versus monopolistic banking systems. Journal of Money, Credit and
Banking, 36(3), 487-506.
Caminal, R., Matutes, C. (2002), Market power and bank failures. International Journal of Industrial Organization, 20(9), 1341-161. Canoy, M., Dijk, M.V., Lemmen, J., Mooij, R.D., Weigand, J. (2001),
Competition and stability in banking. CPB Document, 015, 1-161. Caprio, Jr, G., Klingebiel, D. (2004), Episodes of systemic and
borderline financial crises. Washington: World Bank. Available
from: http://www.siteresources.worldbank.org/INTRES/
Resources/469232-107449512766/648083-1108140788422/23456_
Table_on_systemic_and_nonsystemic_banking_crises_
January_21_2003.pdf.
Cordella, T., Yeyati, E.L. (2002), Financial opening, deposit insurance
and risk in a model of banking competition. European Economic Review, 46(3), 471-485.
Davidson, J. (2000), Econometric Theory. 1st ed. United Kingdom:
Blackwell Publishing Limited.
Demirgüç-Kunt, A., Detragiache, E. (1998), The determinants of banking crises in developing and developed countries. IMF Staff Papers,
45(1), 81-109.
Detragiache, Enrica, and Spilimbergo, A., (2001), Crises and Liquidity–
Evidence and Interpretation, IMF Working Paper, 2.
Enders, W. (2010) Applied Econometric Time Series. 3rd edn. United
Kingdom: Wiley, John & Sons, Incorporated.
Fischer, K.P., Chenard, M. (1997), Financial Liberalisation Causes Banking System Fragility. Centre of Economic and Applied Finance Research, University of Laval, 12.
Fungáčová, Z., Solanko, L., Weill, L. (2010), Market Power in the Russian Banking Industry. IFS Working Paper, p1-30.
Hellman, T.F., Murdoch, K., Stiglitz, J.E. (2000), Liberalization, moral
hazard in banking and prudential regulation: Are capital requirements
enough? American Economic Review, 90(1), 147-165.
Ömer, İ., Tomak, S. (2013), Competition and stability: An analysis of the
Turkish banking system. International Journal of Economics and Financial Issues, 3(3), 752-762.
Perotti, E.C., Suarez, J. (2002), Last bank standing: What do I gain if you
fail? European Economic Review, 46(9), 1599-1622.
Schaeck, K., Cihak, M., Wolfe, S. (2006), Are more competitive banking
systems more stable? Economic Issues No. 143. Washington: International Monetary Fund.
Smith, B.D. (1984), Private information, deposit interest rates, and the ‘stability’ of the banking system. Journal of Monetary Economics, 14, 293-317.
Vives, X. (2001), Competition in the changing world of banking. Oxford
Review of Economic Policy, 17(4), 535-547.
Figure 4: Seasonal factor of nonperforming loans