www.dx.doi.org/10.21113/iir.v8i1.388
_____________________________
ILIRIA International Review – Vol 8, No 1 (2018)
Abstract
ssThe aim of this paper is to identify if there are differences in the efficiency of innovation performance between the two groups of countries: EU candidate countries such as Macedonia, Serbia and Turkey and the average level of innovation performance in EU-28 countries from 2010 - 2017. The further paper’s analysis aims to identify the most crucial factors and indicator that contribute to the efficiency of innovation performance in both groups of countries.
In that sense, the comparative analyses of the two observed groups of countries has been done, using the European Innovation Scoreboard (EIS) data as well as 12 EIS indicators for the period 2010 - 2017. For benchmarking of the countries three indicators are created: sub-index Input Innovation (II), sub-index Output Innovation (OI) and the Innovation Efficiency Performance Index (IEPI).
The findings show that there is a difference in efficiency of innovation performance indicators between the observed two groups of countries, but as well as among each the EU candidate country. In fact, Macedonia (IEPI=2.33) has twice higher efficiency of transforming innovation inputs into innovation output unlike the EU28 countries (IEPI=1.17), Serbia (IEPI=1.06) and Turkey (IEPI=.24).
Dr.Sc. Slagjana STOJANOVSKA,
Dr.Sc. Violeta MADZOVA
Differences in efficiency of innovation
performance among EU candidate
countries and EU 28 countries
_____________________________
ILIRIA International Review – Vol 8, No 1 (2018)
It can be noted as well that Macedonia managed to use its limited resources to input (sub-index II= 0.13) in much more efficient/productive way (IEPI= 2.33) and to obtain most output innovation (sub-index OI= 0.29). This paper’s findings can be used for designing better innovation policy in the observed EU candidate countries.
Key words: efficiency; innovation performance; input; output; comparative analysis;
1. Introduction
It is a widespread understanding that innovation is the driving force of the economic growth of a country, region or a company. Hence, the Europe’s growth strategy sets the target of “improving the conditions for innovation, research and development (R&D)” (European Council, 2010), in particular with the aim of “increasing combined public and private investment in R&D to 3% of GDP” (European Commission, 2013, p. 12) by EU Member States. In order to determine the contribution of innovation to the Europe 20201, the European Commission (2017) uses the European
Innovation Scoreboard (EIS)2 previously called Innovation Union
Scoreboard (IUS)3 to evaluate and compare the innovation performance of
its 28 EU Member States (European Commission, 2017, p. 8). It also provides trend analyses for the non-European countries (such as Macedonia, Serbia, Turkey, Norway and Switzerland). In this paper the EIS/UIS used interchangeably.
The EIS/IUS composite indicator as well as the Summary Innovation Index (SII)4 is computed as an equally weighted average of different
1 The Europe 2020 is, strategy for smart, sustainable and inclusive growth launched by European Commission has aim to help of countries in the region to go out of the crisis and through structural reforms to prepare the EU economy for the future.
2 The EIS was developed by the European Commission (EC), under the Lisbon Strategy (e.g., that “3% of the EU’s GDP -public and private combined- to be invested in R&D/innovation” by 2020).
3 The EIS reports have been published under the name “European Innovation Scoreboard” until 2009, as “Innovation Union Scoreboard” between 2010 and 2015, and again as “European Innovation Scoreboard” from 2016 onwards.
_____________________________
ILIRIA International Review – Vol 8, No 1 (2018)
indicators by combining data from different data sources such as the Community Innovation Survey, EUROSTAT and other internationally recognised sources such as the OECD and the United Nations available at the time of analysis. The methodological base for the construction of the SII, selection of indicators, modelling choices (weighting, aggregation methods), missing data, lack of reliability of statistical data in the EIS/IUS are not exempt of controversy by the scholars (Zabala et al., 2007a; Edquist and Zabala, 2015; Schibany and Streicher, 2008; Nasierowski and Arcelus, 2012; Grupp and Schubert, 2010, Eggink, 2012). Regardless these shortcomings, there is a separate branch of innovation literature which widely used the EIS/IUS database to measure and compare relative efficiency of the performance of country’s innovation systems (Zabala et al., 2007a; Edquist and Zabala, 2015; Nasierowski and Arcelus, 2003, 2012; Gourova, 2015). However, in Europe the EUS/IUS forms the leading index in the area of innovativeness and encourage political discussions at national and EU level by tracking progress in innovation performance.
In this paper comparative analysis of the efficiency of innovation performance between two groups countries the EU candidate countries, such as Macedonia, Serbia and Turkey and EU28 countries on average is conducted, using the EIS/IUS indicators. Additionally, a comparative assessment of the country’s strengths and weaknesses is done. The analysis rely mainly on the methodology created by Edquist and Zabala (2015), who have selected four input and eight output indicators (total 12 indicators) from total the 25 EIS indicators in 2015 and relate to each other. The list of small number of selected indicators should characterize innovation system, but not be equally considered for the whole innovative system (IS). The idea is the innovation process of the selected countries in this paper to be constituted by the same indicators and to enable benchmarking.
_____________________________
ILIRIA International Review – Vol 8, No 1 (2018)
innovators and modest countries. The observed EU-candidate countries5
(or non-EU countries) as Serbia and Turkey belong to the moderate
innovators group while Macedonia belongs to the group of modest
innovator countries.
As the innovation is not a linear process where inputs automatically transfer into outputs, we are analysing the period from 2010 to 2016 on average in order to answer to the following questions:
Do the observed groups of countries differ in their degree of efficiency in transforming innovation inputs to outputs? and
Which are the key indicators that impact the most on their performance?
This paper is structured as follows. The next section presents a brief review of the literature. The Section 3 describes the methodological underpinnings of the research. The interpretation of the findings is provided in section 4, while the Section 5 concludes the study.
2. Literature review
Many definitions of innovation, including the OECD-Eurostat (2005) definition, accept Schumpeter’s definition (1934) as a foundation, explaining that innovation covers five areas: product innovation, process innovation, marketing innovation, input innovation, and organizational innovation. The term innovation not only describes innovation as an invention, or a technological improvement, but also includes “the implementation of a new or significantly improved product (good or service), or process, a new marketing method, or a new organisational method in business practices, workplace organisation or external relations. ”… The minimum requirement for an innovation is that the product, process, marketing method or organisational method must be new (or significantly improved) to the firm” (OECD-Eurostar, 2005, p. 46).
In the modern innovation theory, from the late 1980s, the innovation is viewed as a collective activity. It takes place within the context of a wider system (innovation system) that is formed from firms, organisations, institutions and interactions between these innovation process actors, which produce, distribute and make use of the new knowledge. The
_____________________________
ILIRIA International Review – Vol 8, No 1 (2018)
founders of the National innovation systems (NIS) approach, Freeman (1987), Lundvall (1992) and Nelson (1993) offer their own definition mainly caused by different approaches, views and research objectives. For Freeman (1987) the NIS is “… the network of institutions in the public and private sectors whose activities and interactions initiate, import, modify and diffuse new technologies”. Based on these definitions the work by Lundvall (1992) lades to next the NIS definition “….. the elements and relationships which interact in the production, diffusion and use of new, and economically useful, knowledge ...”. Nelson (1993) understands the NIS as “... a set of institutions whose interactions determine the innovative performance ... of national firms.” Overall, the concept of a NIS comprises the two broad categories of variables: (1) variables related to innovation processes within and among firms, and (2) variables related to the innovation infrastructure surrounding and enabling innovations by firms (Faber and Hessen, 2004). The variables in the both NIS categories can be classified as “input variables, transformation/process variables, or output variables” (Faber and Hessen, 2004, p. 194), but the output variables in the second NIS category (the national infrastructure level) are aggregates of those in the first NIS category, innovation within and among firms. The results of this integrating structure (NIS) differ in terms of their goals and objectives that “determine the innovative performance of the system” (Eggink, 2012, p. 2).
The performance is the result of innovation activity and refers to “the result(s) of an activity (or set of activities)”, or “the results achieved after the activity has started” (Spronk and Vermeulen, 2003, p. 482) or “what comes out of the system” (Edquist and Zabala, 2009, p.4) - in the form, for example, of newly developed products (Schmiedeberg, 2008). However, the “output” or performance should not be confused with the “outcomes” or impact of the system on, for example, economic growth, employment or labour productivity.
_____________________________
ILIRIA International Review – Vol 8, No 1 (2018)
innovation outputs” (Hollanders and Celikel-Esser, 2007, p. 4). Or, in context of this, innovation efficiency can be defined as the ability of firms to translate innovation inputs into innovation outputs. By OECD (2008) innovation efficiency/productivity is defined by OECD as “a ratio between the output volume and the volume of inputs” (Hollanders and Celikel-Esser, 2007, p.11). In this line, the Global Innovation Index (GII) calculates the score of the Innovation Efficiency Ratio as “ratio of the Output Sub-Index score over the Input Sub-Sub-Index score” (Cornell University, INSEAD, and WIPO, 2017, p. 12).
In order to measure the efficiency of innovation system’s performance, the output and input indicators “must be separated into indicators that reflect the input character of innovation (causes, determinants) and other measures which reflect the outputs of the innovative action (actual innovations)” (Edquist and Zabala, 2015, p. 10). As Wagner-Döbler (2005) argues “input indicators capture what is used to produce knowledge, financial means as a basic necessity, for example, further on equipment, labs, and so on” (Wagner-Döbler, 2005, p.147), while “output indicators deal with the outcome of knowledge production” (Wagner-Döbler, 2005, p. 147).
Innovation is a continuous process and it is difficult to measure (OECD, 2005, p.15). There are different methodologies and proposals as can be measured innovation performance. Several study promoted input approach (Nasierowski and Arcelus, 2012), some output orientation (Edquist and Zabala, 2009) or comprehensive approach (such as the EIS and the GII).
In Europe, the most commonly used composite indicators of innovation is the EIS/IUS, developed at the initiative of the European Commission under the EU Lisbon Strategy aiming to provide a comparative assessment of the innovation performance and the strengths and weaknesses of EU28 Member States. Over the last decade considerable criticism6 has been
addressed to the EIS/IUS a basic model, selection of indicators, and modelling choices, not capturing important dimensions of the innovation process, in terms of using improper indicators, or neglecting the structural differences among the countries, or “missing data” problems (Schibany and
_____________________________
ILIRIA International Review – Vol 8, No 1 (2018)
Streicher, 2008; Hollanders and van Cruysen, 2008; Grupp and Schubert, 2010; Nasierowski and Arcelus, 2012; Edquist and Zabala, 2015; Foray and Hollanders, 2015). For example, Grupp and Schubert (2010) have criticized the weighting system in the EIS and find that the SII is extremely non-robust to changes in weights. The critical discussion by Schibany and Streicher (2008) refers to the selection of indicators, ignoring their mutual interaction, the mixture of short-term and long-term indicators, multicollinearity, the assumption “more is better”, outliers, statistical issues and comparability. Nasierowski and Arcelus, (2012) consider that the EIS/IES methods “do not take into account weights of importance of the elements used, which leads to the implicit assumption that all countries are equally efficient in the transformation of their inputs into their outputs” (Nasierowski and Arcelus, 2012, p. 798). The study by Edquist and Zabala (2015) argue that the SII does not distinguish inputs from outputs and puts them together in one single measurement, so productive/efficiency “at the same time, mix inputs and outputs” (Edquist and Zabala, 2015, p.9) instead “to be related to each other” (Edquist and Zabala, 2015, p. 10-11).
In order to meet the criticisms and to improve the scientific validity and policy of relevance of the scoreboard, European Commission stimulate an expert workshop7, forums8 and meetings and take into account the
discussions and the written comments for improving of the EIS/IUS. More major revisions and changes to the methodology have been in 2005, 20089,
2010, and 2017 (European Commission, 2017). After the revisions in 2010, criticism continued to be expressed because “the changes have not contributed to improving methodology and conceptual consistency of the IUS model” (Adam, 2013, p. 19). The last revision of the EIS 2017 measurement framework10 involves only a regrouping of the EIS 2016
innovation dimensions and adding one more dimension, revision of the main category of indicators and deleted, revised and adding new indicators (European Commission, 2017), while measuring of the EIS/IUS
7 The workshop on "Improving the European Innovation Scoreboard methodology" which took place in Brussels the 16th of June, 2008.
8 The EIS was criticised of the event known as the “OECD Blue Sky Forum” that held in Ghent (2016), for more see at http://www.oecd.org/innovation/blue-sky.htm
9 For more details, see the EIS 2008 Methodology Report.
10 Full details on the EIS methodology and the rationale for the new framework of the SII are available in the EIS 2017 Methodology Report. Available at
_____________________________
ILIRIA International Review – Vol 8, No 1 (2018)
performance continued to be calculated as “average of total (27) indicators” (European Commission, p.8), that is mix by inputs and outputs indicators.
Despite such weaknesses and criticisms, the EIS/IUS presents a road-map in improvement in Europe. On the other hand, the scholars agree that the SII is leading index in the area of innovativeness and that the EIS/IUS performance give a good overview in some of the relevant fields of the innovativeness.
3. Methodology and Data
The methodology model that will be used for measuring the efficiency of innovation performance in this paper is the model proposed by Edquist and Zabala (2015). In fact the actual methodology implemented in this paper selects only 12 indicators (four input and eight output indicators) out of 25 indicators in order to characterize the innovation system of the observed groups of countries. The indicators are employed by two groups of indicators (output and inputs group of indicators), as separate dimensions of the innovation process, and are related to each other. The output group of indicators reflect the output character of the innovative action (actual innovations), while the input group of indicators reflect the input character of innovation (causes, determinants) (Zabala et al., 2007a; Edquist and Zabala, 2015). The reasoning is that if the score of the input group of indicators is much larger from the score of the output group of indicators, the efficiency of the innovation system will be low. However, if the score of the output group of indicators is much larger, the efficiency of the innovation system will be high. The score of the efficiency of innovation performance provided by the ratio between these two groups of indicators shows the ability of the innovation system to translate innovation inputs into innovation outputs.
_____________________________
ILIRIA International Review – Vol 8, No 1 (2018)
Table 1: Output Innovation (OI) structure
Output Innovation Indicators Group Output Indicator (OI) Interpretation
OI.1 SMEs introducing product or process innovations (% of SMEs)
Technological innovation, as measured by the introduction of new products (goods or services) and processes is a key ingredient to innovation in manufacturing activities. OI.2 SMEs introducing
marketing or organ. innovations (% of SMEs)
This indicator captures the extent to which SMEs innovate through non-technological innovation.
OI.3 SMEs innovating in-house (% of SMEs)
This indicator measures the degree to which SMEs that have introduced any new or significantly improved products or
production processes have been innovated in-house.
OI.4 Trademarks applications per billion GDP (in PPP€)
Trademarks are an important innovation indicator, especially for the service sector. It fulfils the three essential functions of a
trademark: it identifies the origin of goods and services, guarantees consistent quality
through evidence of the company's
commitment vis-à-vis the consumer, and is a form of communication, a basis for publicity and advertising.
OI.5 Designs
applications per billion GDP (in PPP€)
A design is the outward appearance of a product or part of it resulting from the lines, contours, colours, shape, texture, materials and/or its ornamentation.
OI.6 Export of medium and high-tech products as a share of total product export
_____________________________
ILIRIA International Review – Vol 8, No 1 (2018) OI.7
Knowledge-intensive services exports (as % of total services
This indicator measures the competitiveness of the knowledge-intensive services sector
OI.8 Sales of new- to- market and new- to- firm innovations (as % of turnover)
This indicator measures the turnover of new or significantly improved products and includes both products which are only new to the firm and products which are also new to the market. The indicator thus captures both the creation of state-of-the-art technologies (new to market products) and the diffusion of these technologies (new to firm products).
Source: European Commission, European Innovation Scoreboard 2017, pp. 85-89
_____________________________
ILIRIA International Review – Vol 8, No 1 (2018)
Table 2: Input innovation structure
Input Innovation Indicators Group Input Indicator (II) Interpretation
II.1 R&D expenditure in the public sector (% of GDP)
Trends in the R&D expenditure indicator provide key indications of the future competitiveness and wealth of the EU.
II.2 Venture capital (% of
GDP) The amount of venture capital is a proxy for the relative dynamism of new business creation. In particular for enterprises using or developing new (risky) technologies; venture capital is often the only available means of financing their (expanding) business. II.3 R&D expenditure in
the business sector (% of GDP)
This indicator captures the formal creation of new knowledge within firms.
II.4 Non-R&D innovation
expenditures (% of turnover)
This indicator measures non-R&D innovation as percentage of total turnover. Several of the components of innovation expenditure, such as investment in equipment and machinery and the acquisition of patents and licenses, measure the diffusion of new production tech. and ideas.
Source: European Commission, European Innovation Scoreboard 2017, pp. 85-89
The EIS 2017 (European Commission, 2017), the measurement framework has been significantly revised compared to the 2016 European Innovation Scoreboard (EIS) which largely followed the methodology of previous edition (for example, in 2015, 2014 and 2013). The changes made to the EIS measurement framework for the 2017 edition are by both, (1) regrouping and addition of dimensions (10 dimensions now compared to 8 dimensions in the EIS 2016) and (2) deleted, revised and addition new indicators that reflected digitisation and entrepreneurship. So, the EIS 2017 includes in total 27 indicators compared to 25 indicators in the EIS 2016.
_____________________________
ILIRIA International Review – Vol 8, No 1 (2018)
from the 12 selected indicators, now includes value of the indicator “License and patent revenues from abroad”, that previous in the EIS 2016, was a separate indicator and second, the indicator “Trademark applications” has been revised, by including trademark applications at the World Intellectual Property Organization (WIPO).
So, based on the mentioned methodology the framework of Innovation Efficiency Performance Index (IEPI) was created and it is presented in Figure 1. The IEPI relies on two sub-indexes Output Innovation (OI) and sub-index Input Innovation (II). The sub-index OI capture eight output indicators (n=8) while the sub-index II capture four input indicators (n=4). Thus out of this model three scores are calculated: the IEPI, the sub-index II and the sub-index OI. The score of the sub-index OI and the sub-index II is calculated as the simple average of the scores of their indicators. The IEPI score is provided by a ratio between the index OI score and the sub-index II score (IEPI = sub–sub-index OI/sub sub-index II)11. This simplified version
implies the same rationality in assessing the extent to which innovation inputs are transformed into innovation outputs.
Figure 1: Innovation Efficiency Performance Index framework
Source: Authors’ own creation
For the purpose of this paper the data for EU28 countries and the three EU candidate countries are provided by the Eurostat and Community Innovation Survey. The selected 12 EIS indicators have normalized score (minimum score is equal to 0 and maximum score is equal to 1). The data
11 The Global Innovation Index 2016, produced by Cornell University, INSEAD, and WIPO calculated the “Innovation Efficiency Ratio” as ratio between the Innovation Output Sub-Index and the Innovation Input Sub-Sub-Index for all countries.
Innovation Efficiency Performance Index (IEPI)
Sub-Index Output Innovation (OI)
Ratio
Sub-Index Input Innovation (II)
_____________________________
ILIRIA International Review – Vol 8, No 1 (2018)
can be found in EIS database 2017 (excel document with data by indicators and countries from 2009 to 2016), available on the EIS website12.
4. Analysis
This section presents an overview of the seven-year average score (2010-2016) of 12 selected EIS / UIS indicators with normalized score as it was listed in Table 1 and 2 and it compared the indicators of EU28 countries, with those in selected EU candidate countries: Macedonia (MK), Serbia (RS) and Turkey (TR).
4.1. Analysis of the selected output innovation indicators
The average score for 2010-2016 of the eight output indicators are presented in the Chart 1 (see Annex 1, normalized scores of output indicators from 2010 to 2016, individually). According to the chart’s results seven-year average of the normalized score of output indicator “SMEs introducing product or process innovations” (OI1) Macedonia with the score of 0.65 has achieved even better position than the EU28 on average (having the score of 0.49), while, the scores for Turkey and Serbia are much behind (0.41 respectively 0.38). The scores show that although all countries have taken significant activities in terms of improving technological innovation such as the introduction of new products and processes, Macedonia is a leader in that respect. Next indicator “SMEs introducing marketing or organizational innovations” (OI2), puts Turkey (0.66) at the leading position, followed by EU28 average (0.53) and then by Serbia (0.45) while Macedonia achieved the lowest score (0.39) of all of the observed countries. Looking at the scores of the indicator ”SMEs innovating in-house” (OI3), the best score is achieved by EU28 average (0.55) followed by Serbia (0.51) and Turkey (0.42) while Macedonia (0.08) has the lowest and insignificant score, showing that Macedonian SME have almost no in-house innovation. Considering the indicator “Trademarks application” (OI4), the three EU candidate countries show that their companies are not committed in creation, neither of their trademarks nor to use it for promotion and advertising. So, Turkey and Macedonia achieving insignificant scores of (0.02) respectfully (0.07), show their companies’ ignorant attitude in
_____________________________
ILIRIA International Review – Vol 8, No 1 (2018)
creating and taking the benefit of the companies’ trademark, while Serbia (0.18) and EU28 average (0.39) pay much more attention on trademark application.
Chart 1: Output innovation indicators: average 2010-2016
Source: Authors’ own calculation
_____________________________
ILIRIA International Review – Vol 8, No 1 (2018)
4.2. Analysis of the selected input innovation indicators
The average score for 2010-2016 of the four input indicators are presented in the Chart 2 (see Annex 2, normalize scores of input indicators from 2010 to 2016, individually). As the chart show reading the indicator “R&D expenditures in public sector” (II1) the EU28 (0.63) has the best seven-year average score flowed by Serbia (0.54) and Turkey (0. 39) while Macedonia has the lowest score of (0. 03). As for the “Venture Capital
investments” (II2) indicator, the EU28 (0.40) achieves the best input
innovation score versus insignificant scores achieved in Macedonia (0.00), Turkey (0.00) and Serbia (0.05). This means that companies in these three EU-candidate countries are not using this favourable source for financing their companies’ growth and investments in new technologies. The third input indicator “R&D expenditures in business sector” (II3) is also very unfavourable for the business in EU candidate countries. This input indicator is particularly important in the science-based sector (pharmaceuticals, chemicals and some areas of electronics) which requires well equipped R&D laboratories. Thus, the seven-year average scores for Macedonia (0.00), Serbia (0.05) and Turkey (0.16) are very low, while EU28 countries (0.49) have achieved high score.
Chart 2: Input innovation indicators: average 2010-2016
Source: Authors’ own calculation
_____________________________
ILIRIA International Review – Vol 8, No 1 (2018)
achieving the scores of Macedonia (0.47), Turkey (0.47) and Serbia (0.6) it clearly shows that their companies invest in equipment and machinery and acquisition of patents and licenses rather than in research for developing new technology or innovative products and processes.
Why do the countries differ so much in the achieved input or output indicators? Important factors that explain this issue are “the differences in the share of industry in GDP and so-called high-tech activities in manufacturing and services” (European Commission, 2017, p. 40). Medium-high and high-tech industries13 have higher technological
intensities than other industries.
These industries, on average, have higher R&D expenditures or shares of innovating enterprises. Countries with above-average shares of these industries are expected to perform better on several EIS indicators. For example, for the EU28 on average, 85% of R&D expenditures in manufacturing are accounted for by medium-high and high-technology manufacturing industries. Also, the share of enterprises that introduced a product and/or process innovation is higher (53%) in medium-high and high-technology manufacturing industries compared to all core industries (31%) covered in the Community Innovation Survey14.
As it can be noticed from Chart 2, Macedonia, Serbia and Turkey have low share in GDP by the business R&D expenditures. According to the EIS 2017 (European Commission, 2017) Macedonia has a larger share of employment in Industry and a smaller share of employment in Services (European Commission, 2017, p. 72); Serbia has a smaller share of employment in Services (European Commission, 2017, p. 74) while Turkey has a larger share of employment in Agriculture, Mining and Manufacturing, a smaller share of employment in High and Medium high-tech manufacturing, Services and Knowledge-intensive services, a lower number of Top R&D spending enterprises and a lower average R&D spending of these enterprises (European Commission, 2017, p. 76).
13 OECD classification consists four categories: high-tech, medium-tech, medium-low and low-tech of manufacturing industries based on the respective sectors’ average share of expenditures for R&D, available at:. https://www.oecd.org/sti/ind/48350231.pdf, Accessed at 28.08.2017.
14 For the industries and services included in the Core target population accordance with Commission Regulation No 995/2012, covered in the CIS see at
_____________________________
ILIRIA International Review – Vol 8, No 1 (2018)
4.3. The country’s weaknesses and strengths in innovation
As Figure 2 shows (see Appendix 1), the output innovation gap between the EU28 and the three EU-candidate countries is mostly due to the very low score in two innovative activities achieved by EU-candidate countries:
Trademarks applications (OI4) and Designs applications (OI5).
Figure 2: Country’s performance: Weaknesses/Strengths
Source: Authors’ own calculation
In addition to this, Macedonia has the weakest innovative activities in the SMEs innovating in-house indicator, while Turkey is the poorest in the
Knowledge-intensive services exports (OI7) indicator. Anyhow EU28 countries are much superior in the performance in almost all of the output innovation indicators except in indicator SMEs introducing product or process
innovations (OI1), where Macedonia achieved the best score, and SMEs
introducing marketing or organization innovations (OI2) indicator, as Turkey has the best performance, while it has equal score with Serbia regarding the third output innovation indicator SMEs innovating in-house (OI3).
_____________________________
ILIRIA International Review – Vol 8, No 1 (2018)
Analysing the strengths and weaknesses of the observed group of countries in the input innovation aspect (as presented in the Figure 3), it can be concluded that three EU-candidate countries are superior only in one input innovation indicator ”Non-R&D innovation as % of turnover“
while in the rest three input innovation indicators are much behind the performance of EU-28 countries. Also, it can be noted that the superior performance of EU28 countries especially in high expenditure of R&D in both public and business sector coincide very well with the Europe’s growth strategy i.e. EU policy of raising its expenditure of R&D to the 3% of GDP level.
From Figure 3 can be seen the companies in this EU-candidate countries, but also a large part in EU28 that acquire new ideas and technologies through investment in equipment and machinery or maybe through the acquisition of patents and licenses.
Figure 3: Country’s input innovation: Weaknesses/Strengths
Source: Authors’ own calculation
_____________________________
ILIRIA International Review – Vol 8, No 1 (2018)
out R&D, while another 4.7% innovated through technology adoption. Additionally, there is the finding that non-R&D innovators are relatively more dependent than R&D performing firms on the diffusion of knowledge from other companies, particularly through knowledge embodied in acquired products and processes.
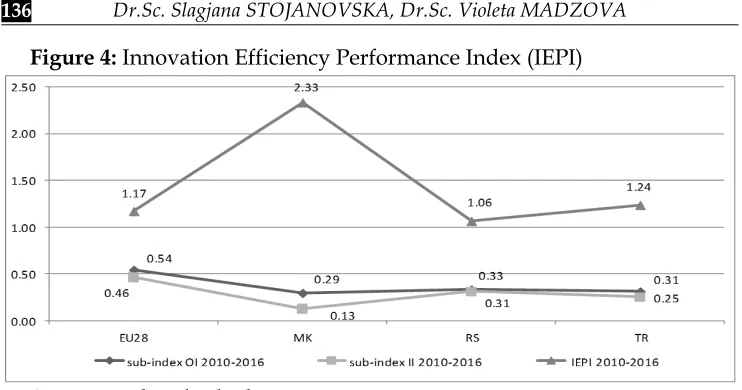
4.4. The efficiency of country’s innovation performance
As already described, the efficiency of innovation performance is measured by the Innovation Efficiency Performance Index (IEPI) which is created for this purpose. The score of the IEPI is calculated as ratio of the sub-index Output Innovation (OI) score and the sub-index Input Innovation (II) score15. The country’s IEPI score implies both assessing the
efficiently use of the country’s innovation inputs i.e. how efficiently the country transform innovation input into innovation output and how much innovation output a given country is getting for its inputs.
As Figure 3 shows the countries differ in the extent of supporting the innovation (financially and institutionally) and the extent of innovations’ production. So, the seven-years average scores of sub-indexes II of EU28 countries on average (0.46) implies that those countries have committed much more resources in order to promote and support innovation while Serbia (0.31), Turkey (0.25) and especially Macedonia (0.13) are quite modest in that respect. In the same manner EU28 countries and therefore their companies are significant producers of innovations achieving the score (the sub-index OI= 0.54) while the scores of sub-index OI of Macedonia (0.29), Serbia (0.33) and Turkey (0.31) are lower.
_____________________________
ILIRIA International Review – Vol 8, No 1 (2018)
Figure 4: Innovation Efficiency Performance Index (IEPI)
Source: authors’ calculation
Analysing the scores of the Innovative Efficiency Performance Index (IEPI), presented in the Figure 4, it can be noticed that Macedonia (2.33) has achieved twice higher the IEPI score than the ones achieved in EU28 countries (1.17), Serbia (1.06) and Turkey (1.24).
It means that Macedonian companies has high efficiency of transforming innovation inputs into innovation output and that they manage to use their very limited resources of input (sub-index II=0.13) in a more efficient/productive way (IEPI=2.33) and to obtain most output innovation (sub-index OI=0.29).
_____________________________
ILIRIA International Review – Vol 8, No 1 (2018)
According to the above findings (for example, expenditure in R&D and medium-high and high-tech industries) and discussion for the EU28 countries on average, it can be concluded that their innovation systems are focused on radical innovations, the development of new industries in knowledge-intensive sectors and in high-tech industries. On the contrary, Macedonia, with the poor input innovation resources tends to absorb and adopt the embodied knowledge and the innovations of others to obtain a reasonable number of outputs. Furthermore, the analysis showed that the other two EU candidate countries, Turkey and Serbia, have committed much more resources for innovation than from Macedonia (and less from EU28 countries) but do not manage to use their innovation resources in a more efficient way and do not get much innovation output by their inputs.
5. Conclusion
This paper aimed to analyse whether the EU-candidate countries, observed through three representatives: Macedonia, Serbia and Turkey which differ extensively from EU28 countries on average, related to their efficiency of innovation performance, as well as to analyse the indicators that have influenced mostly on innovative performance efficiency in the observed group of countries, from 2010 to 2016. The later was even more challenging, having in mind that according to the SII, the 28EU member states and EU candidate countries are divided into four innovations country groups. Thus, Denmark, Finland, Germany, the Netherlands, Sweden, and the United Kingdom are Innovation Leaders; Austria, Belgium, France, Ireland, Luxembourg, and Slovenia are Strong Innovators; Croatia, Cyprus, the Czech Republic, Estonia, Greece, Hungary, Italy, Latvia, Lithuania, Malta, Poland, Portugal, Slovakia, and Spain are Moderate Innovators and Bulgaria and Romania are Modest Innovators (European Commission, 2017, p.7). From the EU candidate countries, Serbia and Turkey are representatives of” the moderate innovators group” while Macedonia belongs to the group of “modest innovators” (European Commission, 2017, p.7).
_____________________________
ILIRIA International Review – Vol 8, No 1 (2018)
The findings in this study show that Macedonia (IEPI 2010-2016 = 2,33) has twice higher efficiency of transforming innovation’s inputs into innovation’s output unlike the EU28 countries (IEPI 2010-2016 = 1,17), Serbia (IEPI 2010-2016 =1,06) and Turkey (IEPI 2010-2016 =1,24). So, it can be concluded that Macedonia managed to use its limited input resources (sub-index II= 0.13) in much more efficient/productive way (achieving seven-year average the IEPI = 2, 33) and thus to obtain better output innovation (sub-index OI 2010-2016 = 0.29).
According to the findings on the case of EU28 countries it is concluded that large resources invested in innovation input (sub-index II=0.46) do not necessarily correspond with proportional increase in innovation outputs (sub-index OI=0.54). One possible partial explanation for this contradiction is that EU28 countries on average have strong expenditure in R&D to obtain high level of output by investing in knowledge-intensive services and high-tech industries. On the other hand, Macedonia investing quite poor resources for innovation (sub-index II= 0.13), tends to adopt the embodied knowledge and the innovations from abroad and therefore to obtain a significant score of innovation outputs (sub-index OI=0.30). As we have pointed out in this paper, the analyses show that countries are differing in the efficiency of performance, but their different innovation inputs result with different level of innovation outputs.
List of References
Adam, F. (2013). “Measuring national innovation performance: the Innovation Union Scoreboard revisited”, Springer Science & Business Media.
Arundel A, Bordoy C, Kanerva M. (2008). Neglected innovators: How do innovative firms that do not perform R&D innovate? Results of an analysis of the Innobarometer 2007 survey, No. 215, INNO-Metrics Thematic Paper, European Commission, DG Enterprise, Brussels, March 31.
Brenner, T., Broekel, T. (2009). Methodological issues in measuring innovation performance of spatial units. Papers in Evolutionary Economic Geography 09.04, Utrecht University. Avelable at: ftp://137.248.191.199/RePEc/pum/wpaper/WP3.pdf assessed on 20.01.2018.
_____________________________
ILIRIA International Review – Vol 8, No 1 (2018)
Eggink, M.E. (2012). Innovation System Performance: How to address the Measurement of a System’s Performance, IBIMA Publishing, Journal of Innovation & Business Best Practices, Vol (2012), p. 1-9.
Edquist, C. and Zabala-Iturriagagoitiam J.M. (2015). The Innovation Union Scoreboard is flawed: The case of Sweden – not the innovation leader of the EU. CIRCLE Papers in Innovation Studies 2015/27. CIRCLE, Lund University.
Edquist, C., Zabala-Iturriagagoitiam, J. M. (2009). "Outputs of Innovation Systems: A European Perspective", Lund University, (Paper no. 2009/14), [Retrieved Maj 7, 2017], [Online] Available:
https://www.researchgate.net/publication/228365493_Outputs_of_inn ovation_systems_a_European_perspective [accessed Jan 21 2018].
European Innovation Scoreboard (various years). Available at: http://ec.europa.eu/DocsRoom/documens/24141
European Commission. (2017). European Innovation Scoreboard 2017 – Methodology Report, prepared by Hollanders, H. and N. Es-Sadki, European Innovation Scoreboard 2015-2017 report, Brussels: European Commission, DG GROW, 2017.
European Commission. (2014). Taking stock of the Europe 2020 strategy for smart, sustainable and inclusive growth, Brussels.
European Commission. (2013). Europe 2020: Europe’s growth strategy, Publications Office of the European Union, Luxembourg.
Freeman, C. (1987). Technology and Economic Performance: Lessons from Japan, Pinter, London.
Faber, J., Hesen, A.B. (2004). Innovation Capabilities of European Nations Cross-national Analyses of Patents and Sales of Product Innovations, Research Policy 33, available at
https://www.researchgate.net/publication/222604161_Innovation_cap
abilities_of_European_nations_Cross-national_analyses_of_patents_and_sales_of_product_innovations[access ed Jan 22 2018].
Foray, D., Hollanders, H. (2015). An assessment of the Innovation Union Scoreboard as a tool to analyse national innovation capacities: The case of Switzerland. Research Evaluation, 24, 213-228.
_____________________________
ILIRIA International Review – Vol 8, No 1 (2018)
Grupp, H., Schubert, T. (2010). Review and new evidence on composite innovation indicators for evaluating national performance, Research Policy 39, pp. 67–78.
Hollanders, H., van Cruysen, A. (2008). “Rethinking the European innovation scoreboard: A new methodology for 2008-2010”. Inno-Metrics Publication, European Commission. Available at
http://eu.eustat.eus/elementos/ele0006100/ti_Methodology_Report_EI
S_2008-2010/inf0006199_e.pdfhttp://eu.eustat.eus/elementos/ele0006100/ti_ Methodology_Report_EIS_2008-2010/inf0006199_e.pdf [accessed Jan 14 2018].
Hollanders, H., F. Celikel-Esser. (2007), “Measuring innovation efficiency”, INNO Metrics 2007 report, Brussels: European Commission, DG Enterprise. Available at:
http://eu.eustat.eus/elementos/ele0006100/ti_Methodology_Report_EI S_2008-2010/inf0006199_e.pdf [accessed Jan 22 2018].
Lundvall, B. A., (1992). National Systems of Innovation: Towards a Theory of Innovation and Interactive Learning. London: Pinter Publishers.
Nasierowski, W., Arcelus, F.J. (2012). About Efficiency of Innovations: What Can Be Learned From The Innovation Union Scoreboard Index,
Procedia - Social and Behavioral Sciences 58, p. 792-801.
Nasierowski, W., Arcelus, F.J. (2003). On the Efficiency of National Innovation Systems, Socio-Economic Planning Sciences, Vol. 37, No. 3, pp. 215–234.
Nelson R. (1993). “National Innovation Systems. A Comparative Analysis”,
Oxford University Press, p. 560 p.
OECD (2008). Productivity measurement and analysis. Paris: OECD and Swiss Federal Statistical Office.
OECD (2005). The Measurement of Scientific and Technological Activities; Oslo Manual, Guidelines for Collecting and Interpreting Innovation Data, 3rd Edition. OECD, Statistical Office of the European Communities, Luxembourg.
Schibany, A., Streicher, G. (2008). How not to compare innovation performance: A critical assessment of the European Innovation Scoreboard, Conference paper for the 2nd PRIME Indicators Conference on STI Indicators for Policy, Addressing New Demands of Stakeholders.
_____________________________
ILIRIA International Review – Vol 8, No 1 (2018)
money.html?utm_source=how-not-to-measure-innovation [accessed Jan 28 2018].
Schmiedeberg, C. (2008). Complementarities of innovation activities: An empirical analysis of the German manufacturing sector. Research Policy, 37(9), pp. 1492–1503.
Spronk, J. and Vermeulen, E.M. (2003). Comparative performance evaluation under uncertainty’, European Journal of Operational Research, Vol. 150, No. 3, pp. 482–495.
von Tunzelmann, N., Acha, V. (2005). Innovation in “low-tech” Industries. In: Fagerberg, J., Mowery, D.C., Nelson, R.R. (Eds.), The Oxford Handbook of Innovation. Oxford University Press, Oxford, pp. 407–432.
Wagner-Döbler, W. (2005). ‘The system of research and development indicators: entry points for information agents”, Scientometrics, Vol. 62, No. 1, pp. 145–153.
Zabala-Iturriagagoitia, J.M., Voigt, P., Gutiérrez-Gracia, A., Jiménez-Sáez, F. (2007a). Regional innovation systems: how to assess performance.
_____________________________
ILIRIA International Review – Vol 8, No 1 (2018)
Annex 1: The output innovation indicators (OI), for 2010-2016
Output
indicators Country
Years/ Normalized score (min 0 – max 1) Average 2010-2016 2010 2011 2012 2013 2014 2015 2016
OI1 EU28 0.55 0.55 0.51 0.51 0.44 0.44 0.45 0.49 MK 0.65 0.65 0.65 0.65 0.65 0.65 0.65 0.65
RS 0.15 0.15 0.57 0.57 0.4 0.4 0.39 0.38 TR 0.42 0.42 0.49 0.49 0.29 0.29 0.46 0.41 OI2 EU28 0.57 0.57 0.56 0.56 0.49 0.49 0.47 0.53
MK 0.39 0.39 0.39 0.39 0.39 0.39 0.39 0.39 RS 0.13 0.13 0.61 0.61 0.58 0.58 0.5 0.45 TR 0.77 0.77 0.61 0.61 0.63 0.63 0.58 0.66 OI3 EU28 0.56 0.56 0.59 0.59 0.52 0.52 0.52 0.55
MK 0.08 0.08 0.08 0.08 0.08 0.08 0.08 0.08 RS 0.5 0.5 0.64 0.64 0.43 0.43 0.47 0.51 TR 0.46 0.46 0.46 0.46 0.36 0.36 0.36 0.42 OI4 EU28 0.36 0.37 0.38 0.39 0.4 0.39 0.4 0.39
MK 0.05 0.06 0.08 0.09 0.07 0.03 0.11 0.07 RS 0.24 0.17 0.13 0.14 0.16 0.19 0.21 0.18 TR 0.01 0.01 0.02 0.04 0.04 0.03 0 0.02 OI5 EU28 0.47 0.47 0.47 0.47 0.47 0.45 0.44 0.46
MK 0 0 0 0 0 0 0 0
RS 0 0 0 0 0 0 0.01 0
TR 0.02 0.02 0.02 0.02 0.03 0.02 0.01 0.02 OI6 EU28 0.69 0.68 0.66 0.66 0.65 0.68 0.71 0.68
MK 0.23 0.38 0.42 0.51 0.63 0.71 0.73 0.52 RS 0.14 0.15 0.27 0.42 0.4 0.39 0.39 0.31 TR 0.36 0.38 0.36 0.29 0.34 0.33 0.35 0.34 OI7 EU28 0.67 0.67 0.68 0.68 0.68 0.69 0.7 0.68
MK 0.28 0.28 0.28 0.28 0.28 0.27 0.26 0.28 RS 0.35 0.35 0.33 0.37 0.36 0.36 0.36 0.35 TR 0.14 0.14 0.14 0.14 0.14 0.15 0.15 0.14 OI8 EU28 0.57 0.57 0.58 0.58 0.52 0.52 0.58 0.56
MK 0.38 0.38 0.38 0.38 0.38 0.38 0.38 0.38 RS 0.39 0.39 0.49 0.49 0.52 0.52 0.52 0.47 TR 0.24 0.24 0.24 0.24 1 1 0.42 0.48 Source: EIS database 2017 available at:
_____________________________
ILIRIA International Review – Vol 8, No 1 (2018)
Annex 1b: The sub-index Output Innovation (OI), average 2010-2016
Sub-index Country
Years Average
2010-2016
2010 2011 2012 2013 2014 2015 2016
OI EU28 0.56 0.55 0.55 0.56 0.52 0.52 0.53 0.54
MK 0.26 0.28 0.28 0.30 0.31 0.31 0.32 0.29
RS 0.24 0.23 0.38 0.41 0.36 0.36 0.36 0.33
TR 0.30 0.30 0.29 0.29 0.35 0.35 0.29 0.31
Source: Author’s own calculation
Annex 2: The input innovation indicators (II), for 2010-2016 Input
indicators Country
Years/ Normalized score (min 0 – max 1) Average
2010-2016
2010 2011 2012 2013 2014 2015 2016
II1 EU28 0.63 0.63 0.62 0.63 0.64 0.64 0.62 0.63
MK 0.00 0.04 0.03 0.03 0.03 0.03 0.03 0.03
Serbia 0.65 0.56 0.56 0.59 0.53 0.43 0.50 0.54 Turkey 0.40 0.37 0.37 0.38 0.38 0.40 0.40 0.39
II2 EU28 0.50 0.50 0.44 0.39 0.33 0.32 0.33 0.40
MK 0.00 0.00 0.00 0.00 0.00 0.00 0.00 0.00
RS 0.10 0.10 0.08 0.08 0.00 0.00 0.00 0.05
TR 0.00 0.00 0.00 0.00 0.00 0.00 0.00 0.00
II3 EU28 0.46 0.46 0.48 0.50 0.50 0.50 0.50 0.49
MK 0.01 0.00 0.00 0.00 0.00 0.00 0.00 0.00
RS 0.04 0.02 0.02 0.08 0.03 0.08 0.10 0.05
TR 0.12 0.13 0.14 0.16 0.17 0.19 0.19 0.16
II4 EU28 0.36 0.36 0.28 0.28 0.35 0.35 0.39 0.34
MK 0.47 0.47 0.47 0.47 0.47 0.47 0.47 0.47
RS 0.41 0.41 0.18 0.18 1.00 1.00 1.00 0.60
TR 0.07 0.07 0.07 0.07 1.00 1.00 1.00 0.47
Source: EIS database 2017 available at:
_____________________________
ILIRIA International Review – Vol 8, No 1 (2018)
Annex 2a: The sub-index Input Innovation (II), average 2010-2016
Sub-index Country
Years Average
2010-2016 2010 2011 2012 2013 2014 2015 2016
EU28 0.49 0.49 0.45 0.45 0.45 0.45 0.46 0.46
II MK 0.12 0.13 0.13 0.13 0.13 0.13 0.13 0.13
RS 0.30 0.27 0.21 0.23 0.39 0.38 0.40 0.31
TR 0.15 0.14 0.14 0.15 0.39 0.40 0.40 0.25
Source: author’s calculation
Annex 3: Innovation Efficiency Performance Index (IEPI) 2010-2016
Indexes EU28 MK RS TR
Sub-index OI 2010-2016 0.54 0.29 0.33 0.31
Sub-index II 2010-2016 0.46 0.13 0.31 0.25
IEPI 2010-2016 1.17 2.33 1.06 1.24