69
Journal of Economics and Behavioral Studies (ISSN: 2220-6140) Vol. 8, No. 1, pp. 69-78, February 2016
3D Experiential Marketing in International Industrial Fair
Chao-Chih Hung1, Min-Jiun Su2, *Wen-Long Zhuang3 1Boarke Machine Co., Ltd., Taiwan 2National Chung Hsing University, Taichung
3National Chi Nan University, Taiwan *[email protected]
Abstract: This study explores the effect of buyers’ 3D experiences on their purchase intention, as well as the moderating effect of exhibitors’ corporate image on the above relationship. This study uses the purposive sampling method to survey buyers of the famous International Woodworking Machine Fair in China. Analytical results from 91 visitors are summarized as: the higher the international mechanical fair buyers’ feel experience, think experience and act experience, then the higher their purchase intention; buyers’ relate experience has a negative prediction effect on purchase intention; exhibitors’ corporate image has a moderating effect on the relationship between buyers’ feel experiences and purchase intention; exhibitors’ corporate image has a moderating effect on the relationship between buyers’ relate experience and purchase intention.
Keywords: Experiential Marketing, Purchase Intention, Corporate Image, Exhibitors, Visito
1. Introduction
For many companies, trade shows allow them to economically enter new markets, including global markets and those that are difficult to approach (O’Hara, Palumbo & Herbig, 1993). In addition, trade shows help companies successfully establish integrated marketing communication programs because shows create sales – at least for them (Tanner, 1993). Worth noting is that according to Global Association of the Exhibition Industry, the trade fair industry listed under global marketing activities is largely moving toward Asia (Jin, Bauer & Weber, 2010; Kirchgeorg, Jung & Klante, 2010). Kirchgeorg et al. (2010) stated that the increasing supply and demand of global trade fairs in recent years have made China one of the largest regions for exhibitors. China’s exhibition sessions, floor area, and exhibition income have demonstrated significant growth in recent years.
In important international mechanical fairs, enhancing buyers’ purchase intention should be a top priority for exhibitors. However, the marketing strategies of a corporation cannot focus solely on product functions. They should also consider how to generate interactions with customers so that customers can experience and enjoy the process of co-creation of value (Robinette, Brand & Lenz, 2001). However, since mechanical companies provide diversified products, they are generally not able to showcase all of their products in the show. Also, since mechanical products are often bulky and heavy; the cost of transportation and staffing for exhibitions is high. Coupled with the requirement of a large exhibition area, the booth rental cost could be enormous. Recently, the term has become largely synonymous with interactive three-dimensional (3D) virtual environments, where the users take the form of avatars visible to others graphically (Shin, Biocca & Choo, 2013). Notably, many 3D virtual learning applications have been rapidly developing for a highly interactive, immersive, multi-modal and connected system (Shin et al., 2013). The above issues can be resolved by allowing customers to operate on their products through 3D simulation. If the experience is favorable, customers’ experiences may result in halo effects and then the exhibitors can enhance customers’ purchase intention.
70
consumer marketing (Bendixen, Bukasa & Abratt, 2004; Schuiling & Moss, 2004; Van Riel, Pahud de Mortanges & Streukens, 2005). Companies with fine corporate image can not only maintain permanent and stable relationships with customers, but also simplify customers’ purchase decision and alleviate their concern for quality, thus stimulating purchase (Andreassen & Lindestad, 1998). Thus, from the exhibitor’s standpoint, if buyers have good experiential results after their 3D experience, the exhibitor’s fine corporate image may be able to strengthen the buyers’ purchase intention. Although past studies have discussed the purchase intention in business to consumer (B2C) environment (e.g., Kim & Lennon, 2008; Ku, Kuo & Kuo, 2012; Park, Lennon & Stoel, 2005; Yoon, 2013) and business to business (B2B) environment (Smith, 1998). It seems that research on buyers’ purchase intention in international trade shows is scant (e.g. Gopalakrishna, Lilien, Williams & Sequeira, 1995), and literature related to experiential marketing or corporate image is rare (e.g., Hung, Lee & Zhuang, 2015). According to the above, this study sampled buyers visiting the booth of a Taiwanese exhibitor in a famous China international woodworking machine fair to examine the effect of 3D experiential marketing on buyers’ purchase intention, and the moderating effect of exhibitors’ corporate image on the above relationship.
2. Literature Review
Purchase Intention: Fishbein & Ajzen (1975) considered purchase intention as a subjective inclination toward a product and can be an important index to predict consumer behavior. Dodds, Monroe & Grewal (1991) asserted that purchase intention indicates the likelihood of buying a certain product and that the higher the consumers’ perceived value of the product, then the higher the purchase intention. Morwitz & Schmittlein (1992) proposed that purchase intention can predict actual purchase behavior. Schiffman & Kanuk (2000) asserted that purchase intention is the probability that the consumer will purchase the product; higher probability indicates that consumers are more likely to purchase the product. For international industrial fair exhibitors, the higher the participants’ intention to order, then the higher the cost effectiveness of attending the show.
Experiential Marketing and Purchase Intention: Pine & Gilmore (1998) noted that as the difference between products and services is getting smaller, customers would not only pursue tangible products and services, but also personally participate in the process in order to acquire memorable and valuable experience. This gave birth to the concept of experiential marketing. The concept of experiential marketing was first proposed by Schmitt (1999a), who defined experiential marketing as the customers’ recognition of and purchasing of goods or services from a company or brand after they experience activities and perceive internal and external stimuli, which further trigger motivation, imagination, acceptance, or purchase behavior. Schmitt (1999a) further pointed out that what customers want from the marketing activities is the ability to gain sense, feel, and think experiences so that the brand can be deeply immersed in their everyday lives. Based on the strategic experience model, Schmitt (1999b) divided the types of experiential marketing into five dimensions: feel experience, sense experience, think experience, act experience and relate experience. The main point of feel experience is that feelings and perceptions are consistent, and can generate sensory diversity and feelings of sensation. Sense experience emphasizes that the experience can allow changes to customers’ moods; think experience relates to customers’ consideration of product or service content, as well as the experience of interaction and involvement; action experience refers to changes in the lifestyle and behavior; and relate experience enables consumers’ self-improvement, being perceived positively by others (e.g. colleagues, friends, family, and coworkers) and integrate individual to a social community. In international trade shows, particularly mechanical fairs, exhibitors are generally unable to present all their products due to budget concerns. Therefore, through interactive 3D simulation experience, exhibitors can create outstanding landscapes in terms of sense, feel, think, act, and relate experience.
71
effect as a tendency of raters to treat individuals as generally "rather good or rather inferior, and to color the judgments of the qualities by this general feeling". For buyers of processional mechanical shows, if they can simulate the operation of the machine through 3D experience and gain favorable results, they may treat exhibitors as rather good suppliers and color the judgments exhibitors’ product quality by these favorable experiences. Finally, these buyers will likely purchase from the exhibitor. According to the above, we posit the following hypothesis:
H1: Higher trade show buyers’ 3D experiential result is associated with higher purchase intention.
Moderating Effect of Corporate Image: Corporate image indicates a strong connection between brand image and purchase behavior (Hsieh, Pan & Setiono, 2004). Robertson & Gatignon (1986) stated that corporate image is the symbol of the products or services provided by the enterprise; it can promote consumers’ understanding of certain products and services. Dowling (1988) considered corporate image as a set of beliefs, emotions, and feelings a consumer holds towards the corporation, which is based on the consumer’s understanding, descriptions, and memories about the corporation. Some scholars defined corporate image as the consumer’s attitude of a corporation, and corporate image can help corporations create new beliefs, which would further affect consumers’ attitude toward the products offered and product preference (Homer, 1990; Simmons & Lynch, 1991). Scholars noted that the research of corporate image is very important because it is a form of valuable asset that corporations have to manage (Abratt & Mofokeng, 2001). Similar, exhibitors of international mechanical fair should treat corporate image as an important asset so as to facilitate the sale of their products in the trade show.
In some circumstances, if consumers do not have adequate or related information and the cost of information search is very high, corporate image can provide consumers with an understanding of the purchased product or service and reduce the uncertainty in the their purchase decision (Hastak & Olsen, 1989). According to the view of halo effect (Thorndike, 1920), for trade show buyers, although 3D experience can elevate their purchase intention, but if they perceive exhibitor’s poor corporate image, they may treat exhibitors as rather inferior suppliers and color the judgments exhibitors’ product quality. Finally, these buyers could be unwilling to purchase the exhibitor’s products. In contrast, if the exhibitor has fine corporate image, buyers with good 3D experience may treat exhibitors as rather good suppliers and color the judgments exhibitors’ product quality. Finally, they are very likely to purchase from the exhibitor after or even during the trade show. According to the above, this study proposes the following hypothesis:
H2: Corporate image has a moderating effect on the relationship between 3D experiential marketing and purchase intention.
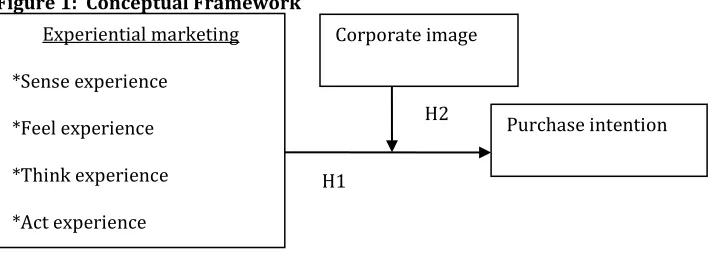
According to the above literature review and hypotheses, the research framework of this study is presented in Figure 1.
Figure 1: Conceptual Framework
3. Methodology
Participants and Sampling Methods: The authors helped the managing director of Taiwan Woodworking Machinery Association who made a subsidy application for a 3D simulation system with Taiwan Ministry of Economic Affairs’ Bureau of Foreign Trade. In a famous China international woodworking machine fair held in 2010, Taiwan Woodworking Machinery Association distributed surveys to visitors of the association’s booth using the purposive sampling method. One hundred and fifty questionnaires were distributed and 103
Purchase intention
H1
H2 Corporate image Experiential marketing
*Sense experience
*Feel experience
*Think experience
*Act experience
72
surveys were returned. After removing invalid surveys, effective survey totaled 91, representing a response rate of 60.67%. Among the 91 respondents, 27.50% had 5-9 years of work experience and 23.10% had 10~14 years of work experience. Most respondents worked in the machine manufacturing industry (35.20%), followed by furniture manufacturing industry at 29.70% and machine sales industry at 19.80%. Most respondents had tenure of 10~15 years (24.20%), followed by 5-9 years (23.10%). In terms of job titles, most respondents were department supervisors (39.60%), followed by business owners (15.40%).
Measures: Details of the operational definitions and measurement tools of the major research variables in this study are provided as follows:
Purchase Intention: This study defines purchase intention as show participants’ purchase intention of exhibited products. Referencing Wang, Li, Barnes & Ahn (2012), this study used 3 items to measure purchase intention: consumer’s intention to buy, other things being equal it was their preferred choice, and their likelihood of purchase. The respondents were requested to indicate on a 7-point Likert scale (1=‘totally disagree’ to 7=‘totally agree’) the degree to which they perceived their purchase intention.
Experiential Marketing: This study defined experiential marketing as: Customers put on 3D glasses and input programmable commands in a 3D computer simulation environment according to their personal needs. From the customers’ perspective, the simulation creates a marketing process, and such process emphasizes the experiential landscape created by customers’ interactive utilization of sense, feel, think, act, and relate experiences. In this study, experiential marketing was measured by Schmitt’s (1999a; 1999b) 5 strategic experiential modules, including sense experience, feel experience, think experience, act experience, and relate experience. Each dimension contained 3 items, or 15 items in total. The items included “3D exhibition contents can attract my eyesight and interest;” “The atmosphere created allows me to feel the advancement and speed of technology;” “I’m more curious about Taiwan woodworking machinery makers' products;” Stimulate new attempts on the production process;” and “Willing to share with my company and coworkers about my thoughts and feelings of this show.” The respondents were requested to indicate on a 7-point Likert scale (1=‘totally disagree’ to 7=‘totally agree’) the degree to which they perceived their experience.
Corporate Image: This study defines corporate image as the symbol of an exhibitor’s product or service that can promote trade show buyers’ understanding of the product of service. Referencing the 5-item inventory developed by Kim & Hyun (2011), we measured corporate image by asking questions like, “Taiwan woodworking machinery makers have advanced manufacturing technologies,” Taiwan woodworking machinery makers have leadership positions,” and “Taiwan woodworking machinery makers have extensive production experience.” The respondents were requested to indicate on a 7-point Likert scale (1=‘totally disagree’ to 7=‘totally agree’) the degree to which they perceived exhibitor’s corporate image.
Control Variables: This study controlled variables like buyers’ work experience, industry, tenure and job title as these factors are considered influential of purchase intention. Reliability and Validity: Both the reliability and the validity of the measures were examined. This work used Cronbach’s α to assess the reliability of the measures. Cronbach’s α was <0.7 and item-total correlation was <0.45. The standards described above were used to delete items. Cronbach’s α was 0.91 for purchase intention, 0.91 for sense experience, 0.82 for feel experience, 0.91 for think experience, 0.85 for act experience, 0.85 for relate experience and 0.88 for corporate image. Each scale demonstrated satisfactory reliability (α exceeding 0.70). In order to minimize the common method variance (CMV) bias, Podsakoff, MacKenzie, Lee & Podsakoff (2003) had suggested the following preventive methods: (1) adding reverse items in the questionnaire, (2) randomly arranging measuring items in the questionnaire, (3) concealing the purpose of the study, and (4) concealing the relationship between questions. Thus, the questionnaire was formulated based on the principles suggested by Podsakoff et al. (2003), including reverse items, random item arrangement, anonymity, and concealing the purpose of the study.
73
for feel experience, 0.77 for think experience, 0.67 for act experience, 0.70 for relate experience and 0.62 for corporate image. Almost all constructs exceeded a suggested critical value of 0.50 (Fornell & Larcker, 1981). The analytical results validated the convergent validity of the constructs. Discriminant validity can be established by demonstrating that the AVE by a particular construct from its indicators is greater than its squared correlation (shared variance) with another construct (Fornell & Larcker, 1981). Each squared phi coefficient between the purchase intention and every other variable was examined. The analytical results indicated that almost each construct’s AVE was greater than its shared variance with purchase intention. The shared variances between purchase intention and sense experience, feel experience, think experience, act experience, relate experience and corporate image were 0.56, 0.70 0.60, 0.86, 0.51 and 0.25, respectively. The analytical results confirmed the discriminant validity of the constructs.
4. Results
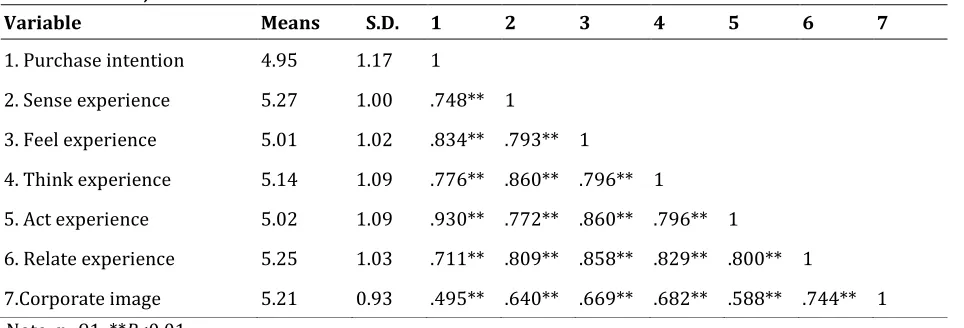
The means, standard deviations, bivariate correlations among the variables are reported in Table 1. In order to prevent the negative impact of multicollinearity, all continuous independent variables were transformed into deviation scores (see Aiken & West, 1991).
Table 1: Means, Standard Deviations and Correlations
Variable Means S.D. 1 2 3 4 5 6 7
1. Purchase intention 4.95 1.17 1
2. Sense experience 5.27 1.00 .748** 1
3. Feel experience 5.01 1.02 .834** .793** 1
4. Think experience 5.14 1.09 .776** .860** .796** 1
5. Act experience 5.02 1.09 .930** .772** .860** .796** 1
6. Relate experience 5.25 1.03 .711** .809** .858** .829** .800** 1
7.Corporate image 5.21 0.93 .495** .640** .669** .682** .588** .744** 1 Note: n=91. **P<0.01.
Table 2: Multiple Regression Analysis of Experiential Marketing for Purchase Intention Dependent
variable
statistics
Independent variables
Purchase intention
Job experience -0.02
Current occupation 0.02
Job tenure -0.04
Job title -0.00
Sense experience 0.09
Feel experience 0.25*
Think experience 0.20*
Act experience 0.76***
Relate experience -0.35**
R2 0.89
74
F 54.49***
Note: all statistical figures are β values; * p<.05, ** p<.01, *** p<.001.
The Effect of Experiential Marketing on Purchase Intention: Hypothesis 1 concerns the relationship between experiential marketing and purchase intention. Table 2 presents the results of multiple regression analyses, with sense experience, feel experience, think experience, act experience and relate experience as independent variable, purchase intention as the dependent variable, and job experience, current occupation, job tenure, and job title as the control variables. Table 2 shows that feel experience, think experience and act experience have positive and significant effect on purchase intention (β=0.25, 0.20 and 0.76 respectively);
relate experience has negative and significant effect on purchase intention (β=-0.35), thus, relate experience failed to predict purchase intention; sense experience failed to predict purchase intention (β=0.09). Therefore, Hypothesis 1 is partially supported.
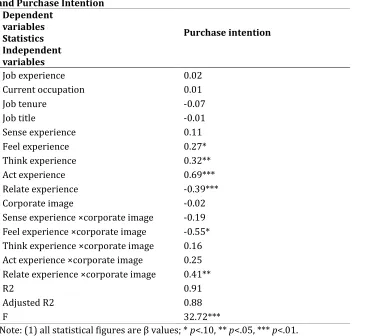
Table 3: Moderating Effect of Corporate Image on the Relationship between Experiential Marketing and Purchase Intention
Dependent variables Statistics Independent variables
Purchase intention
Job experience 0.02
Current occupation 0.01
Job tenure -0.07
Job title -0.01
Sense experience 0.11
Feel experience 0.27*
Think experience 0.32**
Act experience 0.69***
Relate experience -0.39***
Corporate image -0.02
Sense experience ×corporate image -0.19 Feel experience ×corporate image -0.55* Think experience ×corporate image 0.16 Act experience ×corporate image 0.25 Relate experience ×corporate image 0.41**
R2 0.91
Adjusted R2 0.88
F 32.72***
Note: (1) all statistical figures are β values; * p<.10, ** p<.05, *** p<.01.
The Moderating Effect of Corporate Image: Hypothesis 2 concerns whether corporate image moderate the relationship between experiential marketing and purchase intention. To this hypothesis, the current work conducted multiple regression analysis. Table 3 lists regression analysis results, with sense experience, feel experience, think experience, act experience and relate experience as independent variables, purchase intention as the dependent variable, corporate image as moderating variable, job experience, current occupation, job tenure and job title as control variables. Table 3 shows: (1) the interaction between sense experience and corporate image failed to predict purchase intention (β=-0.19); (2) the interaction between feel experience and corporate image significantly predicted purchase intention (β=-0.55); (3) the
75
purchase intention (β=0.41). As such, Hypothesis 2 is partially supported. As shown in Figure 2, when buyers with low feel experience confronted an exhibitor with low corporate image, the buyers’ purchase intention was reduced. In contrast, when buyers with high feel experience confronted an exhibitor with low corporate image, the buyers’ purchase intention was enhanced. When buyers with high feel experience confronted an exhibitor with high corporate image, the buyers’ purchase intention was reduced. In contrast, when buyers with low feel experience confronted an exhibitor with high corporate image, the buyers’ purchase intention was enhanced.
Figure 2: Moderating Effect of Corporate Image on the Relationship between Feel Experience and Purchase Intention
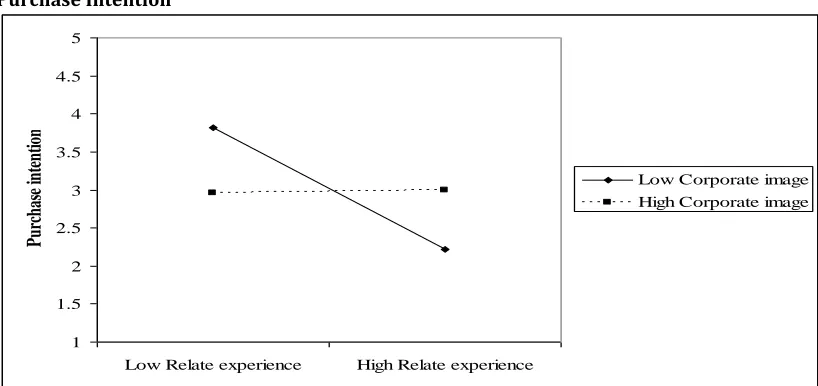
As shown in Figure 3, when buyers with low relate experience confronted an exhibitor with low corporate image, the buyers’ purchase intention was enhanced. In contrast, when buyers with high relate experience confronted an exhibitor with low corporate image, the buyers’ purchase intention was reduced. When buyers with high or low relate experience confronted an exhibitor with high corporate image, the buyers’ purchase intention stayed the same and the result was not significant.
Figure 3: Moderating Effect of Corporate Image on the Relationship between Relate Experience and Purchase Intention
Discussion: The purpose of this study is to examine the effect of computer technology’s experiential marketing on buyers’ purchase intention, and the moderating role of exhibitors’ corporate image. According
1 1.5 2 2.5 3 3.5 4 4.5 5
Low Feel experience High Feel experience
P
ur
ch
as
e i
nt
en
tion
Low Corporate image High Corporate image
1 1.5 2 2.5 3 3.5 4 4.5 5
Low Relate experience High Relate experience
P
ur
ch
as
e i
nt
en
tion
76
to literature review, this study proposed two research hypotheses that were almost fully supported. Because the literature related to experiential marketing is rare (e.g., Hung et al., 2015), the results of this study can make a theoretical contribution to the researches of international trade shows. In terms of practical contribution, the first author of this study is a 26-year veteran of company management and trade show participation. The analytical interpretation and practical implications of this study have high reference value to exhibitors of international mechanical fairs.
5. Conclusion
As expected, international mechanical fair buyers’ feel experience, think experience and act experience have positive effects on their purchase intention; buyers’ relate experience has a negative prediction effect on purchase intention; exhibitors’ corporate image has a moderating effect on the relationship between buyers’ feel experiences and purchase intention; exhibitors’ corporate image has a moderating effect on the relationship between buyers’ relate experience and purchase intention.
Implications for Managerial Practice: As this study predicted, the higher the international mechanical fair buyers’ feel experience, think experience, and act experience, then the higher their purchase intention. The computer 3D simulation provided by the exhibitor influences the buyers’ perception and further impacts their purchase intention. This result is similar to the finding of Dholakia (2000). Therefore, this study suggests international trade fair exhibitors to consider using computer 3D simulation in trade shows because this can facilitate buyers’ feel experience, think experience, and act experience, as well as enhance buyers’ purchase intention.
One surprising result of this research is that buyers’ relate experience has a negative prediction effect on purchase intention. In other words, buyers’ purchase intention is low if they feel that their knowledge of using the machine is elevated after the 3D experience. In contrast, buyers’ purchase intention is enhanced if their knowledge of using the machine is not elevated after the 3D experience. One possible explanation of this result is that if international mechanical fair buyers have potential demand of the product, their background knowledge of the product should be strong. As a result, computer 3D experience is unable to enhance their product knowledge. Eventually, their purchase intention is not enhanced. In contrast, if the buyers’ product knowledge is inadequate, if 3D experience can enhance their knowledge of using the product, and if they have purchase intention, then buyers would eventually choose to purchase the product. Therefore, we suggest the international mechanical fair exhibitor to make a classification of the buyers who visit. For those with inadequate product knowledge, the exhibitor can demonstrate the 3D system and offer timely explanation in order to enhance the buyers’ purchase intention. For those with strong product knowledge, the exhibitor can compromise on the price in order to enhance the possibility of successfully landing the order from the buyers.
77
with high feel experience, the exhibitor can follow-up with the buyers through email or phone after the show in order to enhance the buyers’ purchase intention.
Results of this study show that relative to buyers with high relate experience, buyers with low relate experience have higher purchase intention when confronted with an exhibitor with low corporate image. Also, buyers with high or low relate experience have insignificant purchase intention when confronted with an exhibitor with high corporate image. One possible explanation is that if the buyers have strong product knowledge, the exhibitor’s 3D simulation contents are unable to transcend the effect of physical demonstration. In other words, buyers only want to see the physical demonstration and are not inclined to engage in the 3D simulation experience. Therefore, to deal with buyers with low relate experience, the exhibitor with low corporate image should design 3D simulation contents that closely match the physical demonstration contents and in addition, contact the buyers after the show or make a personal visit to the buyers’ companies in order to enhance the buyers’ purchase intention. To deal with buyers with high or low relate experience, the exhibitor with high corporate image should consider whether or not the buyers’ concern is in the pricing. We suggest that the exhibitor contact the buyers after the show. In addition to lowering the price in the short-term, the exhibitor should also pursue product differentiation and raise corporate image in the long term in order to enhance the buyers’ purchase intention.
Future research direction: This survey was administered in Guangzhou’s International Woodworking Machine Fair. Future studies can focus on other Asian international mechanical fairs, such as those in Taiwan, India, Japan, and Singapore, in order to further explore the effect of 3D experience on buyers’ purchase intention. In addition, this study did not distinguish between the buyers’ nationalities. Since buyers of international mechanical fairs come from different parts of the world, future studies can examine the effect of 3D experience on the purchase intention of buyers from different nations. Lastly, this study limits the research scope to Taiwanese exhibitors. Future studies can expand the research scope to include exhibitors and buyers from different nationalities in order to conduct a comparative analysis of the results with those of this paper.
References
Abratt, R. & Mofokeng T. N. (2001). Development and management of corporate image in South Africa. European Journal of Marketing, 35(3–4), 368–386.
Aiken, L. S. & West, S. G. (1991). Multiple regression: Testing and interpreting interactions. London: Sage. Andreassen, T. W. & Lindestad, B. (1998). The effect of corporate image in the formation of customer loyalty.
Journal of Service Research, 1(1), 82–92.
Bendixen, M., Bukasa, K. A. & Abratt, R. (2004). Brand equity in the business-to-business market. Industrial Marketing Management, 33(5), 371–380.
Dholakia, U. M. (2000). Temptation and resistance: An integrated model of consumption impulse formation and enactment. Psychology & Marketing, 17(11), 955–982.
Dodds, W. B., Monroe, K. B. & Grewal, D. (1991). Effects of price, brand, and store information on buyers’ product evaluations. Journal of Marketing Research, 28(3), 307–319.
Dowling, G. R. (1988). Measuring corporate images: A review of alternative approaches. Journal of Business Research,17(1), 27–34.
Fishbein, M. & Ajzen, I. (1975). Belief, attitude, intention, and behavior: An introduction to theory and research. Massachusetts: Addison-Wesley.
Fornell, C. & Larcker, D. F. (1981). Evaluating structural equation models with unobservable variables and measurement error. Journal of Marketing Research, 18(1), 39–50.
Gopalakrishna, S., Lilien, G. L., Williams, J. D. & Sequeira, I. K. (1995). Do trade shows pay off? Journal of Marketing, 59(3), 75–83.
Hastak, M. & Olson, J. C. (1989). Assessing the role of brand-related cognitive responses as mediators of communication effects on cognitive structure. Journal of Consumer Research,15(4),444–456.
Homer, P. M. (1990). The mediating role of attitude toward the ad: Some additional evidence. Journal of Marketing Research, 27(1), 78–86.
78
Hung, C. C., Lee, C. H. & Zhuang, W. L. (2015). The effect of exhibitors’ brand equity on visitors’ purchase intention: Moderating role of 3D experiential marketing. Information Management and Business Review, 7(2), 100–112.
Jin, X., Bauer, T. & Weber, K. (2010). China’s second-tier cities as exhibition destinations. International Journal of Contemporary Hospitality Management, 22(4), 552–571.
Kim, J. H. & Hyun, Y. J. (2011). A model to investigate the influence of marketing-mix efforts and corporate image on brand equity in the IT software sector. Industrial Marketing Management, 40(3), 424–438. Kim, M. & Lennon, S. (2008). The effects of visual and verbal information on attitudes and purchase intentions
in internet shopping. Psychology & Marketing, 25(2), 146–178.
Kirchgeorg, M., Jung, K. & Klante, O. (2010). The future of trade show: Insights from a scenario analysis. Journal of Business & Industrial Marketing, 25(4), 301–312.
Ku, H. H., Kuo, C. C. & Kuo, T. W. (2012). The effect of scarcity on the purchase intentions of prevention and promotion motivated consumers. Psychology & Marketing, 29(8), 541–548.
Morwitz, V. G. & Schmittlein, D. (1992). Using segmentation to improve sales forecasts based on purchase intent: Which intenders actually buy. Journal of Marketing Research, 29(4), 391–405.
Noble, C. H. & Mokwa, M. P. (1999). Implementing marketing strategies: Developing and testing a managerial theory. Journal of Marketing, 63(4), 57–73.
O’Hara, B., Palumbo, F. & Herbig P. (1993). Industrial trade shows abroad. Industrial Marketing Management, 22(3), 233–237.
Park, J., Lennon, S. J. & Stoel, L. (2005). On-line product presentation: Effects on mood, perceived risk, and purchase intention. Psychology & Marketing, 22(9), 695–719.
Pine, B. J. & Gilmore, J. H. (1998). Welcome to the experience economy. Harvard Business Review, 76(4), 97– 105.
Podsakoff, P. M., MacKenzie, S. B., Lee, J. Y. & Podsakoff, N. P. (2003). Common method biases in behavioral research: A critical review of the literature and recommended remedies. Journal of Applied Psychology,88(5), 879–903.
Robertson, T. S. & Gatignon, H. (1986). Competitive effects on technology diffusion. Journal of Marketing, 50(3), 1-12.
Robinette, S., Brand, C. & Lenz, V. (2001). Emotion marketing: The hallmark way of winning customers for life. New York: McGraw-Hill.
Schiffman, L. G. & Kanuk, L. L. (2000). Consumer Behavior. New Jersey: Prentice-Hall.
Shin, D. H., Biocca, F. & Choo, H. (2013). Exploring the user experience of three-dimensional virtual learning environments. Behavior & Information Technology, 32(2), 203–214.
Schmitt, B. (1999a). Experiential Marketing: How to Get Customers to Sense, Feel, Think, Act, and Relate to Your Company and Brand. New York: The Free Press.
Schmitt, B. (1999b). Experiential marketing. Journal of Marketing Management, 15(1-3), 53–67.
Schuiling, I. & Moss, G. (2004). How different are branding strategies in the pharmaceutical industry and the fast-moving consumer goods sector? Journal of Brand Management, 11(5), 366–380.
Simmons, C. J. & Lynch, J. G. (1991). Inference effects without inference making? Effects of missing information on discounting and use of presented information. Journal of Consumer Research, 17(4), 477–491.
Smith, K. (1998). Service aspects of industrial products lead to future product purchase intentions. Industrial Marketing Management, 27(1), 83–93.
Tanner Jr., J. F. (1993). Leveling the playing field: Factors influencing trade show success for small companies. Industrial Marketing Management, 31(3), 229–239.
Thorndike, E. L. (1920). A constant error in psychological ratings. Journal of Applied Psychology, 4(1), 25–29 Van Riel, A. C. R., Pahud de Mortanges, C. & Streukens, S. (2005). Marketing antecedents of industrial brand
equity: An empirical investigation in specialty chemicals. Industrial Marketing Management, 34(8), 841–847.