IJPAR |Vol.5 | Issue 4 | Oct - Dec -2016
Journal Home page: www.ijpar.com
Review article Open Access
Review on: Statistical designs and response surface methodology (RSM)
as a tool for the optimization of HPLC Methods
Ganna Anitha, Dr. V.P. Pandey
Department of Pharmacy, Annamalai University, Chidambaram, Tamilnadu-608002, India
*Corresponding Author: Ganna Anitha
ABSTRACT
The present paper discusses the basics and exercising response surface methodology (RSM) for the optimization of HPLC methods for separation and quantification of various pharmaceuticals. The Symmetrical experimental designs: Full factorial three level design, Central composite design, Box–Benhken design, Doehlert design and Mixture design are discussed and applications of these techniques for optimization of extraction, Derivitization, quantification and determination of experimental conditions for HPLC separations are presented with recent references. The practice of mixture design for optimization of mobile phases is also summarized.
Keywords
:
Chemometrics; Response surface methodology; Full factorial three level design; Central composite design; Box–Benhken design; Doehlert design; Mixture design; HPLC methods; OptimizationSTATISTICAL DESIGNS
AND
RESPONSE
SURFACE
METHODOLOGY (RSM) AS A TOOL
FOR THE OPTIMIZATION OF HPLC
METHODS
INTRODUCTION
Chemometrics in chromatography is an extremely versatile technique for the analytical laboratory. The patterns generated by modern chromatographic instruments are widely used in a variety of quantitative and qualitative analysis. The term Chemometrics is the art of extracting chemically relevant information from the data produced in chemical experiments is called Chemometrics. However, the reasonable definition of Chemometrics is remains as: How to get the
relevant information out of the measured chemical data, How to represent and display this information, How to get such information into data. [1, 2]
many variables and interactions involved. Accordingly, formal optimization methods are generally preferred by using multivariate statistic techniques. [3, 4]
Box and collaborators in the 50s developed Response surface methodology [5,6]. This term was originated from the graphical perspective generated after fitness of the mathematical model, and its use has been widely adopted in texts on chemometrics. Among the most relevant multivariate methods employed in analytical optimization is response surface methodology (RSM). Response surface methodology is a collection of mathematical and statistical techniques based on the fit of a polynomial equation to the experimental data, which must describe the behavior of a data set with the objective of making statistical previsions. It can be well applied when a response or a set of
responses of interest are influenced by several variables. The objective is to simultaneously optimize the levels of these variables to attain the best system performance. [7]
The most frequently used designs to determine response surfaces are the full and fractional factorial designs, central composite, and Box– Behnken, Doehlert and mixture designs. Even though the factorial designs can be used to determine simple response surfaces that are linear in all of the investigated factors, they are normally used to determine which experimental factors are the most vital to investigate and which factors do not significantly affect the experimental results. Here their use is discussed as a first stage in a multivariate investigation where a linear response surface is determined. For a two-factor case, the response surface is given by the linear model.
(1)
If the response surface is planar the interaction term is insignificant. The more significant the interaction term, the greater is the degree of twisting the planar response surface experiences. If the linear model is not adequate to represent the experimental data sufficiently, more experiments
can be performed in addition to those of factorial design. The central composite design is often formed in this way and its results can be used to determine a quadratic response surface that has curvature and can be used to predict factor levels that produce upper limit or lowest response values.
(2)
The Box–Behnken and Doehlert designs can also be used to identify these kinds of response surfaces and optimize chromatographic factors such as temperature, column characteristics and flow rates. Mixture designs are used to show a discrepancy proportion of mixture ingredients such as the solvent proportions of a mobile phase. They differ from the other designs that optimize intensive properties like temperature or extensive ones like the total quantity of material used in an experiment. Rather than executing experiments that have been planned according to a statistical design, optimization can be done by performing experiments that are indicated by a sequential simplex. The sequential simplex can be useful in certain situations, such as instrument optimization when one is only trying to improve a single response and the experiments are very fast. The simplex algorithm even permits automatic optimization that does not necessarily require user
intervention. However, most problems in chromatography have multiple responses that need to be simultaneously optimized. In this case the simplex procedure is not very efficient. One big advantage of applying the simplex procedure is that the user does not have to understand even basic statistics to do a successful optimization. No decision-making is necessary. After feeding initial factor levels and their proposed changes into the computer, the user simply performs experiments at the factor levels indicated by the simplex algorithm. Three different algorithms can be applied, the basic simplex, the modified simplex and the super-modified simplex. Our aim here is to discuss those methods that are generally more applicable in chromatography. More information about the specialized sequential simplex can be obtained from the publications [8–12].
that will define which experiments should be carried out in the experimental region being studied.
Steps involved in the application of Response
surface methodology as a multivariate
optimization chromatographic technique are
as follows
(1) The selection of independent variables of major effects on the system through screening studies and the delimitation of the experimental region, according to the objective of the study and the experience of the researcher;
(2) The choice of the experimental design and carrying out the experiments according to the selected experimental matrix;
(3) The mathematic–statistical treatment of the obtained experimental data through the fit of a polynomial function;
(4) The evaluation of the model’s fitness;
(5) The verification of the necessity and possibility of performing a displacement in direction to the optimal region; and
(6) Obtaining the optimum values for each studied variable.
This paper describes the application of RSM for optimization in Pharmaceutical analysis and the principal Chemometric tools used for optimization of chromatographic systems: Full three-level factorial, central composite, Box–Behnken, Doehlert and mixture designs [13, 14].
Full three-level factorial designs
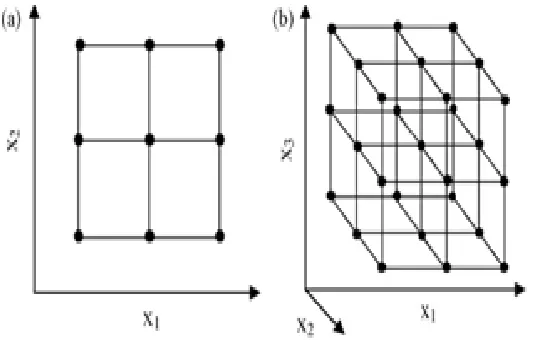
Full three-level factorial design is an experimental matrix that has limited application in RSM when the factor number is higher than 2 because the number of experiments required for this design (calculated by expression N=3k, where N is experiment number and k is factor number) is very large, thereby losing its efficiency in the modeling of quadratic functions. Because a complete three level factorial design for more than two variables requires more experimental runs than can usually be accommodated in practice,
designs that present a smaller number of experimental points, such as the Box–Behnken, central composite, and Doehlert designs, are more often used [15]. However, for two variables, the efficiency is comparable with designs such as central composite [16].
Fig. a and b. shows the representation of the three-level factorial designs for the optimization of two and three variables, respectively.
Central composite design
The central composite design was perceived by Box and Wilson [17]. This design includes the following parts
(1) a full factorial or fractional factorial design;
(2) an additional design, often a star design where experimental points are at a distance from its center; and
(3)
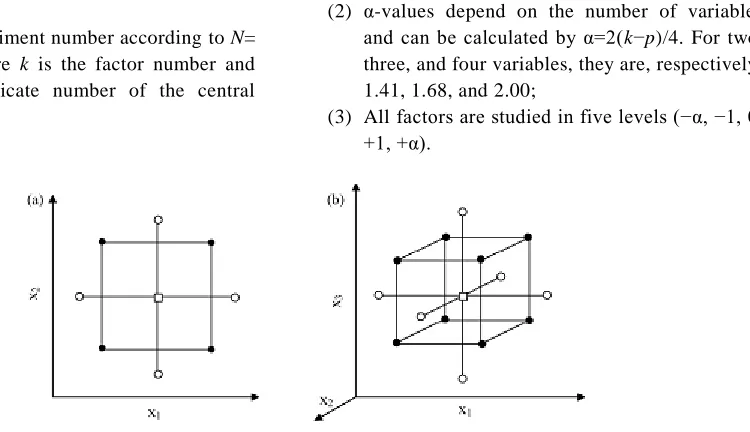
a central point.(1) Require an experiment number according to N= k2 +2k+cp, where k is the factor number and (cp) is the replicate number of the central point;
(2) α-values depend on the number of variables and can be calculated by α=2(k−p)/4. For two, three, and four variables, they are, respectively, 1.41, 1.68, and 2.00;
(3) All factors are studied in five levels (−α, −1, 0, +1, +α).
Fig. a and b. exemplify the full central composite design for optimization of two and three variables.
Table: 1 Ditinct applications of the (CCD) central composite design for optimizing certain conditions for HPLC methods in analytical chemistry
SL. NO
Analytes Sample Adopted
technique
Optimization Result
References
1 Nimodipine and Impurities
Tablets HPLC Robustness
study
18
2 Pantaprazole & Domperidone
Pharmaceutical formulation
HPLC Separation step 19
3 Eprosartan Human plasma HPLC Robustness
study
20
4 Voriconazole Pharmaceutical
formulation
HPLC Separation step 21
5 Amlodipine & Atrovastatin
Pharmaceutical formulation
HPLC Separation step 22
6 1,4-Dihydropyfidines Human plasma HPLC Extraction step 23
7 Antioxidants Low-density
polyethylene
HPLC Extraction step 24
8 Valsartan and its Metabolite
Human plasma HPLC Extraction step 25
9 Additives Polyethylene films HPLC Separation step 26
10 Biogenic amines Red wines HPLC Separation step 27
11 Citalopram, fluoxetine and paroxetine
Plasma and whole blood
HPLC Separation step 28
12 Erythromycin Drugs HPLC Separation step 29
13 Oxy tetracycline and its impurities
Oxy tetracycline base
HPLC Separation step 30
IV Robustness study 15 Carboxylic acids Industrial reaction
mixtures
HPLC Quantification
Step
32
16 Chlorobenzenes Environmental
water
HPLC Extraction step 33
17 Amlodipine, nitrendipine, felodipine, lacidipine and lercanidipine
Human plasma HPLC Extraction step 34
18 Oleuropein Olive’s processing
wastewater andolive leaves extracts
HPLC Separation step 35
19 Amino acid ---- HPLC Separation step 36
20 Tetra nor triterpenoids
“andiroba” oil HPLC Separation Step 37
21 Rosuvastatin, telmisatan, ezitimibe & atorvasatatin
Tablets HPLC Separation step 69
22 Warfarin Tablets HPLC Separation step 70
23 S- Ofloxacin Tablets HPLC Separation step 71
Applications of CCD
By acclimating CCD as a tool to optimize various HPLC methods for the separation of various compounds as follows.Pantoprazole & Domperidone, Voriconazole,Amlodipine& Atorvastatin, Erythromycin, from Pharmaceutical formulations[19,21,22,29] Additives from poly ethelene films[26] Biogenic amines from redwine[27]Citalopram, fluoxetine and paroxetine from plasma and whole blood[28]Oxy tetracycline and its impurities from oxy tetracycline base[30] Sudan dyes From colorant sudanI-IV[31],separation of aminoacids[36] Tetra nor triterpenoids from andiroba oil[37]The Extraction process performed for the determination Antioxidants from low density poly ethylene using HPLC was optimized using CCD[24], 1,4-Dihydropyridines ,Valsartan and its Metabolite, and Amlodipine, nitrendipine, felodipine,acidipineand lercanidipine from human plasma[23,25,34]
oleuropein from Olive’s processing wastewater andolive leaves extracts[35] CCD was used for optimization of a Robustness study in Nimodipine and Impurities in tablets[18]Eprosartan in human plasma[19] Carboxylic acids in Industrial reaction mixtures[32] Chlorobenzenes from environmental water was quantified using HPLC by applyingCCD.Table 1. presents applications of CCD for optimization of chromatographic methods.
Box-Behnken design
Multivariate optimization using BBD
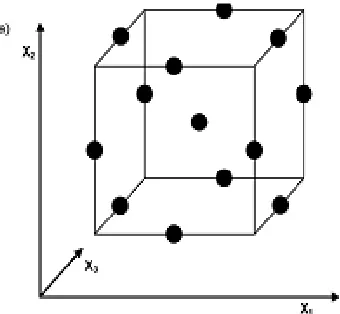
Box-Behnken designs (BBD) [38] are a class of rotatable or nearly rotatable second-order designs based on three-level incomplete factorial designs. For three factors its graphical representation can be viewed in two forms
.
Fig. (a) The cube considering BBD together with three interlocking 22 factorial design
Fig: (b) Figure about three interlocking 22 factorial designs including a central point. The number of experiments (N) mandatory for
the development of BBD is defined as N=2k (k−1) +C0, (where k is number of factors and Co is the number of central points). For comparison, the number of experiments for a central composite design is N=2k +2k +C0. Tables 2,3and4 contain the coded values of the factor levels for BBD on three, four and five factors, respectively. An advantage of the BBD is that it does not contain combinations for which all factors are simultaneously at their highest or lowest levels. So these designs are fruitful in avoiding experiments executed under extreme conditions, for which regrettable results might occur. Conversely, they are not indicated for situations in which we would
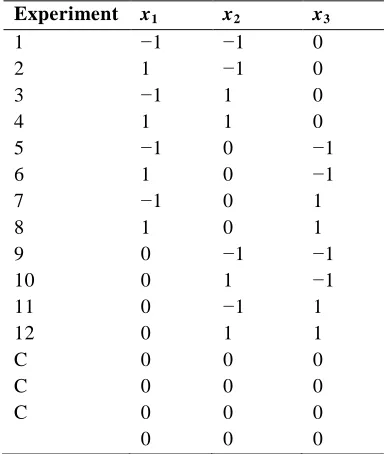
Table 2 Coded factor levels for a Box-Behnken design of a three-variable system Experiment x1 x2 x3
1 −1 −1 0
2 1 −1 0
3 −1 1 0
4 1 1 0
5 −1 0 −1
6 1 0 −1
7 −1 0 1
8 1 0 1
9 0 −1 −1
10 0 1 −1
11 0 −1 1
12 0 1 1
C 0 0 0
C 0 0 0
C 0 0 0
0 0 0
Table 3 Coded factor levels for Box-Behnken designs for optimizations involving four and five factors Four-factor
x1 x2 x3 x4
±1 ±1 0 0
0 0 ±1 ±1
0 0 0 0
±1 0 0 ±1
0 ±1 ±1 0
0 0 0 0
±1 0 ±1 0
0 ±1 0 ±1
0 0 0 0
Table 4 Five-factor
x1 x2 x3 x4 x5
±1 ±1 0 0 0
0 0 ±1 ±1 0
0 ±1 0 0 ±1
±1 0 ±1 0 0
0 0 0 ±1 ±1
0 0 0 0 0
0 ±1 ±1 0 0
±1 0 0 ±1 0
0 0 ±1 0 ±1
0 ±1 0 ±1 0
0 0 0 0 0
Table: 5 APPLICATION OF BOX BEHNKEN
Application of BBD for the optimization of
chromatographic methods
The separation process performed for the determination of Polycyclic aromatic hydrocarbon in Rainfall water with low PAHs content using HPLC was optimized also using BBD[39]
Pyrzynska and coworkers used BBD for optimization of the derivatization reaction established during the development of a method proposed for the determination of aliphatic aldehydes by HPLC [40] The separation process performed for the determination of captopril in pharmaceutical tablets using HPLC was optimized also using BBD [41]
BBD was employed for optimization of a separation procedure for the determination of hydrophilic and hydrophobic components from the Rhizoma Salviae Miltiorrhizae (Danshen)[42].The separation procedure was carried out for the determination of Cajaninstilbene acid (CSA) and pinostrobin (PI) from Pigeonpea leaves using BBD[43]. BBD was applied for optimization of method involving extraction of Organochlorine pesticides from the Sediments [44]. Table 5 bestows applications of BBD for optimization of chromatographic methods.
DOEHLERT DESIGN
The use of multivariate experimental design techniques is becoming increasingly widespread in
HPLC analysis. Multivariate designs, which allow the simultaneous study of several control variables, are faster to implement and more cost-effective than traditional univariate approaches [ 45, 46]. Several experimental design models exist that reduce the number of experiments and that can be used in different cases. Thus, if it is desired to detect influential factors, experimental designs for first-order models (factorial designs or Plackett– Burman designs) can be used.On the other hand, to approximate a response function or to optimize a process, experimental designs for second-order models should be used.The most popular first-order design is the two-level full (or fractional) factorial, in which every factor is experimentally studied at only two levels. Due to their simplicity and relatively low cost, full factorial designs are very useful for preliminary studies or in the initial steps of an optimization,while fractional designs are almost mandatory when the problem involves a large number of factors[ 47]. However,since only two levels are used, the models that can be fit to these designs are somewhat restricted. Consequently,if a more sophisticated model is required, as for the location of an optimum set of experimental conditions, then one must resort to designs for second-order models (response surface designs), which employ more than two factor levels to allow fitting of a full quadratic polynomial. In analytical chemistry, the response surface designs SL.
NO
Analytes Sample Adopted
technique
Optimization Result
References
1 Polycyclic aromatic hydrocarbon
Rainfall water with low PAHs content
HPLC Separation step 39
2 Aliphatic aldehydes Potato crisps HPLC Derivatization
reaction
40
3 Captopril Pharmaceuticals HPLC Separation 41
4 hydrophilic and
hydrophobic components
Rhizoma Salviae Miltiorrhizae (Danshen)
HPLC Separation step 42
5 Cajaninstilbene acid (CSA) and pinostrobin (PI)
Pigeonpea leaves HPLC-DAD Separation step 43
most used are symmetrical and describe a spherical experimental domain.A central composite design (CCD) [48] combines a two-level full or fractional factorial design with additional points (star points) and at least one point at the center of the experimental region, selected to obtain properties such as rotatability or orthogonality, in order to fit quadratic polynomials. For fitting quadratic response models, the CCD is a better alternative to the full factorial three-level design because its performance is comparable at a lower cost. Therefore, it has been the most accepted experimental design for second-order models. The total number of design points needed (N) is determined by the formulaN = 2k+ 2k + C0, where k
is the number of variables and C0 is the number of center points. In analytical chemistry,this design has been widely used.
An alternative and very useful experimental design for second-order models is the uniform shell design proposed by Doehlert in 1970 [ 49]. Doehlert designs are easily applied to optimize variables [50,51]and offer advantages in relation to central composite and Box–Behnken designs. They need fewer experiments, which are more efficient and can move through the experimental domain. Despite these attractive features, however, it took some time until researchers started to take notice of Doehlert designs.In analytical chemistry, the first application of the Doehlert matrix involved the optimization of a separation process using HPLC [ 52].This paper offers a critical discussion of the
different chemometric approaches developed for the optimization of chemical and instrumental variables using Doehlert matrices and the different applications of these experimental designs in HPLC method development.
Doehlert matrices
The Doehlert design describes a spherical experimental domain and it stresses uniformity in space filling. Although this matrix is neither orthogonal nor rotatable, it does not significantly diverge from the required quality for effective use. For two variables, the Doehlert design consists of one central point and six points forming a regular hexagon, and therefore situated on a circle. In three dimensions it can be viewed in different ways, depending on the geometric structure selected [ 53]. In Doehlert designs the number of levels is not the same for all variables. In a two-variable Doehlert design, for example, one variable is studied at five levels while the other is studied at only three levels. This property allows a free choice of the factors to be assigned to a large or a small number of levels. Different criteria can be used to assign the factors. As a general rule, it is preferable to choose the variable with the stronger effect as the factor with five levels in order to obtain most information of the system. Each design is defined considering the number of variables and the coded values (Ci) of the experimental matrix. The relationship between coded and real values is given by
where Ciis the coded value for the level of
factor i, Xi is its real value in an experiment, X0iis
the real value at the center of the experimental domain, ΔXi is the step of variation of the real value and α is the coded value limit for each factor.The number of experiments required (N) is given by N =k2+ k + C0, where k is the number of
variables and C0 is the number of center points.
Replicates at the central level of the variables are performed in order to validate the model by means of an estimate of experimental variance.
The comparison among the second-order designs cited have demonstrated that Doehlert
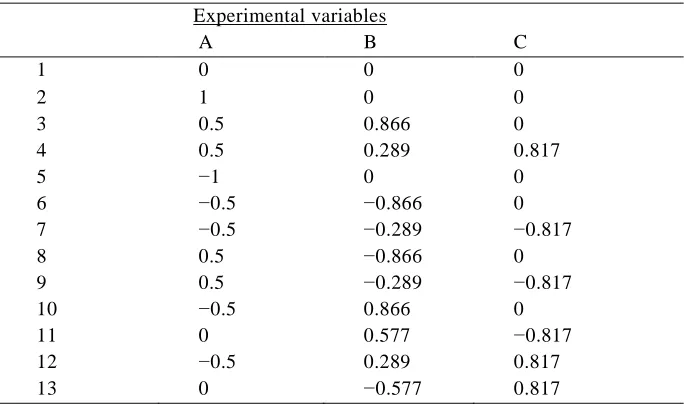
Many of the papers reporting the use of a Doehlert matrix involve the optimization of a process controlled by only two variables, for which seven experiments are required. The coded values of this matrix are given in Table 6. For three variables, the
matrix and its dimensions depend of the geometric structure involved [ 56]. Tables 7–9 contain the coded values of the factor levels for Doehlert designs on three, four and five variables, respectively.
Table 6 Doehlert matrix for two-variables Experimental variables
A B
1 0 0
2 1 0
3 0.5 0.866
4 -1 0
5 -0.5 -0.866
6 0.5 -0.866
7 -0.5 0.866
Table 7 Doehlert matrix for three-variables Experimental variables
A B C
1 0 0 0
2 1 0 0
3 0.5 0.866 0
4 0.5 0.289 0.817
5 −1 0 0
6 −0.5 −0.866 0
7 −0.5 −0.289 −0.817
8 0.5 −0.866 0
9 0.5 −0.289 −0.817
10 −0.5 0.866 0
11 0 0.577 −0.817
12 −0.5 0.289 0.817
13 0 −0.577 0.817
Table 8 Doehlert matrix for four-variables Experimental variables
A B C D
1 0 0 0 0
2 1 0 0 0
3 0.5 0.866 0 0
4 0.5 0.289 0.817 0
5 0.5 0.289 0.204 0.791
6 −1 0 0 0
7 −0.5 −0.866 0 0
8 −0.5 −0.289 −0.817 0
9 −0.5 −0.289 −0.204 −0.791
10 0.5 −0.866 0 0
11 0.5 −0.289 −0.817 0
13 −0.5 0.866 0 0
14 0 0.577 −0.817 0
15 0 0.577 −0.204 −0.791
16 −0.5 0.289 0.817 0
17 0 −0.577 0.817 0
18 0 0 0.613 −0.791
19 −0.5 0.289 0.204 0.791
20 0 −0.577 0.204 0.791
21 0 0 0.791 −0.613
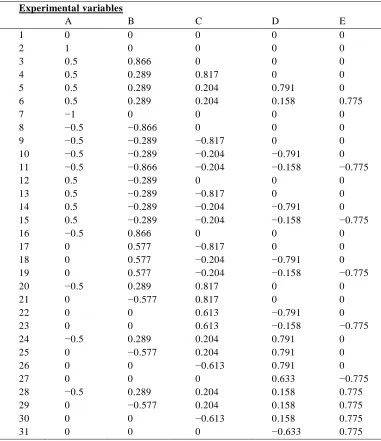
Table 9 Doehlert matrix for five-variables
Experimental variables
A B C D E
1 0 0 0 0 0
2 1 0 0 0 0
3 0.5 0.866 0 0 0
4 0.5 0.289 0.817 0 0
5 0.5 0.289 0.204 0.791 0
6 0.5 0.289 0.204 0.158 0.775
7 −1 0 0 0 0
8 −0.5 −0.866 0 0 0
9 −0.5 −0.289 −0.817 0 0
10 −0.5 −0.289 −0.204 −0.791 0
11 −0.5 −0.866 −0.204 −0.158 −0.775
12 0.5 −0.289 0 0 0
13 0.5 −0.289 −0.817 0 0
14 0.5 −0.289 −0.204 −0.791 0
15 0.5 −0.289 −0.204 −0.158 −0.775
16 −0.5 0.866 0 0 0
17 0 0.577 −0.817 0 0
18 0 0.577 −0.204 −0.791 0
19 0 0.577 −0.204 −0.158 −0.775
20 −0.5 0.289 0.817 0 0
21 0 −0.577 0.817 0 0
22 0 0 0.613 −0.791 0
23 0 0 0.613 −0.158 −0.775
24 −0.5 0.289 0.204 0.791 0
25 0 −0.577 0.204 0.791 0
26 0 0 −0.613 0.791 0
27 0 0 0 0.633 −0.775
28 −0.5 0.289 0.204 0.158 0.775
29 0 −0.577 0.204 0.158 0.775
30 0 0 −0.613 0.158 0.775
Table: 10 APPLICATION OF DOEHLERT DESIGN
Applications of Doehlert design
It was used to optimize the separation of species and to increase the selectivity of the methods. This matrix has been used in the systematic and simultaneous optimization of the gradient solvent system and to optimize instrumental and experimental variables [62] DD was used to optimize the separation of Losartan potassium from capsules using HPLC[57]. DD was used for optimization of method involving extraction of Heterocyclic Aromatic Amines from meat [58].This multivariate optimization was also applied to the derivatization of biogenic amines as dabsyl chloride preceding to the determination by RP-HPLC [59].It has been applied to the analysis of Aromatic compounds from petroleum cuts using HPLC [60]. Cephalothin and its related substances,Methylxanthines, Sodium cefazolin and
related substances were optimized for their separation using HPLC by applying DD.[61,62,64] The separation procedure was carried out for the determination of Mono-, di-, and polyaromatic compounds from Middle distillate using DD[63]. Investigation of the derived sugars with p -nitroaniline using microwave irradiation in a pre-column was performed using DD. [65].Table10 summarizes applications of Doehlert matrix for the optimization of chromatographic methods.
Mixture design
Mixture designs [66] differ from those discussed up to this point since the properties of mixtures depend on ingredient proportions, xi, and not on their absolute values. As such these proportions are not independent variables since q Analytes Sample Adopted
technique
Optimization Result
References
1 Losartan potassium Capsule HPLC Separation step 57
2 Heterocyclic Aromatic Amines Meat HPLC Extraction step 58
3 Biogenic amines - HPLC Derivatization
reaction
59
4 Aromatic compounds Petroleum
cuts
HPLC Separation step 60
5 Cephalothin and its related substances
- HPLC Separation step 61
6 Methylxanthines - HPLC Separation step 62
7 Mono-, di-, and polyaromatic compounds
Middle distillate
HPLC Separation step 63
8 Sodium cefazolin and related substances
- HPLC Separation step 64
As a consequence, mixture models have mathematical expressions that are different from those involving independent variables,
Most noticeably the absence of the constant b0
term. Experimental designs can be made for any number of components but investigation of three-component systems is the most common.
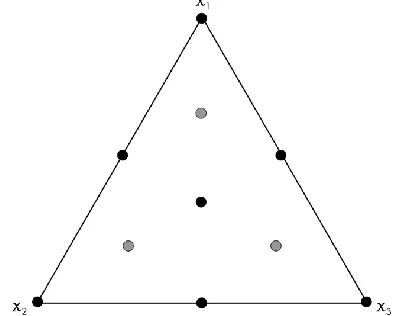
A simplex centroid design with axial points, presented in the concentration triangle shown in Fig. 4, is especially useful for ternary studies. The component proportions of this design are given in the middle columns of Table 11. Each point at a vertex of the triangle represents a pure component or a mixture of components. The points centered on each leg of the triangle represent 1:1 binary mixtures of the components or mixtures of their neighboring vertex points. The point in the center of the triangle represents a 1:1:1 ternary mixture of the three pure components or mixtures represented
at the vertices. The axial points contain a 2/3 portion of one of the ingredients and 1/6 portions of the other two. This simplex centroid with axial point design is important since it permits the evaluation and validation of linear, quadratic and special cubic models. The special cubic model for a ternary system has seven terms. The first three represent the linear model, which is only valid in the absence of interaction effects between components, i.e. ideal solutions in physical chemistry. The next three terms represent synergic or antagonistic binary interaction effects for all possible pairs of components and, along with the linear terms, forms the quadratic model. The last term represents a ternary interaction effect and is usually important for systems having maximum or minimum values in the interior of the concentration triangle. As stated earlier, each vertex can represent a chemical mixture.
Fig: A simplex centroid design with axial points for a three component mixture system.
In this case, the optimization involves investigating mixtures of mixtures. In liquid chromatography, these chemical mixtures and/or pure components can be chosen to have similar chromatographic strengths or other properties that might aid optimization. The example discussed in a later section shows how this can be done. Often it is not of interest or even possible to investigate the entire range of proportion values, 0–100%, of the mixture components. Many mixture optimization
The levels of the mixture components in terms of pseudo components, denoted by xi, are given by the expression which is a kind of variable coding
like we have used for the designs for independent variables.
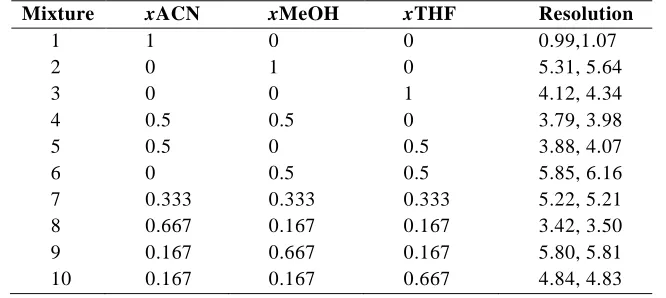
Table 11. Coded pseudo component proportions for mobile phases of a simplex centroid Design with axial points and their resolution factor response values
Mixture xACN xMeOH xTHF Resolution
1 1 0 0 0.99,1.07
2 0 1 0 5.31, 5.64
3 0 0 1 4.12, 4.34
4 0.5 0.5 0 3.79, 3.98
5 0.5 0 0.5 3.88, 4.07
6 0 0.5 0.5 5.85, 6.16
7 0.333 0.333 0.333 5.22, 5.21
8 0.667 0.167 0.167 3.42, 3.50
9 0.167 0.667 0.167 5.80, 5.81
10 0.167 0.167 0.667 4.84, 4.83
Application
of
mixture
design
for
optimization of chromatographic methods
The mixture design was employed for optimization of the mobile phase of an HPLC method proposed for the separation and determination of benzodiazepines: triazolam, de-moxepam,oxazepam, flunitrazepam, nitrazepam, clon-azepam, diazepam,ethyl loflazepate and nordazepam [67].Vuorela and co-workers developed a computer program for the mobile phase optimization of a HPLC method. A desirability function technique combined with the mixture design was employed to enhance the quality of HPLC separations. The use of statistical models to predict the behaviour of retention times (t(R)) and band broadening at the different eluent compositions obtained by prisma methodwas examined for dansyl amides and coumarins [68].
CONCLUSIONS
Multivariate statistical techniques applied to chromatographic methods have been principally employed for optimization of the steps of sample preparation and compound separation. Of the response surface techniques, the Box–Behnken design, the Doehlert matrix and the central composite design, the latter has been the one more frequently used for the optimization of
chromatographic methods. Statistical mixture designs are recommended for the optimization of mobile phase, where the proportions of the components determine chromatographic peak separation and not their total amounts. The two-level full factorial design has often been used for the preliminary evaluation of those experimental factors that are important for the optimization of chromatographic systems.
The Doehlert matrix and The Box-Behnken is a good design for response surface methodology because it permits: (i) estimation of the parameters of the quadratic model, (ii) building of sequential designs, (iii) detection of lack of fit of the model and (iv) use of blocks. Also, the Doehlert design as a chemometric tool presents advantages over other, more used, response surface designs, such as composite central and Box–Behnken. Doehlert designs, despite their relatively scarce diffusion, are amply used in analytical chemistry and other sciences.