I
I
n
n
t
t
e
e
r
r
n
n
a
a
t
t
i
i
o
o
n
n
a
a
l
l
J
J
o
o
u
u
r
r
n
n
a
a
l
l
o
o
f
f
P
P
h
h
a
a
r
r
m
m
a
a
S
S
c
c
i
i
e
e
n
n
c
c
e
e
s
s
Vol. 8, No. 2 (2018): 1914-1923Research Article Open Access
I
ISSSSNN:: 22332200--66881100
RP-HPLC Method Development and Validation for the
Simultaneous Estimation of Darunavir and Cobicistat in
Bulk and Tablet Dosage Form
B. Pavani Venkat*, T.N Purnima, M. Ravinder, R. Komala Shurthi and N. Mahalakshmi
CMR college of Pharmacy, Kandlakoya, Medchal road Hyderabad, 501401, Telangana, India.
* Corresponding author: B. Pavani Venkat, e-mail: [email protected]
ABSTRACT
The proposed study is to develop Accurate, precise, simple and reliable method for the simultaneous estimation of the Darunavir and Cobicistat Tablet Dosage Form. Mobile phase with 40% OPA (0.1%): 60% Acetonitrile was run through Standard Altima C18 (4.6 x 150mm, 5µm) column at a rate of 0.8ml/min. at Temperature 30°C and Optimized wavelength was 210nm. Retention time of 2.000min and 2.497 min and %RSD of 0.1%and 0.3% and %Recovery of 99.31% and 99.59% were obtained for Darunavir and Cobicistat respectively. The Limit of Detection (LOD) and Limit of quantification (LOQ) values obtained from regression equations of Darunavir and Cobicistat were 0.04, 0.12 and 0.14, 0.42 respectively. Regression equation of Darunavir is y =32586.x+5913, and y = 40386.x + 3363 of Cobicistat. Retention times and run time were decreased and the Recovery percentage was high which indicates Accuracy of Method, so the method was precise and reliable which is also economical that can be apt to be adopted in regular Quality control test in Industries.
Keywords: Darunavir, Cobicistat, HPLC.
1. INTRODUCTION
HIV is transmitted through natural liquids, and can be passed from a contaminated individual to a sound individual through unprotected sex and sharing of medication needles. A contaminated mother can likewise pass the infection to her child amid pregnancy, birth, or breastfeeding [1-3].
The evaluated number of individuals living with HIV contamination in Canada in 2011 was 71,300 (territory: 58,600 to 84,000), an expansion of 11.4% from the 2008 gauge of 64,000. In 2013, there were 2,090 episode instances of HIV contamination contrasted and 2,099 out of 2012 and 2,307 out of 2011. This speaks to the least number of new instances of HIV disease since detailing started in 1985. In 2013, men who engaged in sexual relations with men represented 49.3% of all grown-ups (≥ 15 years) having positive HIV test reports containing a known presentation classification, trailed by heteros (29.6%), and infusion sedate clients (12.8%). As in earlier years,
Ontario had the most noteworthy number of episode cases (827) in 2013, trailed by Quebec (453), Alberta (239), British Columbia (272), and Saskatchewan (126). Human immunodeficiency infection (HIV) assaults CD4+ T-cells, segments of the invulnerable framework important for shielding the body against disease. HIV logically debilitates safe reaction and, if left untreated, may prompt (AIDS), the last phase of HIV where a patient can never again ward off diseases and certain. The fundamental goal of the present work is to create and approve Darunavir and Cobicistat (Figure 1 and 2) in Bulk and Tablet Dosage Form [4-8].
Figure 2: Chemical Structure of Cobicistat
2. MATERIALS AND METHODS
2.1 Chemicals and Reagents
Darunavir and Cobicistat pure drugs (API) were obtained from spectrum Pharma research solutions and tablets containing Darunavir 800mg, Cobicistat 150mg (Prezcobix) was purchased from local Pharmacy store. All the chemicals and solvents like Distilled water, Acetonitrile, Phosphate buffer, Methanol, Potassium dihydrogen orthophosphate buffer, Ortho-phosphoric acid are from RANKEM- Mumbai.
2.2 Instruments and Chromatographic Conditions
Electronics Balance-Denver, PH meter -BVK enterprises,
India, Ultrasonicator-BVK enterprises, WATERS HPLC 2695 SYSTEM equipped with quaternary pumps, Photo Diode Array detector and Auto sampler integrated with Empower 2 Software was used for LC peak integration and Data processing.UV-VIS spectrophotometer PG Instruments T60 with special bandwidth of 2mm and 10mm and matched quartz cells integrated with UV-win 6 Software was used for measuring absorbance of Ibuprofen andTramadol solutions. The mobile phase used was40% OPA (0.1%): 60% Acetonitrile was run through Altima C18 (4.6 x 150mm, 5µm)at a rate of 0.8 ml/min. for 10 min at Temperature 30°C and Optimized wavelength was 210nm at the injection volume of 10L.
2.3 Preparation of Solvents and Solution 2.3.1 Diluent
Based up on the solubility of the drugs, diluent was selected, Acetonitrile and Water taken in the ratio of 50:50
2.3.2 Preparation of buffer: Preparation of Buffer: (0.1%OPA)
1ML of Ortho phosphoric acid solution in a 1000ml of volumetric flask add about 100ml of milli-Qwater and final volume make up to 1000 ml with milli-Q water.
Preparation of Standard stock solutions:
Accurately Weighed and transferred working Standards of 3.75mg of Cobicistat and 20 mg of Darunavir into a 25ml clean dry volumetric flask, add 3/4th volume of diluent, solicited for 5 minutes and
make up to the final volume with diluents.
Preparation of Standard working solutions (100% solution):
1ml from the above two stock solution was taken into a 10ml volumetric flask and made up to 10ml.
Preparation of Sample stock solutions:
1tablet was weighed, powdered and then the weight was transferred into a 500mL volumetric flask, 100mL of diluent added and sonicated for 25 min, further the volume made up with diluent and filtered.
From the filtered solution 0.5ml was pipeted out into a 10 ml volumetric flask and made upto 10ml with diluent.
2.4 Method Validation [9-15]
As per ICH guidelines the method was validated and the parameters like Linearity, Specificity, Accuracy, Precision, Limit of Detection (LOD) and Limit of Quantitation (LOQ) were assessed.
2.4.1 Specificity
It is the ability of analytical method to measure the response of the analyte and have no interference from other extraneous components and well resolved peaks are obtained.
2.4.2 Linearity:
Preparation of Standard stock solutions: Accurately
Weighed and transferred working Standards of 3.75 mg of Cobicistat and 20 mg of Darunavir into a 25ml clean dry volumetric flask, add 3/4th volume of diluent, solicited for 5 minutes and make up to the final volume with diluents.
1ml from the above two stock solution was taken into a 10ml volumetric flask and made up to 10ml.
25% Standard solution: 0.25ml each from two
standard stock solutions was pipetted out and made up to 10ml. (3.75µg/ml of Darunavir and 20µg/ml of Cobicistat)
50% Standard solution: 0.5ml each from two
standard stock solutions was pipetted out and made up to 10ml. (7.5µg/ml of Darunavir and 40µg/ml of Cobicistat)
75% Standard solution: 0.75ml each from two
standard stock solutions was pipetted out and made up to 10ml. (11.25µg/ml of Darunavir and 60µg/ml of Cobicistat)
100% Standard solution: 1.0ml each from two
standard stock solutions was pipetted out and made up to 10ml. (15µg/ml of Darunavir and 80µg/ml of Cobicistat)
125% Standard solution: 1.25ml each from two
standard stock solutions was pipetted out and made up to 10ml. (18.75µg/ml of Darunavir and 100µg/ml of Cobicistat)
150% Standard solution: 1.5ml each from two
standard stock solutions was pipettede out and made up to 10ml (22.5µg/ml of Darunavir and 120µg/ml of Cobicistat)
2.4.3 Accuracy:
Preparation of Standard stock solutions: Accurately
solicited for 5 minutes and make up to the final volume with diluents.
1ml from the above two stock solution was taken into a 10ml volumetric flask and made up to 10ml.
Preparation of 50% Spiked Solution: 0.5ml of sample
stock solution was taken into a 10ml volumetric flask, to that 1.0ml from each standard stock solution was pipetted out, and made up to the mark with diluent.
Preparation of 100% Spiked Solution: 1.0ml of
sample stock solution was taken into a 10ml volumetric flask, to that 1.0ml from each standard stock solution was pipetted out, and made up to the mark with diluent.
Preparation of 150% Spiked Solution: 1.5ml of
sample stock solution was taken into a 10ml volumetric flask, to that 1.0ml from each standard stock solution was pipetted out, and made up to the mark with diluent.
Acceptance Criteria:
The % Recovery for each level should be between 98.0 to 102
2.5 Robustness:
Small deliberate changes in method like Flow rate, mobile phase ratio, and temperature are made but there were no recognized change in the result and are within range as per ICH Guide lines.
Robustness conditions like Flow minus (0.7ml/min), Flow plus (0.9ml/min), mobile phase minus(45B:55A), mobile phase plus(35B:65A), temperature minus (25°C) and temperature plus (35°C) was maintained and samples were injected in duplicate manner. System suitability parameters were not much effected and all the parameters were passed. %RSD was within the limit.
LOD sample Preparation: 0.25ml each from two
standard stock solutions was pipetted out and transferred to two separate 10ml volumetric flasks and made up with diluents. From the above solutions 0.1ml each of Darunavir and Cobicistat, solutions respectively were transferred to 10ml volumetric flasks and made up with the same diluents
LOQ sample Preparation: 0.25ml each from two
standard stock solutions was pipetted out and transferred to two separate 10ml volumetric flask and made up with diluent. From the above solutions 0.3ml each of Darunavir and Cobicistat, solutions respectively were transferred to 10ml volumetric flasks and made up with the same diluent.
2.6 System Suitability
By preparing standard solutions of Darunavir (80ppm) and Cobicistat (15ppm) the system suitability parameters were determined the solutions were injected six times and the parameters like peak tailing, resolution and the USP theoretical plate count were assessed to check whether the results complies with Recommended limits.
2.7 Assay of Darunavir and Cobicistat
Prezcobixa Marketed Product bearing the label claim Darunavir 800 mg and Cobicistat 150mg was used to perform assay by utilizing the method developed and under the optimized chromatographic conditions. Sample solutions were injected in to the HPLC system and scanned at 210 nm from which the % of drug was estimated.
3. RESULTS AND DISCUSSION
3.1 Optimization of Chromatographic Conditions
To develop and establish a suitable RP-HPLC method for simultaneous estimation of Darunavir and Cobicistat in bulk and Tablet dosage forms, different preliminary tests were performed and different chromatographic conditions were tested and optimized chromatographic conditions were developed which were given in Table-1. The final analysis was performed by using 40% OPA (0.1%): 60% Acetonitrile at a flow rate of 0.8 ml/min. samples were analyzed at 210 nm detector wave length and at an injection volume of 10 L using Altima C18 (4.6 x 150mm, 5µm) column with run time of 5min. The proposed method was optimized to give sharp peak with good resolution and minimum tailing effect for Darunavir and Cobicistat, the optimized chromatogram was obtained as shown in (Figure-3).
Table-1: Optimized Chromatographic Conditions
Parameter Condition
RP-HPLC WATERS HPLC 2695 SYSTEM equipped with
quaternary pumps with PDA detector
Mobile phase 40% OPA (0.1%): 60% Acetonitrile
Flow rate 0.8 ml/min
Column Altima C18 (4.6 x 150mm, 5µm)
Detector wave length 210 nm
Column temperature 30°C
Injection volume 10L
Run time 5 min
Diluent Water and Acetonitrile in the ratio 50:50
Retention Time Darunavir -2.000 min and Cobicistat -2.497 min
Figure 3: Optimized Chromatogram of Darunavir and Cobicistat
Figure 4: Linearity Curve of Darunavir
Figure 5: Calibration Curve of Cobicistat
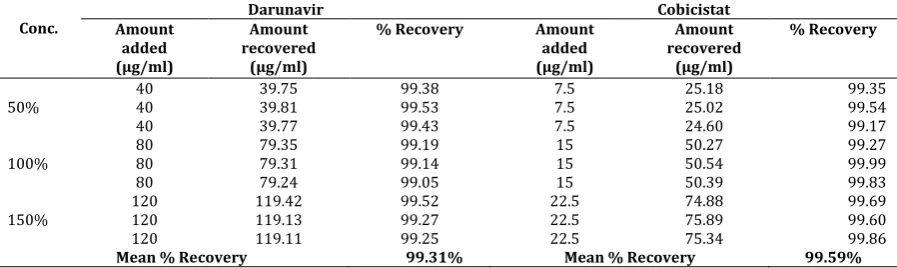
Table-2: Accuracy results of Darunavir and Cobicistat
Conc. Amount Darunavir Cobicistat
added (µg/ml)
Amount recovered
(µg/ml)
% Recovery Amount
added (µg/ml)
Amount recovered
(µg/ml)
% Recovery
50%
40 39.75 99.38 7.5 25.18 99.35
40 39.81 99.53 7.5 25.02 99.54
40 39.77 99.43 7.5 24.60 99.17
100% 80 80 79.35 79.31 99.19 99.14 15 15 50.27 50.54 99.27 99.99
80 79.24 99.05 15 50.39 99.83
150% 120 120 119.42 119.13 99.52 99.27 22.5 22.5 74.88 75.89 99.69 99.60
120 119.11 99.25 22.5 75.34 99.86
Table-3: Precision Results of Darunavir and Cobicistat
S.No Repeatability Intermediate precision
Area of Darunavir Area of Cobicistat Area of Darunavir Area of Cobicistat
1. 2769505 610820 2695809 594760
2. 2767715 610569 2694955 593105
3. 2769741 608652 2692486 599209
4. 2770307 609884 2679303 597876
5. 2765746 613412 2696456 596468
6. 2760662 609583 2686025 598598
Mean 2767279 610487 2690839 596669
S.D 3647.2 1626.1 6814.1 2367.1
%RSD 0.1 0.3 0.3 0.4
3.2 Validation [16-19]
Linearity was established for Darunavir (20-120µg/ml) and Cobicistat (3.75-22.5µg/ml) at six different concentrations each were injected in a duplicates and average areas were determined and linearity equations were obtained as y =32586.x+5913 for Darunavir and 40386.x + 3363 for Cobicistat, Correlation coefficient (R2) was determined as 0.999 for the two drugs. The
Linearity calibration curves were plotted as shown in (Figure-4&5) for Darunavir and Cobicistat respectively. Retention times of Darunavir and Cobicistat were 2.000min and 2.497 min respectively, where no interfering peaks in blank and placebo at retention times of these drugs were not found in this method. So this method holds its specificity. Three levels of Accuracy samples 50%, 100%, 150% were prepared and Triplicates of injections were given for each level of accuracy and mean %Recovery was obtained as 99.31% and 99.59% for Darunavir and Cobicistat respectively were shown in (Table-2). % RSD was calculated from the corresponding peaks obtained by injecting six times a known concentration of Darunavir and Cobicistat the repeatability was obtained as 0.1% and 0.3% respectively for Darunavir and Cobicistat and the % RSD for intermediate Precision was obtained as 0.3%, 0.4% for Darunavir and Cobicistat, Low % RSD values indicates that the method developed was precise
as shown in (Table-3). The LOD and LOQ values were evaluated based on Relative standard deviation of response and slope of the calibration curve Darunavir and Cobicistat. The detection limit values were obtained as 0.04 and 0.14 and Quantitation limit were fund to be 0.12 and 0.42 for Darunavir and Cobicistat Respectively as given in (Table-4).
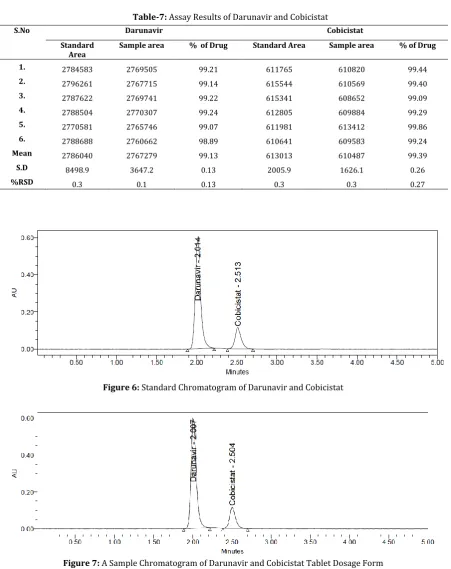
Robustness of the method to study the effect of Robustness conditions like Flow minus 0.7ml/min, Flow plus 0.9 ml/min, mobile phase minus35B:65A, mobile phase plus45B:55A, temperature minus 25°C and temperature plus 35°C was maintained and samples were injected in duplicates. %RSD was within the limit as shown in (Table-5). The system suitability parameters like Retention time, Resolution, USP plate count and peak asymmetry or Tailing evaluated to check whether the results complies the prescribed limits and shown in (Table-6). The assay of the marketed product Nebinex AM bearing the label claim Darunavir 800mg and Cobicistat 150mg was used to perform assay and the Average % of drug was found to be 99.31% and 99.59% for Darunavir and Cobicistat respectively the results were shown in (Table-7) and the chromatograms for Darunavir and Cobicistat standard drugs and Tablet dosage forms were shown in (Figure-6, 7) respectively.
Table-4: LOD and LOQ values of Darunavir and Cobicistat
Molecule LOD LOQ
Darunavir 0.04 0.12
Cobicistat 0.14 0.42
Table-5: Robustness Data of Darunavir and Cobicistat
S.no. Condition %RSD of
Darunavir %RSD of Cobicistat
1 Flow rate (-) 0.9ml/min 0.4 1.4 2 Flow rate (+) 1.1ml/min 1.0 0.2 3 Mobile phase (-) 35B:65A 0.3 1.0 4 Mobile phase (+) 45B:55A 1.7 1.6
5 Temperature (-) 25°C 0.9 1.6
Table-6: System Suitability Parameters Results of Darunavir and Cobicistat
S no Darunavir Cobicistat
Inj RT(min) USP Plate
Count Tailing RT(min) Plate USP
Count
Tailing Resolution
1 2.001 4927 1.23 2.497 5403 1.16 3.8
2 2.000 5063 1.24 2.501 5586 1.19 3.9
3 2.001 5094 1.24 2.503 5625 1.19 3.9
4 2.014 4567 1.20 2.513 5484 1.18 3.7
5 2.014 4791 1.24 2.514 5528 1.16 3.8
6 2.014 4742 1.22 2.516 5387 1.16 3.8
Table-7: Assay Results of Darunavir and Cobicistat
S.No Darunavir Cobicistat
Standard
Area Sample area % of Drug Standard Area Sample area % of Drug
1. 2784583 2769505 99.21 611765 610820 99.44
2. 2796261 2767715 99.14 615544 610569 99.40
3. 2787622 2769741 99.22 615341 608652 99.09
4. 2788504 2770307 99.24 612805 609884 99.29
5. 2770581 2765746 99.07 611981 613412 99.86
6. 2788688 2760662 98.89 610641 609583 99.24
Mean 2786040 2767279 99.13 613013 610487 99.39
S.D 8498.9 3647.2 0.13 2005.9 1626.1 0.26
%RSD 0.3 0.1 0.13 0.3 0.3 0.27
Figure 6: Standard Chromatogram of Darunavir and Cobicistat
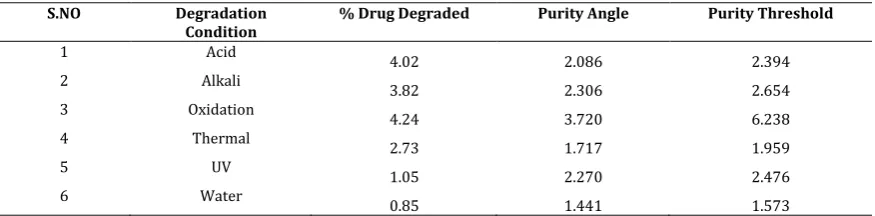
Degradation Studies: Degradation studies were performed with the formulation and the degraded samples were injected. Assay of the injected samples
was calculated and all the samples passed the limits of degradation.
Table 8: Degradation Data of Darunavir
S.NO Degradation
Condition
% Drug Degraded Purity Angle Purity Threshold
1 Acid
4.28 0.229 0.378
2 Alkali 3.53 0.233 0.377
3 Oxidation 4.48 0.305 0.485
4 Thermal
1.89 0.327 0.375
5 UV 1.84 0.262 0.353
6 Water
0.64 0.333 0.428
Table 9: Degradation Data of Cobicistat
S.NO Degradation
Condition
% Drug Degraded Purity Angle Purity Threshold
1 Acid
4.02 2.086 2.394
2 Alkali 3.82 2.306 2.654
3 Oxidation 4.24 3.720 6.238
4 Thermal
2.73 1.717 1.959
5 UV 1.05 2.270 2.476
6 Water
0.85 1.441 1.573
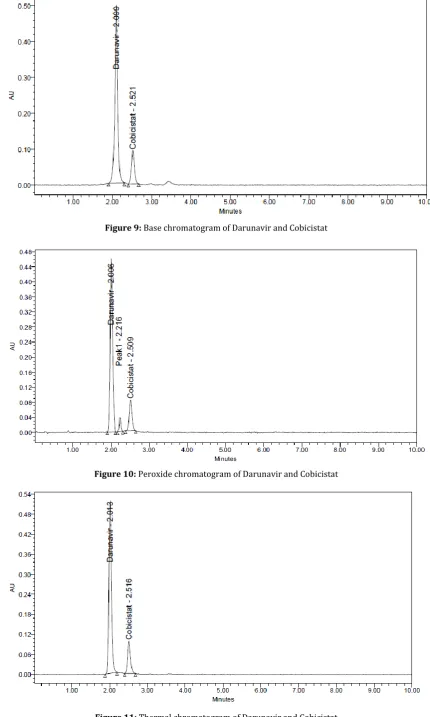
Figure 9: Base chromatogram of Darunavir and Cobicistat
Figure 10: Peroxide chromatogram of Darunavir and Cobicistat
Figure 12: UV chromatogram of Darunavir and Cobicistat
Figure 13: Water chromatogram of Darunavir and Cobicistat
4. CONCLUSION
A new accurate, precise, simple and reliable method for the simultaneous estimation of the Darunavir and Cobicistat in Tablet Dosage Form has been developed. The method developed was validated and was found to be sensitive, accurate, precise and reliable for the analysis of Darunavir and Cobicistat in Bulk and Tablet dosage forms. The Results obtained were within the prescribed limits of ICH Guidelines and shown accuracy and preciseness of the method developed. As the Retention times were decreased and that run time was less the method can be effectively adopted in regular quality control testing in industries which is also economical too. Finally it can be concluded from the results that the method developed was simple and accurate with robust and reliability as added values to the method.
5. REFERENCES
1. https://en.wikipedia.org/wiki/Darunavir
2. http://www.rxlist.com/jardiance-drug/overdosage-contraindications.html
3. http://www.news-medical.net/health/Darunavir-Mechanism.aspx
4. Cheremina O et al., Simultaneous determination of Darunavir and its major metabolite, norDarunavir, in
human plasma by high-performance liquid
chromatography. Biomed Chromatogr 2005;19(10):777-82.
5. Markus g gebauer et al., Stability indicating HPLC method for the estimation of Darunavir and lidocaine in rectal gel. International Journal of Pharmaceutics, volume 223, issues1-2, 2001.
6. Lalit B. Rathod et al., development and validation of a stability indicating rp-hplc method for simultaneous
determination of Cobicistat and Darunavir in
pharmaceutical formulation. IJPSR (2015), Vol. 6, Issue 11. 7. Talebpour Z et al., Determination of Darunavir by a
Identification of its Related Substances by LC-MS/MS Studies.
8. Shaikh Sana et al., Development and Validation of RP-HPLC Method for the Estimation of Cobicistat in Wet Cough Syrup. International Journal of Drug Development & Research. 2012 | Vol. 4 | Issue 2.
9. Janhavi Dabir et al., Analytical Method Development and Validation of RP-HPLC Method for Simultaneous Estimation of N-acetyl cysteine and Cefexime from its Fixed Dose Combination
10. sridhar siddiraju stability indicating rp-hplc method development and validation for the simultaneous estimation of darunavir and cobicistat in pharmaceutical dosage form international conference and exhibition on advances in hplc & chromatography techniques march 14-15, 2016
11. J.Sathish kumar reddy, k.rs. prasad and k. suresh babu A stability indicating rp-hplc method for simultaneous estimation of darunavir and cobicistat in bulk and tablet dosage form der pharmacia lettre, 2016, 8 (12):89-96 12. M,Rama krishna veni, hari babu bollikolla Determination of
darunavir and cobicistat simultaneously using stability indicating rp-hplc method marmara pharmaceutical journal 20(3):293 2016
13. S.h.rizwan, v. girija sastry, shaik gazi, q.imad, khatija mohammed bhameshan. A new and validated stability indicating rp-hplc analysis of darunavir and cobicistat in bulk drug and tablet dosage form int. j. pharm. sci. rev. res., 36(1), january – february 2016; article no. 31, pages: 180-185.
14. Sigamala s. kumar, donthireddy sai priyanka and paul richards m. rp-hplc method development and validation for simultaneous estimation of cobicistat and darunavir in tablet dosage form. world journal of pharmacy and pharmaceutical sciences vol 5, issue 6, 2016.
15. Mathews bommella, r.n.rao, mukkanti khagga, sarbani pal Development and validation of a simple, sensitive, selective and stability-indicating rp-hplc method for the
determination of darunavir and cobicistat in
pharmaceutical combined dosage forms iosr journal of pharmacy and biological sciences. volume 12, issue 4 (2017), pp 69-78
16. Paul richards m, G. V. Chowdary and A. Sunil kumar reddy rp-hplc method development and validation for simultaneous estimation of cobicistat and darunavir in tablet dosage form european journal of biomedical and pharmaceutical sciences
17. G.Sai kiranmaie, p. nagaraju, v. mounika and g. indira priyadarshini development and validation of stability indicating rp-hplc method for simultaneous estimation of darunavir and cobicistat in pharmaceutical dosage form european journal of pharmaceutical and medical research, 2016,3(12), 405-410
18. Nalini, m. venkata siva sri; veni, p. rama krishna; haribabu,
b. determination of darunavir and cobicistat
simultaneously using stability indicating rp-hplc method. marmara pharmaceutical journal . 2016, vol. 20 issue 3, p293-302.
19. S.Madhavi, A. prameela rani Development and validation of rp-uplc method for simultaneous estimation of cobicistat and darunavir, research j. pharm. and tech 2017; 10(12): 4343-4349.
*****