R E S E A R C H
Open Access
Active eukaryotes in drinking water
distribution systems of ground and
surface waterworks
Jenni Inkinen
1,2*, Balamuralikrishna Jayaprakash
1, Sallamaari Siponen
1,3, Anna-Maria Hokajärvi
1, Anna Pursiainen
1,
Jenni Ikonen
1, Ivan Ryzhikov
3, Martin Täubel
1, Ari Kauppinen
1, Jussi Paananen
2, Ilkka T. Miettinen
1, Eila Torvinen
3,
Mikko Kolehmainen
3and Tarja Pitkänen
1Abstract
Background:Eukaryotes are ubiquitous in natural environments such as soil and freshwater. Little is known of their presence in drinking water distribution systems (DWDSs) or of the environmental conditions that affect their activity and survival.
Methods:Eukaryotes were characterized by Illumina high-throughput sequencing targeting 18S rRNA gene (DNA) that estimates the total community and the 18S rRNA gene transcript (RNA) that is more representative of the active part of the community. DWDS cold water (N= 124), hot water (N= 40), and biofilm (N= 16) samples were collected from four cities in Finland. The sampled DWDSs were from two waterworks A–B with non-disinfected, recharged groundwater as source water and from three waterworks utilizing chlorinated water (two DWDSs of surface waterworks C–D and one of ground waterworks E). In each DWDS, samples were collected from three locations during four seasons of 1 year.
Results:A beta-diversity analysis revealed that the main driver shaping the eukaryotic communities was the DWDS (A–E) (R = 0.73, P < 0.001, ANOSIM). The kingdoms Chloroplastida (green plants and algae), Metazoa (animals: rotifers, nematodes), Fungi(e.g., Cryptomycota), Alveolata (ciliates, dinoflagellates), and Stramenopiles (algae
Ochrophyta) were well represented and active—judging based on the rRNA gene transcripts—depending on
the surrounding conditions. The unchlorinated cold water of systems (A–B) contained a higher estimated total number of taxa (Chao1, average 380–480) than chlorinated cold water in systems C–E (Chao1 ≤210). Within each DWDS, unique eukaryotic communities were identified at different locations as was the case also for cold water, hot water, and biofilms. A season did not have a consistent impact on the eukaryotic community among DWDSs.
Conclusions: This study comprehensively characterized the eukaryotic community members within the DWDS of well-maintained ground and surface waterworks providing good quality water. The study gives an indication that each DWDS houses a unique eukaryotic community, mainly dependent on the raw water source and water treatment processes in place at the corresponding waterworks. In particular, disinfection as well as hot water temperature seemed to represent a strong selection pressure that controlled the number of active eukaryotic species.
Keywords:18S rRNA, Eukaryotic communities, Drinking water distribution system, Active biota members, Disinfection, Hot water systems, Biofilms
© The Author(s). 2019Open AccessThis article is distributed under the terms of the Creative Commons Attribution 4.0 International License (http://creativecommons.org/licenses/by/4.0/), which permits unrestricted use, distribution, and reproduction in any medium, provided you give appropriate credit to the original author(s) and the source, provide a link to the Creative Commons license, and indicate if changes were made. The Creative Commons Public Domain Dedication waiver (http://creativecommons.org/publicdomain/zero/1.0/) applies to the data made available in this article, unless otherwise stated. * Correspondence:[email protected]
1
Department of Health Security, National Institute for Health and Welfare, P.O. Box 95, FI-70701 Kuopio, Finland
2Institute of Biomedicine, University of Eastern Finland, P.O. Box 1627, FI-70211 Kuopio, Finland
Background
The water treatment processes, geographical location, pipeline material, raw water type, operational condi-tions, and water physico-chemical quality shape the mi-crobial communities in drinking water distribution systems (DWDSs) [1–4]. Surprisingly, little information is available about eukaryotic communities in DWDS, impeding sound understanding of the dynamics in DWDS, as co-occurrences such as win-loss interactions (i.e., predator-prey and parasite-host relationships) as well as win-win relationships occur [5]. While diver-sities of the bacterial and eukaryotic communities have been shown to decline considerably after water treat-ment processes [6,7], some members of the eukaryotic community such as amoebae can survive conventional treatments [6,8,9].
It is known that some pathogenic amoebae, entero-pathogens, and fungi occur in freshwaters [9–11]. Free-living amoebae (FLA) are of specific interest since they
can act as human pathogens (e.g., Acanthamoeba spp.,
Vermamoeba vermiformis, Balamuthia mandrillaris) or serve as hosts for pathogenic microorganisms such as Legionella spp. and Mycobacterium spp. [12–14]. Fungi in drinking water could be a concern due to the ability of some taxa to produce mycotoxins, although it seems that they are mainly associated with taste or odor prob-lems [15–17]. Invertebrates in aquatic environments may be useful as they can act as predators of microor-ganisms or contribute to nutrient recycling, especially in water treatment plant filters [6,18].
The microbial community studies targeting the rRNA genes (DNA) produce taxonomic information including signals from active, dormant, and dead community members. The use of ribosomal rRNA gene transcripts (RNA) has been utilized in previous DWDS studies to differentiate the signals from dead cells and environ-mental DNA from active and dormant bacterial
com-munity members [3, 4]. Further, DNA/RNA library
comparisons have been utilized for eukaryotic commu-nity characterization in marine [19] and freshwater
en-vironments [20]. The objective of this study was to
characterize the active or dormant eukaryotic members (analyzed by 18S ribosomal RNA transcript, i.e., rRNA) in comparison with total eukaryotic members (analyzed by 18S ribosomal DNA gene, i.e., rDNA) in DWDS lo-cated in different parts of Finland. We aimed to under-stand the effect of the sampling location, season, and differences between cold water, hot water, and biofilms on the communities within each DWDS. Furthermore, the role of environmental conditions, i.e., geographic location/DWDS, source water type, water treatment process, and disinfection treatment, in shaping the eukaryotic communities, including the occurrence of potentially pathogenic members, was investigated.
Methods
DWDS characteristics and sampling
The water samples and biofilm samples were collected from five DWDSs (A–E) from four cities in Eastern and Southern Finland as previously described [21]. DWDSs A–B were located in the same city, and these two water-works both employed artificial groundwater recharge as a water treatment process. All waterworks were consid-ered as well-maintained and produced good-quality drinking water.
The experimental design for sample collection shown as a chart in Additional file1 included cold water from three different locations (N = 120), hot water from one location (N= 40), and water meter biofilms, i.e., soft de-posit samples and pipeline biofilms (N = 16). The hot water samples originated from warm water systems of buildings heating the drinking water mainly for washing purposes. In each sampling season, water samples in two
consecutive weeks per DWDS (A–E) were taken
result-ing eight water samples per samplresult-ing location with the
exception of two failed samples of DWDS C (Table 1).
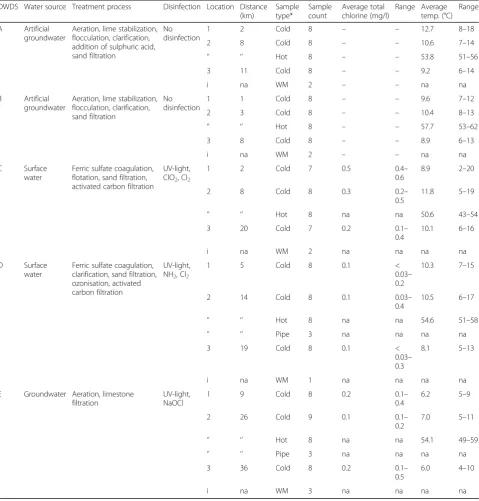
Temperatures and total chlorine concentration at each sampling location are described in Table 1. Other mea-sured physico-chemical water quality parameters and concentrations of microbially available nutrients in cold and hot water in each DWDS are summarized in Add-itional file2: Tables S1–S2, respectively.
A 1% solution of sodium thiosulphate (18 mg/ml Na2S2O3·5H2O) was added to the water and biofilm samples from chlorinated systems to bind chlorine and prevent residual disinfection after sampling. Before the backflush, excess water was removed by pumping air through a DEUF capsule. Backflush was performed with
500 ml of backflush solution (0.5% Tween 80, 0.01% so-dium polyphosphate, and 0.001% Y-30 antifoam emul-sion; Sigma-Aldrich and Merck, Darmstadt, Germany) as described in [22] except that a platinum-cured silicon tube (Watson-Marlow Limited, Falmouth, UK) was used to help the collection of DEUF eluate of an average 550
Table 1The sampling locations and characteristics of the samples collected from five DWDSs (A–E). Water samples in each location were collected in four seasons: winter (January to February), spring (March to May), summer (August to September), and autumn (October to December) in two consecutive weeks
DWDS Water source Treatment process Disinfection Location Distance (km)
Sample type*
Sample count
Average total chlorine (mg/l)
Range Average temp. (°C)
Range
A Artificial groundwater
Aeration, lime stabilization, flocculation, clarification, addition of sulphuric acid, sand filtration
No disinfection
1 2 Cold 8 – – 12.7 8–18
2 8 Cold 8 – – 10.6 7–14
‘’ ‘’ Hot 8 – – 53.8 51–56
3 11 Cold 8 – – 9.2 6–14
i na WM 2 – – na na
B Artificial groundwater
Aeration, lime stabilization, flocculation, clarification, sand filtration
No disinfection
1 1 Cold 8 – – 9.6 7–12
2 3 Cold 8 – – 10.4 8–13
‘’ ‘’ Hot 8 – – 57.7 53–62
3 8 Cold 8 – – 8.9 6–13
i na WM 2 – – na na
C Surface water
Ferric sulfate coagulation, flotation, sand filtration, activated carbon filtration
UV-light, ClO2, Cl2
1 2 Cold 7 0.5 0.4–
0.6
8.9 2–20
2 8 Cold 8 0.3 0.2–
0.5
11.8 5–19
‘’ ‘’ Hot 8 na na 50.6 43–54
3 20 Cold 7 0.2 0.1–
0.4
10.1 6–16
i na WM 2 na na na na
D Surface water
Ferric sulfate coagulation, clarification, sand filtration, ozonisation, activated carbon filtration
UV-light, NH2, Cl2
1 5 Cold 8 0.1 <
0.03– 0.2
10.3 7–15
2 14 Cold 8 0.1 0.03–
0.4
10.5 6–17
‘’ ‘’ Hot 8 na na 54.6 51–58
‘’ ‘’ Pipe 3 na na na na
3 19 Cold 8 0.1 <
0.03– 0.3
8.1 5–13
i na WM 1 na na na na
E Groundwater Aeration, limestone filtration
UV-light, NaOCl
1 9 Cold 8 0.2 0.1–
0.4
6.2 5–9
2 26 Cold 9 0.1 0.1–
0.2
7.0 5–11
‘’ ‘’ Hot 8 na na 54.1 49–59
‘’ ‘’ Pipe 3 na na na na
3 36 Cold 8 0.2 0.1–
0.5
6.0 4–10
i na WM 3 na na na na
ml (350–580 ml). The secondary concentration of DEUF eluates of an average 75 ml (range 65–145 ml) and centration of biofilm suspensions of 10 ml was con-ducted by filtration through a polycarbonate membrane
(pore size 0.4μm, Nuclepore Polycarbonate, Whatman,
Kent, UK). Water samples corresponded to the calcu-lated original water volume which was on average of
13.6 l (7.7–25.4 l). The membranes were frozen at −
75 °C or lower before the extraction of nucleic acids.
DNA and RNA extraction and PCR amplification
Nucleic acids (NAs) were extracted from polycarbonate membranes with Chemagic DNA Plant kit (Perkin Elmer, Waltham, MA, USA) according to the manufac-turer’s instructions except that RNA was not removed.
Cells were lysed with a buffer and acid-washed 212–
300μm glass beads (Sigma-Aldrich, MO, USA) using a
Bead Beater device (BioSpec Products, Inc., Bartlesville, OK, USA) for 1 min at full speed. Nucleic acids were ex-tracted to an elution volume of 100μl using a Kingfisher device (Thermo Fisher Scientific, Waltham, MA, USA).
RNA was purified from 30μl subsample of NAs with
Ambion TURBO DNA-freeTM kit (Life Technologies,
Carlsbad, CA, USA). Purified RNA was transcribed to
complementary DNA (cDNA) using InvitrogenTM
Superscript III First-Strand Synthesis System (Thermo Fisher Scientific, Waltham, MA, USA). From all sam-ples, the NAs were used such as the DNA fraction, and the produced cDNA represented the RNA fraction.
DNA and RNA concentrations (ng/μl) from extracts
were measured with a Qubit minifluorometer using Qubit dsDNA HS Assay and Qubit RNA HS Assay kits (Thermo Fisher Scientific, Waltham, MA, USA). NAs
and RNA were stored at −75 °C and cDNA at −20 °C
prior to sending to LGC Genomics (LGC Genomics GmbH, Berlin, Germany) for further analyses.
Tagged amplicon PCR prior Illumina sequencing was performed using barcoded primers. The PCRs included about 1–10 ng of NAs where the total volume was 1μl. In addition, 15 pmol of each forward primer and reverse primer was used (in 20μl: 1× MyTaq buffer containing
1.5 units MyTaq DNA polymerase (Bioline) and 2μl of
BioStabII PCR Enhancer (Sigma)). The eukaryotic primers Eu565F-Eu981R [23] targeting the highly vari-able V4 region of the 18S rRNA gene were used for PCR amplification (LGC Genomics GmbH, Berlin, Germany). PCR was performed with 30 cycles (including 2 min 96 °C pre-denaturation; 96 °C for 15 s, 50 °C for 30 s, 70 °C for 90 s). PCR amplicon DNA concentrations were checked by gel electrophoresis. Each DNA sample (approx. 20 ng amplicon DNA) was pooled for up to 48 samples carrying different barcodes. If low yields were found in PCR, the corresponding sample was further amplified for 5 cycles. The amplicon pools were purified
to remove the primer dimers and other small misprim-ing products with AMPure XP beads (Agencourt) that were followed by an additional purification on MinElute columns (Qiagen). About 100 ng of each purified ampli-con pool was used to ampli-construct Illumina libraries using the Ovation Rapid DR Multiplex System 1-96 (NuGEN). Preparative gel electrophoresis was used for Illumina library pooling and size selection. The forward and reverse primers had the same 10 nucleotide barcode se-quence in each sample.
Amplicon sequencing and bioinformatics
Sequencing was performed on an Illumina MiSeq (V3 Chemistry) with 300 bp paired-end reads (Illumina, Inc., San Diego, CA, USA). The libraries were demultiplexed, and barcodes, amplicon primer sequences, and adapter sequences were removed. Reads shorter than 100 bp were discarded. Amplicon reads were processed and an-alyzed using Quantitative Insights Into Microbial Ecol-ogy (QIIME) software [24] version 1.9.1. Quality control for the 18S rRNA gene sequences was performed using
Cutadapt [25] to remove adapters. Bad-quality reads
were removed with Trimmomatic [26]. The remaining
read pairs were joined using Flash2 software [27]. The reads were checked for chimeras with the vsearch algo-rithm [28]. The reads were clustered at 97% (uclust) into operational taxonomic units (OTUs). The OTU picking step was performed with the open reference OTU
picking approach using SILVA SSU database (https://
www.arb-silva.de) 128 release [29]. Sequence processing of the samples included negative (N = 35) and positive
(N = 10) controls. From each control, both rDNA and
rRNA libraries were analyzed. Negative controls were taken from each sample processing step of water and biofilms and were used to inform the definition of mini-mum read counts for a sample to be included in the analysis. In-house bacterial and fungal mocks were used as positive controls. One negative filter control (but not samples or other controls) was contaminated with OTU GAZW01284385.3.1621, and this OTU was removed from the dataset prior to analyses. Some of the other negative controls included low read counts of other OTUs (total read count ≤2752), and thus, the total read count of the following actual sample (2873) was used as the alpha-rarefaction value. The few OTUs that occurred in negative controls were not removed from the samples due to low amounts in samples.
Data analyses
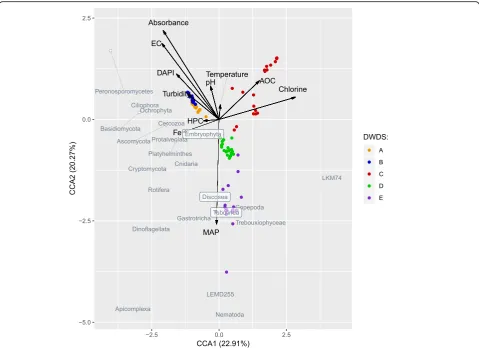
metrics. Beta-diversity differences between the samples were displayed by non-metric multidimensional scaling (NMDS) plot in R Version 3.4.2 in the ggplot2 package [30]. Canonical correspondence analysis (CCA) was used to explain the total and active eukaryotic communities and representative taxa by physico-chemical parameters, i.e., temperature; pH; turbidity; absorbance 254 nm; elec-tric conductivity (EC); iron (Fe) concentration; total chlorine; microbially available nutrients, i.e., AOC; MAP; and microbiological water quality parameters, i.e., total cell count (DAPI) and heterotrophic plate count (HPC).
The differences in rDNA and rRNA libraries, i.e., the activity of eukaryotic members, were visualized in a heatmap clustering analysis in the MicrobiomeAnalyst program [31]. First, a combined OTU table was prepared for the samples (N= 126) that had successfully produced reads from both rRNA and rDNA libraries. Relative ac-tivity recovery (%) for each OTU was determined by subtracting the relative abundance of DNA from the
relative abundance of RNA (RNA%−DNA%). Recovery
values ranged from −100 to 100% in which the taxon
was considered active if the rRNA relative recovery was greater than its recovery from rDNA [20]. The relative recovery OTU table at rank D4 to D6 level was filtered by variance (standard deviation filtering 70%) to select
only the OTUs (N= 521 OTUs) that displayed the most
variation in activity recovery and between the samples of the entire dataset. In addition, clustering analysis was performed separately for the most abundant kingdoms using the entire dataset without filtering to capture all OTUs. The figures of the heatmap clustering analysis in-cluded scaling by rows, i.e., per taxon in the entire data-set, clustering was based on a default Euclidean distance and Ward clustering methods.
Statistical analysis
Analysis of similarity (ANOSIM) for NMDS plots was performed in QIIME and in MicrobiomeAnalyst. In QIIME, the script compare.categories.py was used for analyzing the differences in the entire datasets between the DWDSs (Bray-Jaccard and Bray-Curtis). Within each DWDS, the analysis of beta-diversity (Bray-Curtis) was conducted for DNA and RNA separately to investigate the (1) differences between RNA/DNA in each DWDS (all samples), (2) effect of season and location only from cold water samples, and (3) differences between cold and hot water (location 2 only). IBM SPSS Statistics 25 (IBM Corporation, USA) was used for the statistical ana-lyses of alpha-diversities. The effect of season and sam-pling location to alpha-diversities was tested using
non-parametric Kruskal-Wallis test or Mann-Whitney Utest
(RNA/DNA) within each DWDS and all DWDSs in cold water (four seasons, three sampling locations). The ef-fects of sample type to alpha-diversities in the entire
dataset and within DWDS were tested with the Kruskal-Wallis test. Significance level P = 0.05 was used in all statistical analyses.
Results
Eukaryotic community characterization and differences between DWDSs
Overall, the 140 rDNA and 146 rRNA libraries repre-senting total and active eukaryotic communities, respect-ively, resulted in 2.6 rDNA and 4.0 million rRNA amplicon reads (Additional file 3: Table S3). A total of 40 rDNA and 34 rRNA samples originating mostly from DWDS E (both cold and hot water) produced libraries with low read counts, which were excluded from the analysis.
The samples were clustered for DWDSs A–E. All sam-ples originating from DWDSs A and B clustered close to each other in both unweighted and weighted non-metric multidimensional scaling plots (NMDS) (Fig. 1a, b), i.e., the beta-diversity of eukaryotic communities at
non-disinfected DWDS samples was similar. DWDSs C–E
clustered more clearly apart from each other in the NMDS plots, reflecting a certain level of uniqueness of all disinfected DWDSs. This was evident also in the dif-ferences in the relative abundance of the eukaryotic
kingdoms in the different DWDSs (Fig. 1c). Alveolata
dominated in DWDSs A and B, Chloroplastida in
DWDS C,Fungiin DWDS D, andMetazoain DWDS E.
A high abundance (20–41%) of unassigned OTUs was
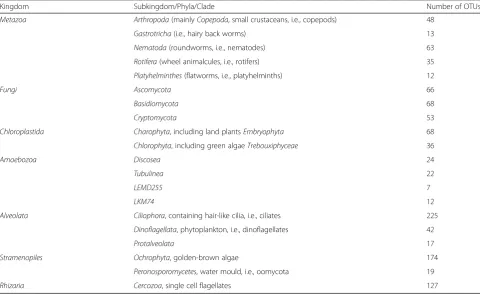
present in all DWDSs resulting in a total of 711 OTUs (Fig.1c). The entire eukaryotic dataset consisted of 2136 OTUs that distributed into taxonomic groups mainly in seven kingdoms as presented in Table2.
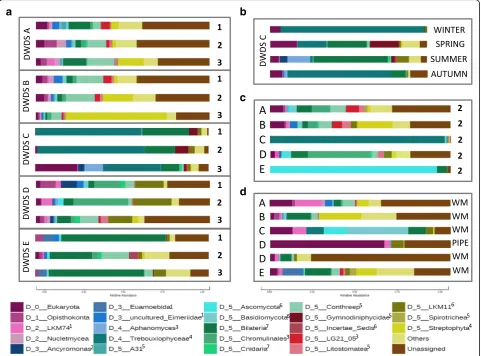
An analysis of eukaryotic taxa characterized to rank level D5 confirmed similar taxa profiles in DWDSs A and B, while DWDSs C–E each displayed unique taxa profiles in both RNA (Fig.2) and DNA analyses (Additional file4: Figure S1). In DWDSs A and B, the high occurrence of Alveolata consisted of ciliate class Intramacronucleata (order Conthreep) and Perkinsidae class (order A31). In
DWDS C, green algaeTrebouxiophyceaeclass was mostly
responsible for the high abundance ofChloroplastida. In
DWDS D, the high abundance ofFungiconsisted mainly
of subphylum LKM11 ofCryptomycotaphylum, and there
was also a high abundance of golden-brown algae order Chromulinales (Ochrophyta). The abundantMetazoa oc-currence in DWDS E included nematodes but also rotifers and copepods. A more detailed analysis of the most abundant top 50 OTUs in each DWDS is presented in Additional file5: Tables S4–S8.
Alpha- and beta-diversities revealed the differences in
DWDSs A–B when compared to DWDSs C–E, most
a
c
b
Fig. 1Eukaryotic community characteristics of the drinking water distribution system samples. NMDS plot ofaunweighted binary Jaccard (ANOSIMr= 0.73,P< 0.001) andbweighted Bray-Curtis (ANOSIMr= 0.73,P< 0.001) beta-diversities andcrepresentative kingdoms within DWDSs A–E. Number of OTUs within each kingdom in brackets, *Discoba,Malawimonas,Haptophyta
Table 2The number of OTUs in the most abundant taxonomic groups identified from the DWDSs
Kingdom Subkingdom/Phyla/Clade Number of OTUs
Metazoa Arthropoda(mainlyCopepoda, small crustaceans, i.e., copepods) 48
Gastrotricha(i.e., hairy back worms) 13
Nematoda(roundworms, i.e., nematodes) 63
Rotifera(wheel animalcules, i.e., rotifers) 35
Platyhelminthes(flatworms, i.e., platyhelminths) 12
Fungi Ascomycota 66
Basidiomycota 68
Cryptomycota 53
Chloroplastida Charophyta, including land plantsEmbryophyta 68
Chlorophyta, including green algaeTrebouxiphyceae 36
Amoebozoa Discosea 24
Tubulinea 22
LEMD255 7
LKM74 12
Alveolata Ciliophora, containing hair-like cilia, i.e., ciliates 225
Dinoflagellata, phytoplankton, i.e., dinoflagellates 42
Protalveolata 17
Stramenopiles Ochrophyta, golden-brown algae 174
Peronosporomycetes, water mould, i.e., oomycota 19
(Additional file 6: Figure S2) was clearly higher in
non-disinfected samples from DWDSs A–B as compared to
disinfected samples from DWDSs C–E.
Eukaryotic communities in cold and hot water, as well as in biofilms
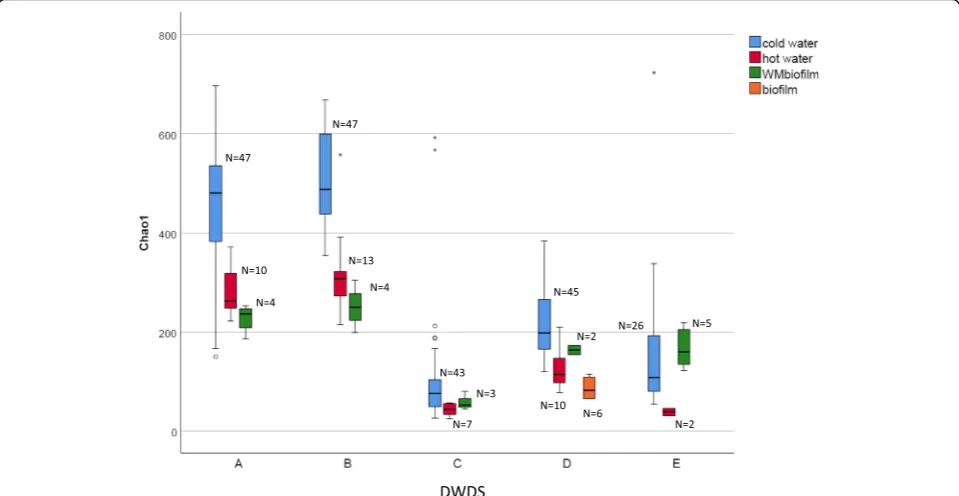
Alpha-diversity differed significantly between the samples of cold water, hot water, and biofilms (Chao1, P < 0.05, Fig. 3; Shannon index,P < 0.05, Additional file 6: Figure S2), with the highest values occurring in cold water sam-ples. The differences were more pronounced in
non-disinfected DWDSs A–B and disinfected DWDS D (Chao
1,P< 0.001) as compared to disinfected DWDSs C and E (Chao1,P< 0.05).
The richness of eukaryotic species (Chao1) was signifi-cantly lower in hot water than in cold water (Fig. 3; Kruskal-Wallis pairwise comparison, P < 0.05) while Shannon diversity was not (Additional file6: Figure S2). In detailed NMDS plots highlighting the differences
between the sample types of DWDSs A and B, clusters according to beta-diversity in both DNA and RNA were obvious (R= 0.47–0.70, P< 0.01, ANOSIM) (Fig. 4a, b) and hot water samples clustered away from the corre-sponding cold water samples (sampling location 2) in both RNA (R > 0.7, P < 0.01) and DNA (R > 0.5, P < 0.002). When targeting RNA, cold water differed from hot water also in DWDS D (R ≥ 0.45, P < 0.05). From the most abundant taxa profiles, hot water included the same taxa as the corresponding cold water, but slightly different proportions in DWDSs A–D (Fig.2, Additional file4: Figure S1). In DWDS D, the relative abundance of active fungi LKM11 in hot water (4%) was lower than that in cold water (14–22%) (Fig. 2). In DWDS E, hot water samples differed from cold water and showed an
especially high abundance of fungi Ascomycota (92%
RNA, 25% DNA).
Water meter biofilms showed lower alpha-diversity values than cold water only in unchlorinated DWDSs A
a
b
c
d
Fig. 2Average relative abundances of the most abundant active (RNA) eukaryotic taxa characterized to D5 taxa level.aDWDSs A–E: cold waters at locations 1–3.bDWDS C: cold waters between seasons.cDWDSs A–E: hot waters at location 2.dDWDSs A–E: biofilms from water meters (WM) or pipelines (PIPE). Taxa“others”represent OTUs that contain < 3000 reads in the entire dataset. Kingdoms marked as upper index:
1
and B (Fig. 3, Additional file6: Figure S2). Biofilm sam-ples clustered away from water samsam-ples in the weighted beta-diversity NMDS plots in all DWDSs A–E (Fig. 4). Biofilms displayed a difference in the most abundant taxa profiles when compared to water samples from the same DWDS (Fig. 2, Additional file 4: Figure S1). The most abundant taxa in biofilms varied between DWDS but Bilateria(nematodes, copepods, rotifers) and fungal
subphylum LKM11 were abundant in RNA (Fig.2) and
DNA samples (Additional file 4: Figure S1). In biofilm RNA samples, there was also an abundance of the amoeba clade LKM74,Streptophyta,Conthreep(ciliates), andChromulinales(golden-brown algae) (Fig.2). Total and active eukaryotic communities in cold water from different DWDS locations and seasons
The effect of location inside the DWDS was evident as differences in alpha- and beta-diversities and in the
in-creased abundance of certain taxa. In DWDSs A–B and
D–E, beta-diversities were clearly location-dependent
ac-cording to both DNA and RNA (ANOSIM,R= 0.6–0.8,
P ≤ 0.01), but this was less evident in DWDS C (R =
0.2–0.3, P ≤ 0.02) (Fig. 4). Statistical analysis was not conducted in DNA in DWDS E due to the low sample counts. Furthermore, also Chao1 and Shannon alpha-diversity indices were significantly different between the
locations in all DWDSs except in DWDS C (Fig. 5;
Additional file 6: Figure S3). Chao1 index in
non-disinfected DWDSs A–B (Fig.5a, b) and Shannon index
in DWDS A (Additional file 6: Figure S3) differed
be-tween RNA and DNA (P < 0.05). Different locations
mostly shared the same total and active common taxa within each DWDS but with different relative propor-tions (Fig.2, Additional file4: Figure S1).
The season exerted significant effects on the eukaryotic community in DWDS C only. This temporal effect on beta-diversity (RNA and DNA:R= 0.6–0.7,P= 0.01) was even more pronounced than the spatial effect (Fig. 4c). Higher species richness and larger diversity values were detected in spring and summer (Chao1 60–592, Shannon 1.7–2.4) compared to winter and autumn seasons (Chao1 26–159, Shannon 1.0–3.5). In samples with low species richness from winter and autumn, we observed a high coverage of one taxon, green algaeTrebouxiophyceae(Fig.
2b, Additional file4: Figure S1). No such seasonal differ-ences were detected in the other DWDSs.
Active and non-active eukaryotic members in DWDS Clustering analysis suggested some active and non-active OTUs as determined via the calculation of activity re-covery, i.e., RNA%−DNA% (Fig.6). Some taxa clustered according to the differences in activity between cold water, hot water, and biofilms, or between the DWDSs, while many representative taxa showed random activity recovery. The most abundant kingdoms seemed to con-tain both active and non-active taxa (Additional file 7:
Figures S4–S10). However, some kingdoms such as
Chloroplastida and Amoebozoa showed higher activity
recovery than other kingdoms (Additional file 7: Figures
S4 and S7). On the contrary, many Fungi including
LKM11 that represented the most abundant fungal taxon appeared to be inactive (Additional file7: Figure S5).
Some ciliates (multiple Alveolata taxa) seemed active only in non-disinfected DWDSs (Additional file7: Figure
S8). In DWDS C, phytoplankton Dinoflagellata (e.g.,
Gyrodinium, Biecheleria, Suessiaceae) (Additional file6: Figure S8) showed increased activity recovery in spring and summer whereas green algaeChlorophyta(e.g., Tre-bouxiphyceae) seemed to be active in the winter and au-tumn seasons (Additional file 7: Figure S7). There were
few Stramenopiles taxa of the golden-brown algae Ochrophyta in DWDSs A–B (Additional file 7: Figure S9) as well as ciliate taxa (Additional file7: Figure S10) in DWDSs B and D which seemed to be active in hot but not in cold water.
Potentially pathogenic eukaryotic members
Few genera of free-living amoebae were found in cold water, hot water, or biofilms at low read abundance (Additional file8: Tables S9–S11). The potentially
patho-genic Balamuthia were found mainly in cold water
ori-ginating from non-disinfected water from DWDSs A–B
a
b
c
e
d
(prevalence 17–88% of the samples). Very low read
counts of potentially pathogenic amoeba Vermamoeba
vermiformis were found in cold and hot water in
DWDSs A–D and especially from the pipeline biofilms
from DWDS D (Additional file 8: Tables S9–S11). Six
OTUs of free-living amoeba Vannella were present in
the dataset, the highest abundance occurred in cold wa-ters from DWDS E (Vannella epitetala) (Additional file
8: Table S9). Furthermore, amoebas Vannella and
Ver-mamoeba seemed to be active according to the activity recovery calculation (Additional file7: Figure S4). A few fungal genera that might cause adverse health effects were found:Aspergillus,Candida,Paecilomyces, Stachy-botrys,Alternaria, and Penicillium, with the latter show-ing the highest abundances, especially in cold water (Additional file 8: Tables S9–S11). Some of these fungi, e.g.,Penicillium andCandida, did not seem to be active in any of the samples (Additional file7: Figure S5). Effects of environmental factors for eukaryotic communities in cold water
The canonical correspondence analyses for active (RNA; Fig. 7) and total (DNA; Additional file 9: Figure S11) eukaryotic communities and representative taxa indi-cated that chlorine seemed to be an especially important factor shaping the composition of the eukaryotic
community. High chlorine concentrations were found to be inversely correlated with the abundances of the most abundant phyla and classes from all of the major king-doms (Amoebozoa, Fungi, Alveolata, Metazoa, Chloro-plastida, Stramenopiles, Rhizaria). The effect was more clearly seen in RNA analyses, evidence that chlorine exerted an effective disinfection property against the ac-tive eukaryote population. The samples from DWDS C that on average contained higher total chlorine concen-trations (0.3 mg/l) than DWDSs D and E (0.1 and 0.2 mg/l, respectively) (Table1) clustered in the correspond-ence analysis. In addition to chlorine, the high assimil-able organic carbon (AOC) concentration seemed to shape the active and total eukaryotic communities,
espe-cially the presence of Trebouxiphyceae in the DNA
li-brary of DWDS C (Fig. 7, Additional file 9: Figure S11). The concentration of microbially available phosphorus (MAP) in water correlated with the presence of active
eukaryotic community in DWDSs D and E (Fig.7). DNA
and RNA samples from DWDSs A and B clustered along the increased values of water absorbance at 254 nm, electric conductivity, turbidity, and total cell counts (Fig.
7, Additional file 9: Figure S11). In general, water temperature and heterotrophic plate count (HPC) exerted only minor effects on the eukaryotic communi-ties in the entire dataset.
a
d
e
b
c
Discussion
The waterworks itself is an important environmental driver shaping eukaryotic communities
By utilizing the amplicon sequencing method, we were able to characterize a diverse group of eukaryotic inhabi-tants of drinking water and biofilms both with respect to total eukaryotic organisms (DNA) and to those which were considered as active (RNA). Our analysis assayed the 18S rRNA genes and the respective transcripts ori-ginating from five different and well-functioning
large-scale waterworks and detected kingdoms that are
com-monly reported in DWDS, i.e., Ameobozoa, Alveolata,
Metazoa,Chloroplastida,Fungi, Stramenopiles, and Rhi-zaria [6–8, 32–41]. This study showed that the eukaryotic communities in DWDS were dependent on the origin of the raw water, the geographical location of the waterworks, and the water treatment process.
The importance of waterworks has been previously re-ported with respect to the formation of bacterial com-munities [1, 42]. Treated drinking water may resemble
raw water when some organisms are able to survive the
treatment process [34]. In our study, DWDSs A and B
were located in the same city, used artificially recharged groundwater, did not apply disinfection, and shared a similar structure of the eukaryotic community. One could speculate that the combination of a distinctive groundwater formation and the lack of treatment in waterworks A and B together resulted in the higher par-ticle or ion concentrations (turbidity, absorbance 254 nm, electric conductivity) and total cell counts; these were observed to be important environmental drivers in CCA and further were connected to rich and diverse eukaryotic communities. However, in general level, the most common eukaryotic members such as phytoplank-ton, ciliates, amoebas, fungi, and invertebrates were present in all studied DWDSs.
In this study, the eukaryotic communities had been most likely affected by the different water treatment pro-cesses in addition to the differences in raw water sources. The water treatment process is known to influence im-portant microbial taxa such as free-living amoeba [40,43], fungi [11], and the entire eukaryotic community [6]. Fil-tration in the water treatment process is an important stage in the elimination of microbes such as FLA and protozoan (oo)cysts [9]. On the other hand, a variety of di-verse eukaryotic communities containing invertebrates (rotifers, nematodes, gastrotrichs), Fungi, and Cercozoa can colonize both the sand filtration and the active carbon filtration processes [15,18,44–47]. Despite the spatial ef-fects in DWDS, the eukaryotic communities in water seem to reflect the shifts in the eukaryotic communities occurring in the water treatment processes as it is possible
for microorganisms to become detached from the filters into the final treated drinking water [45]. The complex food web in some filters may promote growth, and there-fore, the backwashing of filters is especially important for the control of eukaryotic community [6, 40, 44, 47]. In some cases, clogged filters may explain the especially high occurrence of some eukaryotes also found in this study such as nematodes and microcrustaceans [18].
Disinfection by UV irradiation and chlorine as the last step of the water treatment process is a powerful means to reduce the growth of the bacterial species in DWDSs [6]. In this study, significantly higher eukaryotic species
richness occurred in unchlorinated DWDSs A–B in
comparison with chlorinated DWDSs C–E, suggesting
that chlorination has efficacy also in decreasing active eukaryotic populations. This selective pressure caused by disinfection was seen as a more homogeneous eukaryotic population, in other words, a less diverse community, a phenomenon earlier found to occur in bacterial popula-tions [4]. In addition, differences in alpha- and beta-diversities were observed between total and active eukaryotic communities only in non-disinfected DWDS, suggesting that more eukaryotic taxa were active in un-chlorinated DWDS. The high relative abundances of some active taxa in disinfected DWDS suggest these taxa can tolerate chlorine to some extent. Especially in DWDS C, i.e., the waterworks which utilized the highest chlorine concentrations (average 0.3 versus 0.1 and 0.2 mg/l in DWDSs D and E, respectively), phytoplankton (dinoflagellates, green algae Trebouxiphyceae and water mould Spumella), and Metazoa(copepods, rotifers, and nematodes) dominated. These eukaryotes have been found in DWDS utilizing even higher chlorine
con-centrations than examined here [39]. For example,
Monogononta from the rotifer class, a microorganism commonly found in chlorinated DWDS, are reported to produce dormant eggs that are resistant to envir-onmental conditions [48].
Eukaryotic communities in biofilms and hot water display different characteristics to those in cold water
Previously, biofilms have been reported to have different eukaryotic communities than the water in the DWDS [6]. In this study, the biofilms seemed to be more uniquely representative of the water system in which they were liv-ing rather than bearliv-ing similarities to each other. The bio-films sampled from all DWDSs showed less eukaryotic species richness and diversity than the corresponding water samples, suggesting that only some of the eukaryotic members can thrive in biofilms, such asAmoebozoa[38]. These biofilms, however, did not seem to be particularly selective for certain kingdoms as all major kingdoms also present in water were detected in biofilms (Cloroplastida, Metazoa, Alveolata, Stramenopiles, Amoebozoa). In case
of pathogenic members, the biofilm detachment may pose a health risk to water consumers. In this study, the
occur-rence of Vermamoeba vermiformis amoeba in DWDS D
biofilms is of special interest despite its low abundance (≤ 50 reads/biofilm sample).
A hot water temperature is known to decrease the ac-tive microbial biomass and change the characteristics of the bacterial community and its metabolic functions [2]. In our present study, it was found that a hot water sys-tem represented a selective pressure also for eukaryotes decreasing the number of the rare eukaryotic species in hot water. Interestingly, in all DWDSs, the most abun-dant eukaryotic taxa were shared between the cold and hot water with relative similar abundances (mainly Bila-teria, Streptophyta, Chromulinales, Conthreep, green algae Trebouxiphyceae). These taxa were clearly robust and tolerated hot water temperatures. In particular, a
water mould, genus Spumella, seemed to benefit from
the changed environmental conditions that led to its in-creased relative abundance either due to its growth or relatively higher resistance to hot water. Not all of the abundant eukaryotic organisms were able to survive in such harsh conditions. For example, the most abundant
fungi found in this study, Cryptomycota (LKM11),
showed generally low activity recovery and a lower abundance in hot water than in cold water.
Different locations within a DWDS represent distinct communities while the effects of season are visible under some circumstances
There were invariable differences detected in the eukaryotic communities between different locations within the full-scale DWDSs studied herein, with this being mainly evident in species richness and differences in beta-diversity. Only in DWDS D did the number of eukaryotic species increases with growing distance from the waterworks. In DWDS C, the different alpha- and beta-diversities in the most distant location 3 compared to locations 1 and 2 may be due to the lower residual chlorine concentration or higher iron concentrations in the site [21]. In DWDS B, an increased abundance of ac-tive Tarenaya hassleriana was detected as the distance from the water treatment plant increased. The reason is unclear, but it might be due to its growth in DWDS, de-tachment from biofilms, or increased RNA due to the adaptation to stress conditions such as increased dark-ness [49]. The findings are in accordance with earlier re-ports indicating that at DWDS endpoints, one can detect an increase in the occurrence and diversity of eu-karyotes, e.g., amoebas [8].
of phytoplankton. A green algaeTrebouxiophyceae dom-inated winter and autumn samples whereas the activity recovery and occurrence of dinoflagellates were elevated in the samples collected in spring and summer. The quality of raw water source (surface water) may be reflected in the treated water, especially if obligate photoautotrophic microorganisms are present and the
algae can survive the water treatment process [39].
Growth within the DWDS is also a feasible explanation as
the green algae Trebouxiphyceae class contains
non-photosynthetic species that could thrive in dark DWDS environments [50]. The high relative abundance of phyto-plankton might be also due to the reduction in the num-bers of other eukaryotic memnum-bers which was observed as low species richness and less diversity in winter and au-tumn seasons. The higher relative abundance ofBilateria invertebrates (copepods, nematodes, and rotifers) ob-served in spring and summer [39] might be due to their bacterivorous properties, i.e., these benefit from the in-creased counts of heterotrophic bacteria that occurred es-pecially in summer season [21]. In DWDS of the other surface waterworks (DWDS D), the effect of season was not obvious, and thus, the source water type alone cannot explain the observed seasonal differences in DWDS C.
Many eukaryotic taxa show differences in their activity recovery depending on environmental conditions
This novel study characterized the eukaryotic communi-ties in drinking water utilizing also RNA as a template.
Activity recovery (RNA–DNA) [20] was considered a
more appropriate way to handle this data instead of the RNA/DNA ratio [19, 51, 52] in order to keep also zero values in the analysis. In the relative activity recovery, the scale was limited to lower variation (−100 to 100), and thus, the distribution of the results was even more extensive than in the RNA/DNA ratio calculation (scale in this data was−3400- to 14,600-fold).
Heatmap clustering analysis suggested increased activ-ities based on the higher relative abundance in RNA than DNA samples of some eukaryotic taxa under
certain circumstances. Amoebozoa and Chloroplastida
seemed active in most DWDS whereas other kingdoms seemed to exhibit more variability and contain both ac-tive and non-acac-tive taxa. Of phytoplankton taxa, dinofla-gellates seemed to be active in some DWDS in the
spring and summer seasons as well as green algae
Tre-bouxiphyceae (DWDS C) and spider flower Tarenaya hassleriana (DWDS B). Further, algal phylum Ochro-phyta members were active in hot water. On the other hand, fungal subphylum LKM11 and ciliates showed low activity recovery, most probably due to chlorination.
While delivering novel information, also the limita-tions in the interpretation of activity recovery results solely as a sign of increased activity must be noted. A
phenomenon where an increased ribosomal RNA count occurs after the bacterial cells become dormant [49,53] is suspected also to occur in eukaryotes during environ-mental stress events such as increased chlorination, elevated temperature, or lack of nutrients. On the com-munity level, the species richness is expected to be higher in rDNA libraries compared to rRNA libraries as rRNA only describes active or dormant population but excludes environmental DNA originating from dead cells
[3]. However, due to the higher rRNA than rDNA copy
counts in a cell, the RNA approach may better detect rare taxa as previously noted as higher species richness in RNA than in DNA sequence libraries of bacterial communities in drinking water [4]. In the present study with eukaryotes, higher species richness in RNA than in DNA samples was noted especially in unchlorinated cold water, the finding potentially indicating the more sensi-tive detection of rare community members when target-ing sequenctarget-ing efforts to rRNA instead of rDNA. The variation in the ribosomal locus may be more extensive in genomes of eukaryotes (extending to tens of thou-sands of copies) than in bacteria (some dozens) [54] af-fecting the detection sensitivity.
Evaluation of some opportunistic pathogens or harmful eukaryotic members
In the studied DWDS, the finding of six different OTUs of Vannella spp. is a concern, due to the ability of cer-tain Vannella spp. to host pathogenic amoeba-resisting bacteria such asLegionella[55]. In addition, low reads of potentially pathogenic amoebal OTUs were identified as Balamuthia (maximum 42 reads/sample in water) and Vermamoeba vermiformis (≤50 reads/sample in
bio-films). In addition to amoebas, Paramecium and
Cycli-diumciliates were found and these are capable to act as hosts for pathogens, e.g., Legionella [56]. Also, a few
OTUs of the Hymenostomatia subfamily were found,
but these could not be identified to a deeper level;
how-ever, this taxon containsTetrahymenagenera known to
act as a host for pathogens [56].
The relative abundances of potential pathogens in this study were low in comparison with earlier reports from
other DWDS including reservoirs where Acanthamoeba
The sources of rare Balamuthia brain infections in the USA have been linked in addition to the soil environ-ment also to different water sources [59]. One case of Balamuthia was linked to nasal lavage with drinking water containing this amoeba [60].
Similar to our findings, many researchers have found fungal genera Penicillium, Aspergillus [6], Alternaria, and Candida [39] in the DWDS, and some species of these genera can cause negative health outcomes [16,
61, 62]. In addition, fungi cause esthetic problems in
DWDS [15]. Also, nematodes cause esthetic concerns
but may additionally carry pathogenic bacteria in their gut, thus representing a potential health hazard [37,
63]. However, the common abundance of nematodes in
DWDS [37] combined with the lack of reported health
problems suggests that these are a normal part of the DWDS biota, and their presence may even be beneficial in water treatment filtration processes [18,46,64]. Taxonomic identification limitations
Universal eukaryotic primers are designed to target a wide range of eukaryotes. In this study, the primer pair
Eu565F-Eu981R [23] was used for the first time in a
DWDS study and revealed a wide eukaryotic community containing all of the relevant DWDS kingdoms. However, it was not possible to identify many abundant taxa from
important kingdoms such as Fungi and Amoebozoa to a
deeper taxonomic identification level in the SILVA data-base. This suggests that not all eukaryotic taxa members that are abundant in nature are represented in this database. ForFungi, a high abundance of LKM11 subphy-lum ofCryptomycotawas observed. It is only recently that this uncultivable group of fungi has been detected in en-vironmental freshwaters [65]. The possible ecological
im-portance of this “hidden fungi” in DWDS should be
clarified; in fact, future research needs have been already acknowledged in a study on freshwater environments [66], including the ecological and health-related aspects of this
fungi. For Amoebozoa, the most abundant taxa were
LKM74 [8] and LKM255 clades whose ecological role is still unresolved; the LKM74 clade is a common soil and freshwater inhabitant, but it has been possible to cultivate only one species, Mycamoeba gemmipara[67], highlight-ing non-cultivability and novelty of the members in LKM74 clade. Furthermore, traditional methods as well as more taxa-specific primers, e.g., the fungi-specific primer internal transcribed spacer (ITS), are still useful for identi-fication purposes. In addition, there is an obvious need to expand the reference databases, e.g., SILVA for better characterization of eukaryotic organisms [11,68].
Conclusions
This study examining DWDSs of well-functioning water-works revealed that diverse eukaryotic communities
(invertebrates, i.e., nematodes, rotifers, and ciliates; fungi; phytoplankton; and amoebas) exist in DWDS as part of the normal biota.
The eukaryotic communities present in the DWDS were most strongly shaped by the waterworks rather than season, the location within the DWDS or the water temperature. This highlights the independent or com-bined role of the raw water source, geographical loca-tion, and/or water treatment process in determining which taxa will be present.
The lower number of eukaryotic species in the disin-fected DWDSs and in hot water as compared to non-disinfected cold water indicates that these circumstances exert selective pressure on which eukaryotic members in the DWDS can survive. Metazoa, Fungi, and Chloroplas-tidaappeared to be the most resistant eukaryotic members as judged by their high abundances in disinfected systems.
The ecological role and risk assessment of some of the common eukaryotic inhabitants of the DWDS found here, such as free-living amoebae, fungi, and invertebrates like roundwormsNematoda, should stimulate future research. Moreover, a deeper taxonomic characterization of the abundant but still unidentified taxa, especially within the AmoebozoaandFungikingdoms, should be recognized.
Additional files
Additional file 1:A chart of the experimental design of the study. (PDF 100 kb)
Additional file 2:Description of the physico-chemical quality of cold water (Table S1.) and hot water (Table S2.) in DWDSs A–E. (PDF 324 kb)
Additional file 3:Number of reads in the analyzed 18S rRNA gene (rDNA) and rRNA transcript (rRNA) sequence libraries (Table S3.). (PDF 265 kb)
Additional file 4:Average relative abundances of the most abundant total (DNA) eukaryotic taxa (Figure S1.) See active (RNA) eukaryotic taxa (Fig.2) for legend. (PDF 264 kb)
Additional file 5:Top 50 operational taxonomic units (OTUs) in DWDS A (Table S4.), DWDS B (Table S5.), DWDS C (Table S6.), DWDS D (Table S7.) and DWDS E (Table S8.) (PDF 223 kb)
Additional file 6:Boxplot of alpha-diversity Shannon values grouped by cold water, hot water, and biofilms in each DWDSs A–E (DNA + RNA) (Figure S2). Boxplot of alpha-diversity Shannon values in cold water ( Fig-ure S3). (PDF 255 kb)
Additional file 7:Heatmap clustering analysis by activity recovery (%) of 66AmoebozoaOTUs (Figure S4.), 139FungiOTUs (Figure S5.), 110 Metazoa(animal) OTUs (Figure S6.), 84ChloroplastidaOTUs (Figure S7), 234AlveolataOTUs (Figure S8.), 148StramenopilesOTUs (Figure S9.), and 127RhizariaOTUs (Figure S10.). Red color represents a high activity recovery, i.e., relative abundance (%) is higher in RNA than DNA; blue color represents a low activity recovery. (PDF 613 kb)
Additional file 8:Possible pathogenic or opportunistic eukaryotes and free-living amoeba in cold water (Table S9.), hot water (Table S10.), and biofilms (Table S11.) (PDF 271 kb)
Additional file 9:Eukaryotic community (DNA) canonical correspondence analysis (CCA) (Figure S11.) (PDF 454 kb)
Abbreviations
AOC:Assimilable organic carbon; DAPI: Total cell count determined using 4,6-diamidino-2-phenylindole staining; DEUF: Dead-end ultrafiltration; DWDS: Drinking water distribution system; EC: Electric conductivity; FLA: Free-living amoebae; HPC: Heterotrophic plate count; MAP: Microbially available phosphorus; NA: Nucleic acid; NMDS: Non-metric multidimensional scaling plot; OTU: Operational taxonomic unit; rDNA: Ribosomal RNA gene (DNA); rRNA: Ribosomal RNA (RNA); WM: Water meter
Acknowledgements
The personnel of the Department of Health Security in the National Institute for Health and Welfare, Kuopio, Finland, are gratefully acknowledged: Tiina Heiskanen, Marjo Tiittanen, and Tarja Rahkonen for the laboratory assistance and Jatta Heikkinen and Jaana Kusnetsov for the help in the sampling. Also, waterworks personnel are acknowledged for their help in the sampling. Jorge Santo Domingo and Vicente Gomez-Alvarez from the US Environmen-tal Protection Agency are acknowledged from their valuable help in setting up the amplicon sequencing system for the DWDSOME project. Pauli Tuores-mäki is gratefully acknowledged for his help in designing the R code for the activity recovery calculations. Ewen MacDonald is acknowledged for the grammatical advice on the article.
Authors’contributions
TP, ITM, ET, JP, and MK designed the study. AMH, JIkonen, and JH collected and processed the samples in the field with the help of TP, ITM, AP, and AK. JIkonen, AMH, TP, AK, JH, AK, and SS were responsible for the laboratory analyses. JB and TP were responsible for the bioinformatics processing. JInkinen analyzed the 18S rRNA (gene) data. JInkinen drafted the manuscript with revisions from TP, MT, AMH, ITM, SS, AK, JIkonen, ET, MK, and BJ. All authors have approved the submitted version.
Funding
The study was performed in DWDSOME (Microbiome Dynamics in Drinking Water Distribution System) project funded by the Academy of Finland (Project number 275549).
Availability of data and materials
The datasets generated during the current study including sequences are available in the Short Read Archive (SRA) of NCBI under BioSample accession numbers from SAMN10653499 to SAMN10653948 of the BioProject PRJNA509718. Samples reported in this study account accession numbers SAMN10653499 to SAMN10653784. All samples and controls are listed in a metadata file (Additional file10: Table S12). The pairs list for corresponding DNA and RNA for each sample is available (Additional file10: Table S13). An analysis script for the sequence processing, activity recovery calculations, and CCA analysis is available in GitHub underhttps://github.com/thl-kuopio/ DWDSOME-Eukaryote-analysis.
Ethics approval and consent to participate
Not applicable.
Consent for publication
Not applicable.
Competing interests
The authors declare that they have no competing interests.
Author details
1Department of Health Security, National Institute for Health and Welfare, P.O. Box 95, FI-70701 Kuopio, Finland.2Institute of Biomedicine, University of Eastern Finland, P.O. Box 1627, FI-70211 Kuopio, Finland.3Department of Environmental and Biological Sciences, University of Eastern Finland, P.O. Box, 1627, FI-70211 Kuopio, Finland.
Received: 25 January 2019 Accepted: 20 June 2019
References
1. Ji P, Parks J, Edwards MA, Pruden A. Impact of water chemistry, pipe material and stagnation on the building plumbing microbiome. PLoS One. 2015;10:1–24.
2. Dai D, Rhoads WJ, Edwards MA, Pruden A. Shotgun metagenomics reveals taxonomic and functional shifts in hot water microbiome due to temperature setting and stagnation. Front Microbiol. 2018;9:1–17. 3. Inkinen J, Jayaprakash B, Santo Domingo JW, Keinänen-Toivola MM, Ryu H,
Pitkänen T. Diversity of ribosomal 16S DNA- and RNA-based bacterial community in an office building drinking water system. J Appl Microbiol. 2016;120:1723–38.
4. Inkinen J, Jayaprakash B, Ahonen M, Pitkänen T, Mäkinen R, Pursiainen A, et al. Bacterial community changes in copper and PEX drinking water pipeline biofilms under extra disinfection and magnetic water treatment. J Appl Microbiol. 2018;124:611–24.
5. Faust K, Raes J. Microbial interactions: from networks to models. Nat Rev Microbiol. 2012;10:538–50.
6. Lin W, Yu Z, Zhang H, Thompson IP. Diversity and dynamics of microbial communities at each step of treatment plant for potable water generation. Water Res. 2014;52:218–30.
7. Wang H, Masters S, Edwards MA, Falkinham JO, Pruden A. Effect of disinfectant, water age, and pipe materials on bacterial and eukaryotic community structure in drinking water biofilm. Environ Sci Technol. 2014;48: 1426–35.
8. Delafont V, Bouchon D, Héchard Y, Moulin L. Environmental factors shaping cultured free-living amoebae and their associated bacterial community within drinking water network. Water Res. 2016;100:382–92.
9. Loret JF, Jousset M, Robert S, Saucedo G, Ribas F, Thomas V, et al. Amoebae-resisting bacteria in drinking water: risk assessment and management. Water Sci Technol. 2008;58:571–7.
10. Plutzer J, Karanis P. Neglected waterborne parasitic protozoa and their detection in water. Water Res. 2016;101:318–32.
11. Ma X, Vikram A, Casson L, Bibby K. Centralized drinking water treatment operations shape bacterial and fungal community structure. Environ Sci Technol. 2017;51:7648–57.
12. Cateau E, Delafont V, Hechard Y, Rodier MH. Free-living amoebae: what part do they play in healthcare-associated infections? J Hosp Infect. 2014;87:131–40.
13. Thomas V, McDonnell G, Denyer SP, Maillard JY. Free-living amoebae and their intracellular pathogenic microorganisms: risks for water quality. FEMS Microbiol Rev. 2010;34:231–59.
14. Muchesa P, Leifels M, Jurzik L, Hoorzook KB, Barnard TG, Bartie C. Coexistence of free-living amoebae and bacteria in selected South African hospital water distribution systems. Parasitol Res. 2017;116:155–65. 15. Hageskal G, Lima N, Skaar I. The study of fungi in drinking water. Mycol Res.
2009;113:165–72.
16. BabičMN, Gunde-Cimerman N, Vargha M, Tischner Z, Magyar D, Veríssimo C, et al. Fungal contaminants in drinking water regulation? A tale of ecology, exposure, purification and clinical relevance. Int J Environ Res Public Health. 2017;14:636.
17. Sammon NB, Harrower KM, Fabbro LD, Reed RH. Three potential sources of microfungi in a treated municipal water supply system in sub-tropical Australia. Int J Environ Res Public Health. 2011;8:713–32.
18. Mauclaire L, Schürmann A, Mermillod-Blondin F. Influence of hydraulic conductivity on communities of microorganisms and invertebrates in porous media: a case study in drinking water slow sand filters. Aquat Sci. 2006;68:100–8.
19. Logares R, Audic S, Bass D, Bittner L, Boutte C, Christen R, et al. Patterns of rare and abundant marine microbial eukaryotes. Curr Biol. 2014;24:813–21. 20. Jones SE, Lennon JT. Dormancy contributes to the maintenance of
microbial diversity. Proc Natl Acad Sci. 2010;107:5881–6.
21. Ikonen JM, Hokajärvi A-M, Heikkinen J, Pitkänen T, Ciszek R, Kolehmainen M, et al. Drinking water quality in distribution systems of surface and ground waterworks in Finland. J Water Secur. 2017;3:1–10.
22. Smith CM, Hill VR. Dead-end hollow-fiber ultrafiltration for recovery of diverse microbes from water. Appl Environ Microbiol. 2009;75:5284–9. 23. Stoeck T, Bass D, Nebel M, Christen R, Jones MDM, Breiner HW, et al.
Multiple marker parallel tag environmental DNA sequencing reveals a highly complex eukaryotic community in marine anoxic water. Mol Ecol. 2010;19:21–31.
24. Caporaso JG, Kuczynski J, Stombaugh J, Bittinger K, Bushman FD, Costello EK, et al. QIIME allows analysis of high-throughput community sequencing data. Nat Methods. 2010;7:335–6.
26. Bolger AM, Lohse M, Usadel B. Trimmomatic: a flexible trimmer for Illumina sequence data. Bioinformatics. 2014;30:2114–20.
27. MagočT, Salzberg SL. FLASH: fast length adjustment of short reads to improve genome assemblies. Bioinformatics. 2011;27:2957–63.
28. Rognes T, Flouri T, Nichols B, Quince C, Mahé F. VSEARCH: a versatile open source tool for metagenomics. PeerJ. 2016;4:e2584.
29. Pruesse E, Quast C, Knittel K, Fuchs BM, Ludwig W, Peplies J, et al. SILVA: a comprehensive online resource for quality checked and aligned ribosomal RNA sequence data compatible with ARB. Nucleic Acids Res. 2007;35:7188–96. 30. Wickham H. ggplot2: elegant graphics for data analysis. New York: Springer;
2009.
31. Dhariwal A, Chong J, Habib S, King IL, Agellon LB, Xia J. MicrobiomeAnalyst: a web-based tool for comprehensive statistical, visual and meta-analysis of microbiome data. Nucleic Acids Res. 2017;45:W180–8.
32. Gomez-Alvarez V, Revetta RP, Domingo JWS. Metagenomic analyses of drinking water receiving different disinfection treatments. Appl Environ Microbiol. 2012;78:6095–102.
33. Poitelon JB, Joyeux M, Welté B, Duguet JP, Peplies J, Dubow MS. Identification and phylogeny of eukaryotic 18S rDNA phylotypes detected in chlorinated finished drinking water samples from three Parisian surface water treatment plants. Lett Appl Microbiol. 2009;49:589–95.
34. Otterholt E, Charnock C. Identification and phylogeny of the small eukaryote population of raw and drinking waters. Water Res. 2011;45:2527–38. 35. Valster RM, Wullings BA, Bakker G, Smidt H, Van Der Kooij D. Free-living
protozoa in two unchlorinated drinking water supplies, identified by phylogenic analysis of 18S rRNA gene sequences. Appl Environ Microbiol. 2009;75:4736–46.
36. Bichai F, Hijnen W, Baars E, Rosielle M, Dullemont Y, Barbeau B. Preliminary study on the occurrence and risk arising from bacteria internalized in zooplankton in drinking water. Water Sci Technol. 2011;63:108–14. 37. Locas A, Barbeau B, Gauthier V. Nematodes as a source of total coliforms in
a distribution system. Can J Microbiol. 2007;53:580–5.
38. Liu R, Yu Z, Guo H, Liu M, Zhang H, Yang M. Pyrosequencing analysis of eukaryotic and bacterial communities in faucet biofilms. Sci Total Environ. 2012;435–436:124–31.
39. Buse HY, Lu J, Struewing IT, Ashbolt NJ. Eukaryotic diversity in premise drinking water using 18S rDNA sequencing: implications for health risks. Environ Sci Pollut Res. 2013;20:6351–66.
40. Thomas V, Loret JF, Jousset M, Greub G. Biodiversity of amoebae and amoebae-resisting bacteria in a drinking water treatment plant. Environ Microbiol. 2008;10:2728–45.
41. Buse HY, Lu J, Lu X, Mou X, Ashbolt NJ. Microbial diversities (16S and 18S rRNA gene pyrosequencing) and environmental pathogens within drinking water biofilms grown on the common premise plumbing materials unplasticized polyvinylchloride and copper. FEMS Microbiol Ecol. 2014;88: 280–95.
42. Roeselers G, Coolen J, van der Wielen PWJJ, Jaspers MC, Atsma A, de Graaf B, et al. Microbial biogeography of drinking water: patterns in phylogenetic diversity across space and time. Environ Microbiol. 2015;17:2505–14. 43. Corsaro D, Pages GS, Catalan V, Loret JF, Greub G. Biodiversity of amoebae
and amoeba-associated bacteria in water treatment plants. Int J Hyg Environ Health. 2010;213:158–66.
44. Kasuga I, Shimazaki D, Kunikane S. Influence of backwashing on the microbial community in a biofilm developed on biological activated carbon used in a drinking water treatment plant. Water Sci Technol. 2007;55:173–80.
45. Liao X, Chen C, Chang CH, Wang Z, Zhang X, Xie S. Heterogeneity of microbial community structures inside the up-flow biological activated carbon (BAC) filters for the treatment of drinking water. Biotechnol Bioprocess Eng. 2012;17:881–6.
46. Oh S, Hammes F, Liu WT. Metagenomic characterization of biofilter microbial communities in a full-scale drinking water treatment plant. Water Res. 2018;128:278–85.
47. Schreiber H, Schoenen D, Traunspurger W. Invertebrate colonization of granular activated carbon filters. Water Res. 1997;31:743–8.
48. Segers H. Rotifera: Monogononta. In: Yule, C.M., Sen, Y.H, editors. Freshwater invertebrates of the Malaysian region. Kuala Lumpur: Academy of Sciences Malaysia and Monash University; 2004. p. 106–120.
49. Blazewicz SJ, Barnard RL, Daly RA, Firestone MK. Evaluating rRNA as an indicator of microbial activity in environmental communities: limitations and uses. ISME J. 2013;7:2061–8.
50. Yan D, Wang Y, Murakami T, Shen Y, Gong J, Jiang H, et al.Auxenochlorella protothecoidesandPrototheca wickerhamiiplastid genome sequences give insight into the origins of non-photosynthetic algae. Sci Rep. 2015;5:1–9. 51. Giner CR, Forn I, Romac S, Logares R, de Vargas C, Massana R.
Environmental sequencing provides reasonable estimates of the relative abundance of specific picoeukaryotes. Appl Environ Microbiol. 2016;82: 4757–66.
52. Rachik S, Christaki U, Li LL, Genitsaris S, Breton E, Monchy S. Diversity and potential activity patterns of planktonic eukaryotic microbes in a mesoeutrophic coastal area (eastern English Channel). PLoS One. 2018;13: e0196987.
53. Sukenik A, Kaplan-Levy RN, Welch JM, Post AF. Massive multiplication of genome and ribosomes in dormant cells (akinetes) ofAphanizomenon ovalisporum(Cyanobacteria). ISME J. 2012;6:670–9.
54. Bik HM, Porazinska DL, Creer S, Caporaso JG, Knight R, Thomas WK. Sequencing our way towards understanding global eukaryotic biodiversity. Trends Ecol Evol. 2012;27:233–43.
55. Ashbolt NJ. Microbial contamination of drinking water and human health from community water systems. Curr Environ Heal Reports. 2015;2:95–106. 56. Bichai F, Payment P, Barbeau B. Protection of waterborne pathogens by higher
organisms in drinking water: a review. Can J Microbiol. 2008;54:509–24. 57. Thomas JM, Ashbolt NJ. Do free-living amoebae in treated drinking water
systems present an emerging health risk? Environ Sci Technol. 2011;45:860–9. 58. Thomas V, Herrera-rimann K, Blanc DS, Greub G. Biodiversity of amoebae
and amoeba-resisting bacteria in a hospital water network. Appl Environ Microbiol. 2006;72:2428–38.
59. Cope JR, Landa J, Nethercut H, Collier SA, Glaser C, Moser M, et al. The epidemiology and clinical features ofBalamuthia mandrillarisdisease in the United States, 1974–2016. Clin Infect Dis. 2018;ciy813:1–8.
60. Piper KJ, Foster H, Susanto D, Maree CL, Thornton SD, Cobbs CS. Fatal Balamuthia mandrillarisbrain infection associated with improper nasal lavage. Int J Infect Dis. 2018;77:18–22.
61. Hageskal G, Knutsen AK, Gaustad P, De Hoog GS, Skaar I. Diversity and significance of mold species in Norwegian drinking water. Appl Environ Microbiol. 2006;72:7586–93.
62. BabičMN, Zalar P,Ženko B, Džeroski S, Gunde-Cimerman N. Yeasts and yeast-like fungi in tap water and groundwater, and their transmission to household appliances. Fungal Ecol. 2016;20:30–9.
63. WHO. Guidelines for drinking-water quality: first addendum to the fourth edition. 2017.
64. Scholz M, Martin RJ. Control of bio-regenerated granular activated carbon by spreadsheet modelling. J Chem Technol Biotechnol. 1998;71:253–61. 65. Jones MDM, Forn I, Gadelha C, Egan MJ, Bass D, Massana R, et al. Discovery
of novel intermediate forms redefines the fungal tree of life. Nature. 2011; 474:200–4.
66. Grossart HP, Rojas-Jimenez K. Aquatic fungi: targeting the forgotten in microbial ecology. Curr Opin Microbiol. 2016;31:140–5.
67. Blandenier Q, Seppey CVW, Singer D, Vlimant M, Simon A, Duckert C, et al. Mycamoeba gemmiparanov. gen., nov. sp., the first cultured member of the environmental Dermamoebidae clade LKM74 and its unusual life cycle. J Eukaryot Microbiol. 2017;64:257–65.
68. Fiore-Donno AM, Rixen C, Rippin M, Glaser K, Samolov E, Karsten U, et al. New barcoded primers for efficient retrieval of cercozoan sequences in high-throughput environmental diversity surveys, with emphasis on worldwide biological soil crusts. Mol Ecol Resour. 2018;18:229–39.
Publisher’s Note