Desert
Online at http://desert.ut.ac.ir
Desert 19-2 (2014) 173-181
Combination of Fuzzy and AHP methods to assess land suitability
for barley: Case Study of semi arid lands in the southwest of Iran
S. Hamzeh
a*, M. Mokarram
b, S. K. Alavipanah
aaDept. of Remote Sensing and GIS, Faculty of Geography, University of Tehran, Tehran, Iran
bDept. of Range and Watershed Management, Agriculture College and Natural Resources of Darab, Shiraz University, Darab, Iran
Received: 23 September 2014; Received in revised form: 15 November 2014; Accepted: 26 November 2014
Abstract
Land suitability analysis, commonly known as land evaluation, is considered an interface between land resource survey and land use planning and management. Land evaluation be carried out to estimate the suitability of land for a specific use such as arable farming or irrigated agriculture. There are several established techniques for generating land suitability evaluation. This research was carried out to evaluate the capability of a combined fuzzy AHP method for land suitability evaluation for barley crops in the southwest of Iran, and to compare the results with the standard method of the FAO framework. Eight soil parameters were chosen for cropland suitability analysis and thematic maps were developed with Kriging method for each of these parameters. Different fuzzy membership functions obtained from the literature were employed and weights for each parameter were calculated according to AHP. Landscape and soil requirements for barley were determined based on the FAO method. Finally, land suitability classes were provided for each land unit. Comparing the results with expert judgments shows that the fuzzy AHP method has a higher accuracy than the standard FAO method. Further development of the fuzzy AHP method would be advantageous for improving the accuracy of land suitability analysis.
Keywords: Land Suitability; GIS; Fuzzy AHP; FAO; Barley
1. Introduction
Agriculture is an important source of income, but farmers and land managers face daily problems such as the method, location, and proper timing for cultivation. To facilitate these choices, land suitability analysis can be carried out to estimate the suitability of land for a specific use such as arable farming or irrigated agriculture. Land suitability means the process of grouping of specific areas of land for defined uses in terms of their suitability (Liu et al., 2006). Planning and management of the land using suitability mapping and analysis is performed by application of the GIS (McHarg, 1969; Brail and Klosterman, 2001; Collins et al., 2001; Liu et al.,
Corresponding author. Tel.: +98 918 3511959, Fax: +98 21 6111352.
E-mail address:[email protected]
2005 and Zali Vargahan et al., 2011). GIS-based land suitability analysis has been applied in a wide variety of situations including ecological approaches for defining land suitability/habitants for animal and plant species (Store and Kangas, 2001), geological favourability (Bonham Carter, 1994), suitability of land for agricultural activities (Cambell et al., 1992; Kalogirou, 2002), landscape suitability for planning (Miller
et al., 1998), environmental impact assessment
(Moreno and Seigel, 1988) and for selecting the best site for public and private sector facilities (Church, 2002). The GIS-based approaches to this problem have their roots in the applications of hand-drawn overlay techniques used by American landscape architects in the late nineteenth and early twentieth century (Collins et
al., 2001). Several studies have focused on this
many different ways (Lukasheh et al., 2001; Kontos et al., 2003; Sener et al., 2006). The overlay procedures play a central role in many GIS applications, including techniques that are in the forefront of advances in the land suitability analysis such as: multi-criteria decision analysis (MCDA) (Malczewski, 1999), artificial intelligence (AI) ingeo-computation methods (Bradshaw et al., 2002), visualization methods (Jankowski et al., 2001), decision tree (Hou & Liu, 2008), expert systems (Kalogirou, 2002), genetic algorithms (GA) (Tseng et al., 2008), cellular automata (CA) (Yu et al., 2009) and fuzzy modelling for land suitability classification
(e.g., Ceballos-Silva and Lopez-Blanco, 2003; Liu and Samal, 2002; Malczewski, 2002; Triantafiliset al., 2001; Mokarram et al., 2010).
Many fuzzy membership functions have been developed for land suitability (Wang et al., 1990; Ahamed et al., 2000). These methods were implemented in GIS and analysis was performed for each raster cell to produce the land suitability maps. Input attributes and suitability indices were classified into different classes. However, determining fuzzy maps for each criterion the main problem is finding the relative weight of
these criteria and overlaying these maps to obtain a final land suitability map. The analytical hierarchy process (AHP) is known as a good method to overcome this problem (Cengiz and Akbulak, 2009; Saaty, 1980). Ordered weighted averaging (OWA) is another popular method for aggregation of attributes (Malczewski, 2006). The AHP technique has the ability to incorporate different types of data and compare two parameters at the same time by using the pairwise comparisons method (Saaty, 1977).
This research was carried out to: 1. implement the fuzzy AHP method to determine land suitability for barley, and 2. compare the fuzzy AHP method with the standard method of the FAO (Food and Agriculture Organization).
2. Material and methods
2.1. Study area and data set
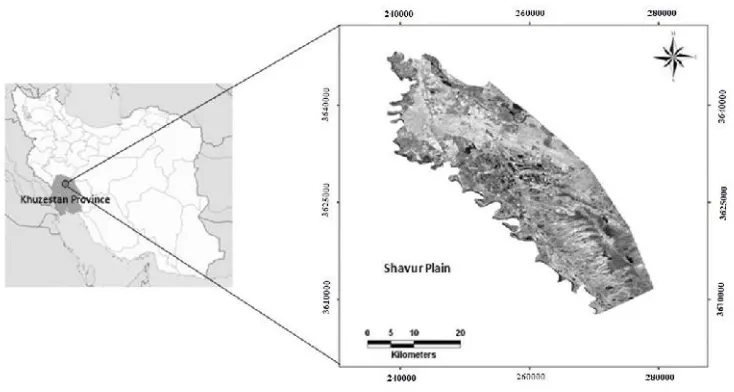
The study area, the Shavur Plain, is located in the Khuzestan Province in the southwest of Iran, between latitudes 31° 00' 30" N- 32° 30' 00"N and longitudes 48° 15' 00" E- 48° 40′40"E with
an area of 774 km2(Fig. 1).
Fig. 1. Location of the study area in the Iran
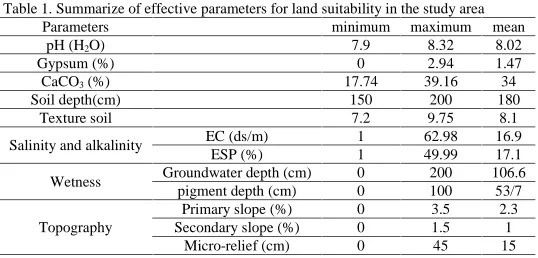
The dataset is extracted from a land classification study done by the Khuzestan Soil and Water Research Institute in 2009 and consists of: topography (primary slope, secondary slope and micro relief), wetness (groundwater depth and pigment depth), salinity (EC), alkalinity (ESP), soil texture, soil depth, CaCO3, pH (H2O) and gypsum in 256 locations.
A summary of the data set used in this study is shown in Table 1.
2.2. Land suitability classification methods
2.2.1. FAO method
determination of land suitability classes, the second category (classes) is used. In this method land suitability classes reflect degrees of suitability within four orders (i.e. S1, S2, S3, N).
The S1 means highly suitable, S2: moderately suitable, S3: marginally suitable and N: not suitable.
Table 1. Summarize of effective parameters for land suitability in the study area
Parameters minimum maximum mean
pH (H2O) 7.9 8.32 8.02
Gypsum (%) 0 2.94 1.47
CaCO3(%) 17.74 39.16 34
Soil depth(cm) 150 200 180
Texture soil 7.2 9.75 8.1
Salinity and alkalinity EC (ds/m) 1 62.98 16.9
ESP (%) 1 49.99 17.1
Wetness Groundwater depth (cm) 0 200 106.6
pigment depth (cm) 0 100 53/7
Topography
Primary slope (%) 0 3.5 2.3
Secondary slope (%) 0 1.5 1
Micro-relief (cm) 0 45 15
The land suitability model was constructed using GIS and modelling functions. In order to classify the lands, a parametric method was used (Sys et al., 1991). In the parametric method land and climate characteristics are defined using different ratings. In this method the determining features for land suitability are ranked between a minimum and maximum value (usually between 0 and 100) according to the Sys table (Sys et al., 1991). If a feature is highly influential 100 and if it is not, 0 will be assigned. These rankings are shown with A, B, C, etc. in formula 1.
To determine different characteristics and land indexes Equation (1) was used (Sys et al., 1993).
.... 100 100 100
min
R A B C
I
(1) Where, I is the specified index (%), Rmin is a
parameter with a minimum rank (%) and A, B, C are parameters ranking their influence on land suitability (%).
After the index was determined, land suitability classes were assigned according to the values in Table 2.
Table 2. Values of index for the various suitability classes (FAO, 1976)
Class description Index
S1 Highly suitable 75-100
S2 Moderately suitable 50-75
S3 Marginally suitable 25-50
N Not suitable 0-25
2.2.2 Fuzzy AHP method
2.2.2.1. Fuzzy classification
Fuzzy logic was initially developed by Zadeh (1965) as a generalization of classic logic. Zadeh
(1965) defined a fuzzy set as ‘a class of objects with a continuum of grades of memberships’. A
membership function assigns to each object a grade ranging between zero and one. The value zero means that x is not a member of the fuzzy set and value one means that x is a full member of the fuzzy set.
Traditionally, thematic maps represent discrete attributes based on Boolean memberships, such as polygons, lines and points. Mathematically, a fuzzy set can be defined as follows (McBratney and Odeh, 1997):
x x
for each x XA ,A (2)
Where μAis the function (membership function,
MF,) that defines the grade of membership of x in an A fuzzy set. The MF takes values between
and including 1 and 0 for all A that μA=0 means
that the value of
x
does not belong to A andμA=1 means that it belongs completely to A. Alternatively 0<μA(x)<1 implies that x belongs in
a certain degree to A. If X={x1, x2,…., xn} the
previous equation can be written as follows (McBratney and Odeh, 1997):
)]} ( , [ ... )] ( , [ )] ( ,
{[x1 Ax1 x2 A x2 xn Axn
A (3)
In simple terms, Equations (2) and (3) mean that for every x that belongs to the set X, there is a membership function that describes the degree of ownership of x in A.
The simplest function is the triangular form, but trapezoidal, Gaussian, and parabolic are also possible. Given the non-discrete characteristics of soils and land use, fuzzy theory suits the analysis of land suitability well (Nikravesh et al., 2004). The development of GIS has contributed to facilitating the mapping of land suitability with both Boolean and fuzzy methods (Nikravesh et al., 2004).
b x b x a a b a x a x x f X A 1 / 0 ) ( ) ( (4)
Where x is the input data and a, b are the limit values according to Sys Tables.
For soil texture, exchange capacity, exchangeable sodium percentage (ESP), gypsum (%), CaCO3(%), topography, and pH values, the
following function was used (Braimoh et al., 2004). b x b x a a b x b a x x f X A 0 / 1 ) ( ) ( (5)
2.2.2.2. AHP method
The AHP is a structured technique for organizing and analysing complex decisions. This method is based on a pair wise comparison matrix. A pair wise comparison matrix is called consistent if the transitivity Equation (6) and the reciprocity Equation (7) rules are respected.
aij= aik· akj (6)
aij= 1/ aji (7)
Where i, j and k are any alternatives of the matrix. In a consistent matrix Equation (6), all the comparisons aijobey the equality aij= pi/pj, where
piis the priority of the alternative i. When the
matrix contains inconsistencies, two approaches can be applied:
n n j n n n i i n j P P P P P P P P P P P P P P P P / ... / ... / ... 1 ... ... ... / ... 1 ... / ... ... ... 1 ... / ... / ... / 1 1 1 1 1 1 (8)
In this method, pair wise comparisons are considered as input and relative weights are considered as outputs. In order to prepare the pair wise comparison for each of parameters, the report of TakSabz organization (Khuzestan Soil and Water Research Institute, 2009) was used. This report showed that soil salinity and alkalinity in this study area for barley cultivation have fewer restrictions than soil wetness, CaCO3,
gypsum, pH, texture, soil depth, and topography, respectively. Thus, according to Sys Table, soil salinity and alkalinity receives number 9, and similarly, according to their degree of importance in land suitability, other parameters
get number 7, 8 …. . Then based on Equations
(6) to (8) the weight of each parameter was calculated. The resulted matrix is known as normalized pair wise comparison matrix. The average of each row of the pair wise comparison matrix is calculated and these average values indicate relative weights of the compared criteria.
2.2.3. Combination of Fuzzy and AHP methods
Finally, in order to prepare the land suitability map, it is necessary to calculate the convex combination of the raster values containing the different fuzzy parameters. A1, … Ak are fuzzy
subclasses of the defined universe of objects X, and W1, … Wkare non-negative weights summing
up to unity. The convex combination of A1, … Ak
is a fuzzy class A (Burrough, 1989), and the weights W1, … Wkwere calculated using AHP,
and fuzzy method parameters have been calculated in ArcGIS.
Equations (9) and (10) present the convex combination.
x X
W k j x A j
A
1 (9) 0 1 1
j k j j W W (10)To assess the agreement between the fuzzy AHP and FAO methods, the Kappa coefficient developed by Cohen (1960) was calculated. The Kappa coefficient is a measurement of the degree of agreement between two observations (maps) and its calculation is based on the difference between the two maps. Finally, in order to evaluate which method performs best, 20 cultivation fields, as validation fields, were randomly chosen, and the yields per hectare of the irrigated barley were measured. Then, the rate of yield decrease relative to potential yield (%) was obtained.
The fuzzy AHP approach in this study has been divided into five stages. These stages are summarized in Figure 2.
Fig. 2. Fuzzy AHP procedure for land suitability analysis for barley
3. Results and Discussion
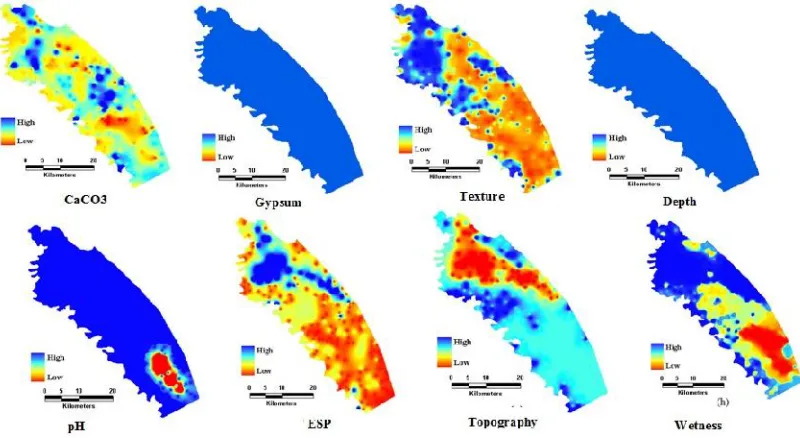
In this study first of all, maps were constructed for the model parameters by Kriging interpolation between 256 sampling points. Next, capability of different functions to calculate the
fuzzy memberships such as: small, near, Gaussian and linear was examined for different parameters of land suitability. The best fuzzy membership was achieved using linear functions Equation (4) and (5). The resulting maps for each parameter are shown in Figure 3.
Fig. 3. Fuzzy maps for each parameter for determining land suitability for barley
Next, the AHP method was applied on the fuzzy parameter maps. The pair wise comparison matrix used for preparation of the weights for
each parameter in the AHP method is given in Table 3.
Table 3. Pair wise comparison matrix for land suitability for barley
parameters CEC and ESP
Soil
wetness CaCO3 Gypsum pH
Texture soil
Soil
depth Topography Weight
CEC and ESP 1 2 3 4 5 6 7 8 0.329
oil wetness 1/2 1 2 3 4 5 6 7 0.224
aCO3 1/3 1/2 1 2 3 4 5 6 0.152
Gypsum 1/4 1/3 1/2 1 2 3 4 5 0.105
pH 1/5 1/4 1/3 1/2 1 2 3 4 0.075
Texture 1/6 1/5 1/4 1/3 1/2 1 2 3 0.052
Soil depth 1/7 1/6 1/5 1/4 1/3 1/2 1 2 0.035
Table 4. Samples results of the qualitative suitability of different land series for barley using FAO method
Land units Land index Suitability classes Land units Land index Suitability classes
1 57.3 S2 6 14.1 S3
2 38.6 S2 7 8.2 S2
3 41.2 S2 8 52.2 S2
4 56.8 S3 9 37 S3
5 35.3 S3 10 33 S3
In the FAO method, after placing each of the parameters between 0 to 100 according to Equation (1), the land index was calculated. The results of the barley land suitability classes using the FAO method is given in Table 4 (first ten soil
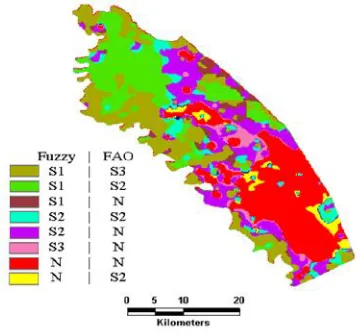
units are presented, the rest of the units are omitted from the table). Land suitability maps base on the FAO method and fuzzy AHP are shown in Figure 4.
Fig. 4. Land suitability maps for barley as determined by the FAO method (left) and fuzzy AHP (right)
As shown in Figure 4, the FAO method classifies the region into three classes (N, S2 and S3). There is no instance of class S1, because the features are discrete and higher weights are assigned to the limiting features in land suitability. The results of the FAO method show that 30% of the lands are moderately suitable (S2 class), 24% are marginally suitable (S3 class) and 46% are not suitable (class N). In comparison, the results of the fuzzy AHP method show that
44% of the lands are highly suitable (S1 class), 22% moderately suitable (S2 class), 4% marginally suitable (S3 class) and 28% are not suitable (class N), which are quite different in comparison with the results of the FAO method.
The Kappa coefficient is 0.31 between the fuzzy AHP and the FAO maps. This value indicates a poor agreement between the two methods. Figure 5 shows the results of this comparison.
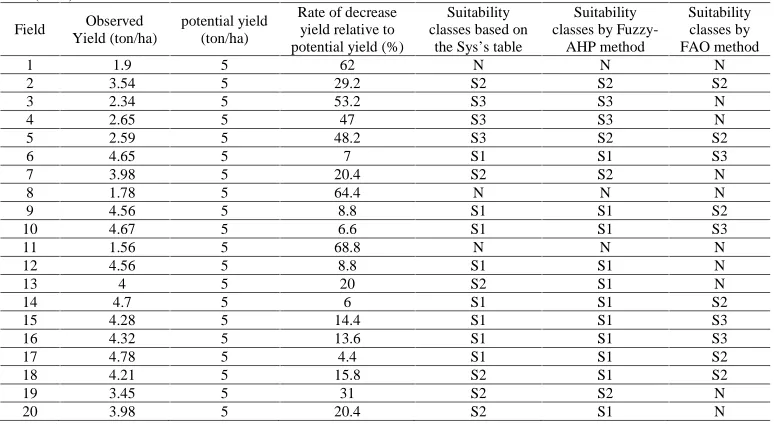
According to the agricultural organization of Khuzestan Province, the maximum potential yield for the barley in the Shavur Plain is 5 tons/ha (Khuzestan Soil and Water Research Institute, 2009). Finally, based on the Table of Sys (1993) the corresponding class of each field was specified, and compared with the classes obtained from the fuzzy AHP and FAO methods. This comparison shows that fuzzy AHP has a
higher accuracy than the FAO method (Table 5). With the fuzzy AHP 15 fields of the 20 reference fields are assigned to the correct class, while the FAO method only classifies five fields correctly. In general, the FAO method underestimates the land suitability for barley, in nine out of the 20 cases even severely by assigning a class that is two levels lower.
Table 5. Comparison the results of Fuzzy-AHP and FAO methods based on the observed yields in validation fields and Sys’s
table (1993)
Field Observed Yield (ton/ha)
potential yield (ton/ha)
Rate of decrease yield relative to potential yield (%)
Suitability classes based on
the Sys’s table
Suitability classes by
Fuzzy-AHP method
Suitability classes by FAO method
1 1.9 5 62 N N N
2 3.54 5 29.2 S2 S2 S2
3 2.34 5 53.2 S3 S3 N
4 2.65 5 47 S3 S3 N
5 2.59 5 48.2 S3 S2 S2
6 4.65 5 7 S1 S1 S3
7 3.98 5 20.4 S2 S2 N
8 1.78 5 64.4 N N N
9 4.56 5 8.8 S1 S1 S2
10 4.67 5 6.6 S1 S1 S3
11 1.56 5 68.8 N N N
12 4.56 5 8.8 S1 S1 N
13 4 5 20 S2 S1 N
14 4.7 5 6 S1 S1 S2
15 4.28 5 14.4 S1 S1 S3
16 4.32 5 13.6 S1 S1 S3
17 4.78 5 4.4 S1 S1 S2
18 4.21 5 15.8 S2 S1 S2
19 3.45 5 31 S2 S2 N
20 3.98 5 20.4 S2 S1 N
4. Conclusion
In this paper, fuzzy AHP and Boolean methods were evaluated for land suitability classifications for barley. GIS based land suitability classification needs maps of different parameters as inputs, as the effect of these parameters for land suitability evaluation is different, and therefore finding a relative weight of each parameter and finally overlay these maps is very important. In order to overcome these problems in the present study the fuzzy AHP method was used and compared with the standard FAO method. The results show that application of the fuzzy method is a promising way to determine land suitability. It provides an opportunity for assessment of the suitability of lands as a degree or grade of performance when the lands are used for agricultural purposes. By individual fuzzy indicators, it is possible to assess the suitability of lands as a degree or grade of performance for each attribute when the lands are used for agricultural purposes. Composite fuzzy gives the opportunity to obtain a weighted average estimation of land suitability across all of the attributes. It was concluded that the fuzzy AHP
method has a higher accuracy than the standard FAO method for land suitability analysis. Further development of the fuzzy AHP method would be advantageous for application in future studies into land suitability.
Acknowledgements
The authors would like to acknowledge the Khuzestan Soil and Water Research Institute for their assistance during the study and for providing the dataset.
References
Ahamed, T.R.N., K.G. Rao, J.S.R. Murthy, 2000. GIS-based fuzzy membership model for crop-land suitability analysis. Agricultural Systems. 63; 75–95. Bonham Carter, G.F, 1994. Geographic Information
Systems for Geoscientists: Modelling with GIS. Pergamon, Ontario, Canada.
Bradshaw, C.J.A., L.S. Davis, M. Purvis, Q. Zhou, G. L. Benwell, 2002. Using artificial neural networks to model the suitability of coastline for breeding by New Zealand fur seals (Arctocephalus forsteri). Ecological Modelling, 148; 111–131
Braimoh, A.K., P.G. Vlek, A. Stein, 2004. Land Evaluation for Maize Based on Fuzzy Set and Interpolation, Environmental Management, 33; 226– 238.
Burrough, P.A., 1989. Fuzzy Mathematical Methods for Soil Survey and Land Suitability. Journal of Soil Science, 40; 477-492.
Campbell, J.C., J. Radke, J.T. Gless, R.M. Wirtshafter, 1992. An application of linear programming and geographic information systems: cropland allocation in antique. Environment and Planning A, 24; 535–549. Ceballos Silva, A., J, Lopez Blanco, 2003. Evaluating biophysical variables to identify suitable areas for oat in Central Mexico: a multi-criteria and GIS approach. Agriculture, Ecosystems & Environment, 95; 371– 377.
Cengiz, T., C. Akbulak, 2009. Application of analytical hierarchy process and geographic information systems in land-use suitability evaluation: A case study of Dümrek village (Çanakkale, Turkey). International Journal of Sustainable Development & World Ecology, 16; 286–294.
Church, R.L., 2002. Geographical information systems and location science. Computers and Operations Research, 29; 541–562.
Cohen, J., 1960. Coefficient of agreement for nominal scales. Educational and Psychological Measurement, 20; 37-46.
Collins, M.G., F.R. Steiner, M. Rushman, 2001. Land-use suitability analysis in the United States: historical development and promising technological achievements. Environmental Management, 28; 611– 621.
FAO, 1976. A framework for land evaluation. Soils Bulletin, No. 32, Rome.
FAO, 1985. Guidelines: land evaluation for irrigated. Soils Bulletin, No: 55, Rome.
Hou, Y., Y. Liu, 2008. Application of decision tree on land suitability analysis. International conference on earth observation data processing and analysis (ICEODPA). Proceedings of the SPIE, 7285; 72854I.1–72854I.6.
Jankowski, P., N. Andrienko, G. Andrienko, 2001. Map-centered exploratory approach to multiple criteria spatial decision making. International Journal of Geographical Information Science, 15; 101–127. Kalogirou, S., 2002. Expert systems and GIS: an
application of land suitability suitability. Computers, Environment and Urban Systems, 26; 89–112. Kontos, T.D., D.P. Komilis, C.P. Halvadakis, 2003.
Sitting MSW landfills on Lesvos island with a GIS-based methodology. Waste Manag Res, 21; 262–278. Liu, M., A, Samal, 2002. A fuzzy clustering approach to
delineate agro eco zones. Ecological Modelling, 149; 215–228.
Liu, Y.S., Y.C. Hu, L.Y. Peng, 2005. Accurate quantification of grassland cover density in an alpine meadow soil based on remote sensing and GPS. Pedosphere, 15; 778-783.
Liu, Y.S., J.Y. Wang, L.Y. Guo, 2006. GIS-based assessment of land suitability for optimal allocation in the Qinling Mountains. China, Pedosphere, 16; 579– 586.
Lukasheh, A.F., R.L. Droste, M.A. Warith, 2001. Review of expert system (ES), geographical information system (GIS), decision support system (DSS) and their application in landfill design and management,Waste Manag Res, 19; 177–185.
Malczewski, J., 1999. GIS and Multicriteria Decision Analysis. Wiley, New York.
Malczewski, J., 2002. Fuzzy screening for land suitability analysis. Geographical and Environmental Modelling, 6; 27–39.
Malczewski, J., 2006. Ordered weighted averaging with fuzzy quantifiers: GIS-based multicriteria evaluation for land-use suitability analysis. International Journal of Applied Earth Observations and Geoinformation, 8; 270–277.
McBratney, A.B., I.O.A. Odeh, 1997. Application of Fuzzy sets in soil science: Fuzzy logic. Fuzzy measurements and Fuzzy decisions. Geoderma, 77; 85-113.
McHarg, I.L., 1969. Design with nature. Wiley, New York.
Miller, W., W.M.G. Collins, F.R. Steiner, E. Cook, 1998. An approach for greenway suitability analysis. Landscape and Urban Planning 42; 91–105. Mokarram, M., K. Rangzan, A. Moezzi, J. Baninemehc,
2010. Land suitability evaluation for wheat cultivation by fuzzy theory approache as compared with parametric method. Proceedings of the international archives of the photogrametry, remote sensing and spatial information sciences, Vol. 38, part II. pp. 1440-145.
Moreno, D., M. Siegel, 1988. A GIS approach for corridor sitting and environmental impact analysis. GIS/LIS 88, Proceedings of the third annual international conference, San Antonio, Texas 2. pp 507–514. Nikravesh, M., L. Zadeh, V. korotkikh, 2004. Fuzzy
partial differential equations and rational equations (reservoir characterization and modeling). Springer Verlag Berlin Heidelberg New York. pp. 1-79. Saaty, T.L., 1977. A scaling method for priorities in
hierarchical structures. Journal of Mathematical Psychology, 15; 234-281.
Saaty, T.L., 1980. The analytic hierarchy process: planning, priority setting, resource allocation, New York; London: McGraw-Hill International Book Co. Sener, B., M.L. Suzen, V. Doyuran, 2006. Landfill site
selection by using geographic information systems. Environ Geol, 49; 376–388.
Store, R., J. Kangas, 2001. Integrating spatial multi-criteria suitability and expert knowledge for GIS-based habitat suitability modelling. Landscape and Urban Planning, 55; 79–93.
Sys, C., E. Van Ranst, J. Debaveye, 1993. Land Suitability, part Ш: crop requirements. International Training Center for post graduate soil scientists. Ghent University, Ghent.
Sys, C., E. Van Rant, J. Debaveye, 1991. Land evaluation, part II: methods in land evaluation. General Administration for Development Cooperation, Brussels, Belgium.
Triantafilis, J., W.T. Ward, A.B. Mcbratney, 2001. Land suitability assessment in the Namoi Valley of Australia. Using a continuous model. Australian Journal of Soil Research, 39; 273–289.
Tseng, M.H., S.J. Chen, G.H. Hwang, M.Y. Shen, 2008. A genetic algorithm rulebased approach for land-cover classification. ISPRS Journal of Photogrammetry and Remote Sensing, 63; 202–212.
Yu, J., Y. Chen, J. Wu, 2009. Cellular automata and GIS based land use suitability simulation for irrigated agriculture. Proceeding of the 18th World IMACS/MODSIM congress, Cairns, Australia. pp. 3584–3590.
Zadeh, L.A., 1965. Fuzzy sets. Information and Control, 8; 338–353.