BREEDING & GENETICS
Relationships of Yield Component Variables to Yield and Fiber Quality Parameters
Frank E. Groves, Freddie M. Bourland*, and Don C. Jones
F.E. Groves, Frank Groves Farms, 38456 Hwy 17, Cotton Plant, AR 72036; F.M. Bourland*, Northeast Research & Extension Center, University of Arkansas, P.O. Box 48, Keiser, AR 72351; and D.C. Jones, Cotton Incorporated, 6399 Weston Parkway, Cary, NC 27513.
Corresponding author: [email protected]
ABSTRACT
Indirect selection for cotton yield using yield component variables may provide improved yield,
yield stability, and fiber quality. Data from irrigated
and non-irrigated tests conducted in 1999 through
2006 at four Arkansas locations were evaluated.
Parameters included lint yield (LY), basic yield components of number of seed per area (SPA) and lint index (LI), secondary yield components of seed
index (SI), number of fibers per seed (FPS), and fiber density (FDEN), lint percentage (LP), and seed percentage (SP), and fiber quality traits of
micronaire (MIC), length (LEN), uniformity index
(UI) and strength (STR). Seed index and LP were
dropped from further consideration due to
collin-earity. Locations and genotypes varied in most of the tests for most of the variables. Genotype × location (G×L) was most frequently found for LY and SPA and least frequently found for LEN and UI. Path coefficients from PathSAS were used to identify the direct effects and relationships among variables.
Higher instability was found in non-irrigated tests
and in tests of more recently developed genotypes. Lint yield was influenced by SPA, but SPA exhibits low heritability. Lint index was influenced by FPS, MIC and LEN with FPS having the strongest influ
-ence. Among the fiber quality parameters, MIC and
LEN had a negative relationship while UI and STR
had strong direct effects on LEN. Fiber density via FPS tended to be related to lower MIC. These data
suggest that FDEN could serve as a selection crite-rion for increased LY without negatively impacting
fiber quality traits.
E
ffective use of yield components may provide an opportunity to improve both the quantity and stability of yield production by upland cotton(Gossypium hirsutum L.) without adversely affecting
fiber quality. Lint yield of cotton is most simply defined as a function of number of seeds area-1
(SPA) multiplied by weight of fiber seed-1 (Lewis et al., 2000). Seed per area is the product of multiple yield components including number of plants area-1, bolls plant-1, and seed boll-1. Seed per area and many of its components may be affected by numerous biochemical reactions under quantitative genetic control and by environmental conditions (Bednarz et al., 2006).
Over the last 100 years, cotton breeders have seemingly come full circle in an attempt to identify appropriate cotton yield component selection criteria.
Cook (1908) suggested that lint index (grams of fiber
100 seed-1) could serve as an improved selection meth-od over the commonly used lint percentage methmeth-od. He proposed to select lines based upon the absolute weight of lint seed-1 instead of the relationship of lint to seed. Over a period of time, selection for increased lint index resulted in increased lint seed-1 accompanied by concurrent increased seed size.
Lint frequency, defined and used by Hodson (1920), measured the weight in grams of fiber of
uniform length produced cm-2 of seed surface area. This method served to select for improved yield while
standardizing seed size. Thurman (1953) refined lint
frequency with lint density index, which measured the
weight of fibers 100 cm-2 seed surface area. The lint density index included all lint on seed, and removed
the fiber length uniformity parameter used in deter -mining lint frequency. Lint density index was posi-tively correlated with lint percentage and lint index. Since lint percentage does not require an estimate of seed index or seed surface area, it has been widely used by most cotton breeding programs. Selection based upon lint percentage has led to increased lint yield, but has resulted in smaller seeded cultivars.
Breaux (1954) noted the majority of cotton
breed-ing programs were focusbreed-ing on fiber quality improve -ment. Additionally, he observed that high lint density and small- to medium-sized seed offered the best pos-sibility of obtaining high yielding lines. Mechanized
op-portunity to focus on lint yield improvement by directly measuring lint yield rather than yield components. In addition to harvested yield, multiple combinations
of lint and fiber parameters have served as selection
criteria. Among these, high lint percentage combined with an increased number of small- to medium-sized seeds has been the most utilized method (Bridge et al. 1971; Culp and Harrell 1975; Harrell and Culp 1976; Miller and Rawlings 1967).
Renewed interest in fiber quality and economic
sustainability has led to research designed to develop
improved yield components and fiber quality param -eters. Results from a multi-state, north Delta study observed a low correlation between lint yield and yield stability (Bourland et al., 2005; McNew et al., 2005). Results of their study also showed a negative correlation between micronaire and stability suggest-ing early matursuggest-ing, high micronaire cultivars were more stable in yield performance. A weak positive
correlation between number of fibers seed-1 (FPS)
and fiber weight seed-1 as related to yield stability was also observed. Fiber length was negatively cor-related with micronaire and FPS. Fiber length may
influence other high volume instrument (HVI) fiber
measurements including uniformity, strength and elongation (Smith and Coyle, 1997). Considering
the number of associated traits, fiber length would
be a likely source for yield variability.
Negative relationships between yield and fiber
quality traits have long restricted the genetic im-provement of cotton. If this were not true,
improve-ment in fiber quality would have accompanied recent
improvements of yield. Using data from the United States (U.S.) Regional High Quality Strain Test and Australia, Clement et al. (2012) showed that
nega-tive associations still exist between yield and fiber
quality. These negative associations were weaker in the Australian data than in the U.S. data.
Lint index (Lewis et al., 2000; Owens and Wal-lace, 2004) and lint frequency (Bednarz et al., 2006)
have been identified as possible selection criterion to
improve lint yield and stability. Lint index (LI, weight
of fibers 100 seed-1) is a function of seed surface area and selection for increased LI tends to result in larger
seeds. May (2004) found number of fibers per seed
(FPS) was correlated with lint yield and observed that lines with increased FPS tended to have larger seed size than those with fewer FPS. Large seed (with large cotyledons) may be advantageous under adverse environmental conditions, but may be unfavorable due to the inherent development of thinner seed coats
and lower lint percentages. In contrast, smaller seeds may improve lint percentage values, but have smaller cotyledons which could result in decreased plant stands, lower seedling vigor, and increased ginning problems (seed and/or seed fragments pulled through gin ribs with lint). Minton and Supak (1980) indicated medium-sized seed were optimal.
Yield components may be affected by several production factors. For example, plant density has been correlated with main stem nodes, monopodial branches (Bednarz et al., 2000) and other parameters such as lint percentage, boll size, seed index and micronaire (Bridge et al., 1973).
Yield stability and production sustainability might be enhanced by utilizing selection criteria
which include both fiber and seed parameters. Pre
-liminary evaluations of fiber density appear to show
promise as a selection criterion. Within the Univer-sity of Arkansas Cotton Breeding Program, FDEN
has been defined as the number of fibers mm-1 of seed surface area and estimated by dividing FPS by a de-rivative of seed index (Groves and Bourland, 2010). The use of FDEN would normalize seed size and decrease emphasis on increased SPA. Based on the energy requirements of seed production, this should
allow for increased efficiency of photosynthates and,
therefore, increased yield stability (Lewis 2001).
By selecting for increased fiber density, Clement et al. (2014) have improved fiber fineness without
adversely affecting yield.
The objective of this study was to evaluate the
relationships among certain fiber and yield compo -nent traits and their relation to yield over a range of cotton genotypes and environments. The goal of studying these relationships was to develop selection strategies that might improve yield and yield stability
without adversely affecting fiber quality.
MATERIALS AND METHODS
A total of 128 year × location sites were utilized as the database to evaluate relationships of lint yield,
yield components and fiber quality data. Data were
collected from four Arkansas locations including the Northeast Research and Extension at Keiser on
a Sharkey silty clay (very-fine, smectitic, thermic
Chromic Epiaquerts); the Delta Branch Station at
Clarkedale on a Dundee silt loam (fine-silty, mixed
active thermic Typic Endoaqualf); the Lon Mann Cotton Research Station at Marianna on a Calloway
Fragiudalfs); the Rohwer Research Station at Rohwer
on a Herbert silt loam (fine-silty, mixed, thermic
Aeric Ochraqualf). Following the 2004 season, the Clarkedale site was terminated and studies were initiated at the Judd Hill Cooperative Research Sta-tion near Trumann, which is approximately 44 km northwest of Clarkedale. These two locations share the same soil series, season length and management system. Therefore, these two locations were treated as a single site for these analyses.
Data were extracted from cultivar trials of the
Arkansas Cotton Variety Testing Program from 1999
through 2006 (Benson et al., 2001, 2002; Bourland et al., 2000, 2003, 2004, 2005, 2006, 2007). These years were chosen because data from duplicate ir-rigated and non-irir-rigated trials were available and
the data files included the specific yield component
variables. Non-irrigated trials were dropped from this testing program after 2006. Annual cultivar trials included two tests (Main Test and First-year Test) conducted at multiple locations. For each year, cultivars evaluated in the previous year of the
Ar-kansas Variety Test were included in the Main Test.
Otherwise, the cultivar was evaluated in the
First-year Variety Test. Both Main and First-First-year Variety Tests were evaluated annually in irrigated tests (V1ir and V2ir) at four locations, and in non-irrigated tests (V1ni and V2ni) at one or two locations. Over these years, the number of genotypes evaluated in V1 tests
ranged from 25 to 52 while the number of genotypes
in V2 tests ranged from 23 to 65.
Data were also collected from strain tests associ-ated with the University of Arkansas Cotton Breed-ing Program (Bourland, 2004; 2013). The strain tests (all irrigated) included an Advanced Strain Test (AST) and a New Strain Test (NST) conducted annu-ally from 1999 through 2006 at each of four locations listed above. Genotypes in the NST were selected F4:7 lines that were evaluated as Preliminary Strain Tests in the previous year. If a line performed well, it was promoted and evaluated for up to two years in the AST, then was either released or dropped from the program. Each strain test included 18 strains and two check cultivars. Data from the 2001 AST were excluded because the test included only 11 strains and one check cultivar.
Seed for all genotypes in the cultivar tests were submitted by their respective originators. Seed for genotypes in the AST and NST were produced and processed at the Northeast Research and Extension Center (Keiser, AR), so that there were no differences
among the genotypes with regard to seed source or processing. For all tests, plots were planted with a constant number of seed (about 13 seed/row m). All entries were planted in two-row plots on 0.96-m
centers, and ranged from 12.2 to 15.2m in length. Each test was arranged at each location in a random-ized complete block and replicated four times. For each cultivar and strain test, identical entries were evaluated each year at all locations, but entries dif-fered over years.
Although exact inputs varied across locations and years (Benson et al., 2001, 2002; Bourland et al., 2000, 2003, 2004, 2005, 2006, 2007), cultural inputs in each test were based on University of Arkansas Cooperative Extension Service recommendations for cotton production, including COTMAN rules for insecticide use, termination and defoliation. All plots were machine-harvested with two-row cotton pickers
modified with load cells for harvesting small plots.
Lint yield and SPA data were collected from four replications in each test. All other variables were de-termined using data derived from hand-harvested 50-boll samples taken from two replications of each test prior to machine harvest. The samples were bulks of 25 bolls from each row, with samples including all bolls from consecutive plants. The boll samples were ginned on a ten-saw laboratory gin (without lint cleaners) and weights of seed cotton, seed and
lint were determined. After ginning, High Volume Instrument (HVI) fiber parameters on each sample
were determined by the LSU AgCenter Cotton Fiber Lab (Baton Rouge, LA). In addition, two 50-seed sets of fuzzy seed were counted from each sample and weighed to determine seed index. If weights of the two sets varied more than a preset tolerance limit, additional sets of seed were counted and weighed.
The variables included:
●Lint yield: After converting weight of seed cotton harvested per plot to yield per hectare, lint yield was determined by multiplying seed cotton yield per hectare by lint percentage (averaged by loca-tion and entry within each test).
●Primary (or basic) yield component variables (Lewis et al., 2000):
RESULTS AND DISCUSSION
Analyses of Variables. Data for the ten variables were collected from 31 irrigated trials associated
with the V1ir, V2ir, AST and NST, which were
evaluated at four locations within each year. Sixteen
non-irrigated tests associated V1ni and V2ni were
evaluated over two locations for six years and at one location for two years. Identical entries were
included at all locations of each test (V1ir, V2ir, AST, NST, V1ni, and V2ni) each year.
Locations differed for most of the parameters within most years in the irrigated tests (Table 1). Given the variation in climatic and production condi-tions, location effects were expected, and indicated that the data represent a wide range of environments. Location effects were relatively lower in the non-irrigated tests compared to the non-irrigated tests (Table 2). These lower effects might be due to fewer non-irrigated test locations (two non-non-irrigated compared to four irrigated locations) or to greater unexplained variance in non-irrigated tests.
Genotypes differed for almost all of the variables in most of the tests. None of the irrigated tests had more than one year that genotypes did not differ (Table 1). In the non-irrigated tests, four of the variables (LY, SPA, UI, and MIC) lacked variation among genotypes in two of the eight years.
The genotype × location (G×L) interaction for
LY was significant in 90% of all irrigated tests (Table 1). For the basic yield component variables, signifi
-cant G×L’s were found in 84% of the tests for SPA, but only 29% of the tests for LI. For the secondary yield component variables, G×L was significant for SP (41% of tests), FDEN (26%), and FPS (16%).
Among all variables, G×L’s were most rarely found
for three fiber quality variables, LEN (13% of tests), STR (13%), and UI (10%). As expected, G×L oc
-curred more frequently for MIC (35% of tests) than any other fiber quality variable. Variables having
lower frequency of G×L’s might respond favorably to direct selection.
For the non-irrigated tests, G×L was significant in only 33% of tests for LY and for SPA, and did not exceed 42% for any of the variables in the
non-irrigated tests (Table 2). These lower occurrences of G×L’s associated with LY and SPA in non-irrigated tests may be associated with fewer number of sites and lower yields in non-irrigated tests. As found in the irrigated tests, the lowest incidence of G×L
oc-curred for the fiber quality variables.
Lint index: Weight (g) of lint per 100 seed was determined from boll sample data by dividing lint weight of ginned sample by the number of seed per sample (seed weight of sample divided by average seed weight) then multiplying by 100.
● Secondary yield component variables:
Lint percentage: the percentage of lint weight to seed cotton weight in each sample.
Seed percentage: the percentage of seed weight to seed cotton weight.
Seed index: Weight (g) of 100 fuzzy seed.
Fibers per seed: was estimated by dividing LI by
weight per fiber. Average weight per fiber was estimated as the product of (fiber length × length
uniformity × (micronaire / 1.0 × 10⁶)).
Fiber density: is an estimate of the number of fibers per mm2 of seed surface area and was calculated by dividing FPS by SSA, where SSA was estimated by the regression equation (SSA = 35.74 + 6.59SI) established by Groves and Bourland (2010).
● Fiber quality variables:
Micronaire: Fiber fineness is estimated by the rela
-tive degree of restriction to air flow caused with a standard weight of fiber.
Fiber length: The upper half mean length (mm) of
a beard of cotton fibers.
Length uniformity index: The degree of fiber length uniformity in a sample is expressed as
((mean length of fibers / LEN) × 100).
Strength: the force in grams required to break a
bundle of fibers equivalent to 1,000 meters of fiber.
Fiber strength is expressed in kN m kg-1.
Each variable (LY, SPA, LI, LP, SP, SI, FPS, FDEN, MIC, LEN, UI and STR) was analyzed as
a split plot with location as the whole plot (fixed effect), and genotype (fixed effect) as the subplot
on a yearly basis. All data were analyzed using the
PROC GLM procedure in SAS Version 9.1 (SAS
Institute, Cary, NC).
Data were analyzed as six categories of tests (V1ir, V2ir, AST, NST, V1ni, and V2ni). Multiple regres
-sion analysis was used to detect collinearity between independent variables. Two variables, LP and SI, were excluded because of collinearity with other variables. Once these collinear variables were excluded, a path diagram was established for the other ten variables, and
path coefficient analysis was conducted with PATH -SAS (Cramer et al., 1999). Path analysis uses multiple
regression coefficients to establish probable paths and
Table 1. Percentage of years that location, genotype and genotype × location interaction effects differed (P>0.10) in irrigated
trials of the Main (V1ir) and 1st year Arkansas Cotton Variety Tests (V2ir), Advanced Strain Tests (AST), and New Strain
Tests (NST) from 1999 through 2006
Testz Years Variable
y
LY SPA LI SP FPS FDEN LEN UI MIC STR
no. % of years with location differences
V1ir 8 100 100 100 100 100 100 100 100 100 100 V2ir 8 100 100 100 75 88 100 100 88 100 88 AST 7 100 100 100 86 71 86 100 86 100 100 NST 8 100 100 100 75 100 88 100 88 100 75
% of years with genotype differences
V1ir 8 100 88 88 100 88 88 100 88 88 100 V2ir 8 100 100 100 100 100 100 100 100 100 100 AST 7 86 100 100 100 100 100 100 86 100 100 NST 8 100 100 100 100 100 100 100 100 100 100
% of years with genotype × location differences
V1ir 8 88 72 25 50 13 38 0 0 38 13
V2ir 8 100 100 13 38 38 38 25 25 63 25
AST 7 71 86 71 71 14 14 29 0 43 14
NST 8 100 75 13 13 0 13 0 13 0 13
z V1ir included entries that had been evaluated in the previous year; V2ir included entries not previous evaluated.
Irrigated variety and strain tests were conducted at four locations each year.
y Variables included lint yield (LY), number of seed per area (SPA), seed percentage (SP), lint index (LI), number of fibers
per seed (FPS), fiber density (FDEN), upper-half mean fiber length (LEN), length uniformity index (UI), micronaire (MIC), and strength (STR).
Table 2. Percentage of years that location, genotype and genotype × location interaction effects differed (P>0.10) in
non-irrigated trials of the Main (V1ni) and 1st year Arkansas Cotton Variety Tests (V2ni) from 1999 through 2006
TestZ Years Variable
Y
LY SPA LI SP FPS FDEN LEN UI MIC STR
no. % of years that locations differed
V1ni 6 67 100 67 33 83 83 100 100 50 67 V2ni 6 100 100 50 33 67 83 100 83 67 67
% of years that entries differed
V1ni 8 75 75 100 100 100 100 100 88 75 100 V2ni 8 75 100 88 100 100 100 100 75 100 100
% of years that location × entry differed
V1ni 6 17 17 50 33 33 33 0 17 17 33
V2ni 6 50 50 17 50 50 50 17 17 0 17
Z V1ni included entries that had been evaluated in the previous year; V2ir included entries not previous evaluated.
Non-irrigated variety tests were conducted at two locations in 1999-2004, and at one location in 2005 and 2006.
Y Variables included lint yield (LY), number of seed per area (SPA), seed percentage (SP), lint index (LI), number of fibers
The lowest mean values for LY and SPA were associated with non-irrigated tests, while the greatest mean values were observed in irrigated tests (data not shown). Additionally, a much larger average and
range of C.V. were observed for the non-irrigated
tests compared to the irrigated tests. The greatest
influence of irrigation on fiber quality traits occurred
for MIC and LEN (data not shown). Non-irrigated tests had the lowest LEN values and the highest
MIC values. These findings support the findings of
McNew et al. (2003) and Lewis et al. (2000).
Across the ten yield, yield component, and fiber
traits, some general aspects were observed. First, prevalent location effects indicate that the
environ-ment strongly influenced the expression of these
variables. Secondly, genotype effects for most traits in most tests suggested that genetic variation exists
for the traits. Thirdly, significant location and G×L
effects were most frequently found associated with LY and SPA in the irrigated tests. The occurrence of G×L effects impedes direct selection for a trait.
This demonstrates the need for identification of yield
components for improving LY. Fourthly, irrigation
ap-peared to have the greatest influence on LY, SPA, LEN
and MIC. These data suggest that irrigation served as a stabilizing environmental factor. Finally, data from these 47 tests (45 with multiple locations) provide a wide range of environments and genetic backgrounds to evaluate the relationships of these ten traits.
Path Analysis and Models. All independent variables were subjected to regression analysis to identify potential collinearity. Collinear variables
were identified and removed as independent variables
for lint yield based upon degree of collinearity. This process continued until collinearity was alleviated. All
remaining significant variables were again subjected
to regression analysis to determine the strength of relationships. The fewest number of independent variables involved in the explanation of the greatest
amount of variation were included as influential. This
process continued for each variable and across all six
categories of tests (V1ir, V2ir, AST, NST, V1ni, and V2ni). Analysis for each test revealed similar path
models and a standard model was adopted.
Relationships associated with primary yield component traits. Across all six categories of tests, SPA had the greatest direct and total effects on LY.
The direct influence of this trait accounted for at least 84% of the contribution to LY in each test (Fig. 1-3). The greatest influence was observed in the non-irrigated tests, V1ni and V2ni with 90 and
91%, respectively (Fig. 3). The greatest total effect was also observed in V1ni and V2ni tests (Table 3), where SPA accounted for 95 and 89%, respectively.
Lint index has the second greatest total effect on LY in all tests.
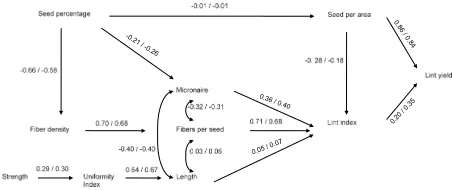
Figure 1. Sequential path model showing interrelationships among yield component and fiber quality variables that
contributed to cotton lint yield in Irrigated Main (V1ir) and Irrigated 1st year (V2ir) Cultivar Tests across four
Arkansas locations(Keiser, Clarkedale, Marianna and Rohwer in 1999 through 2006 with the Clarkedale location
was replaced by Judd Hill in 2005 and 2006). Coefficients
for V1ir and V2ir displayed left and right of slashes,
respectively.
Figure 2. Sequential path model illustrating interrelationships among yield component and fiber quality variables that
contributed to cotton lint yield in Advanced Strain Tests (AST) and New Strain Tests (NST) across four Arkansas locations (Keiser, Clarkedale, Marianna and Rohwer in 1999 through 2006 with the Clarkedale location was
replaced by Judd Hill in 2005 and 2006). Coefficients
for AST and NST displayed left and right of slashes,
respectively.
Figure 3. Sequential path model showing interrelationships among yield component and fiber quality variables that
contributed to cotton lint yield in Non-irrigated Main Cultivar Tests (V1ni) and Non-irrigated 1st year (V2ni)
at Keiser from 1999-2006 and at Marianna from 1999
These data suggest that SPA was the principle factor determining LY and are consistent with those of Culp and Harrel (1975) and Bednarz et al. (2006). Seed per area is a function of the number of plants per area and number of seed per plant. Since plant density was relatively constant in these tests, number of seed per plant determined SPA. Number of seed per plant is related to bolls per plant, which is to some degree determined by plant size. Water stress in non-irrigated trials directly affected plant size and bolls per plant.
Although SPA is an extremely important factor in determining LY, it generally exhibits low heritability
and is highly influenced by environmental conditions.
The effects of environmental conditions on SPA were demonstrated by the differences between irrigated and non-irrigated tests and by the high frequency of genotype × location interactions associated with SPA.
Seed per area had a negative influence on LI in
the irrigated tests (Fig. 1-2), but was less consistent in the non-irrigated tests (Fig. 3). The negative as-sociation with LI may have been associated with smaller seed sizes. Across tests with similar plant populations, SPA would likely be increased with smaller seeds and increased number of bolls. How-ever, with soil moisture as a limiting factor, plants produced fewer bolls and seed size increased. These
findings are consistent with those of Bednarz et al.
(2006) who observed increased lint percentages with reduced seed and boll sizes in modern cultivars.
Lewis et al. (2000) suggested that since more energy is required to produce seed than lint, LI should be a more stable contributor to LY than SPA. How-ever, these data showed less stability than expected.
The sum of path coefficients on a given trait should theoretically equal 1.0. Values greater than 1.0 would
indicate variability or instability. Lint index exhibited
a higher negative influence on LY and the sum of path coefficients was closer to 1.0 in the V1ir and AST than
in the other tests (Fig. 1-3). This suggests that lower yield stability was expressed in the non-irrigated tests
(Fig. 3) and in the more newly developed lines (V2ir
in Fig. 1 and NST in Fig. 2). Higher instability in the
non-irrigated tests (V1-ni and V2ni) was certainly
expected. Higher instability associated with newly
developed lines (V2ir and NST) might be associated
with less screening of these lines in Arkansas
envi-ronments. The V2ir and NST tests should represent a
wider range of genetic diversity including relatively
more poorly adapted genotypes than the V1ir or AST.
Decreased adaptability might explain the observed instability associated with LI in these irrigated trials.
Relationships associated with secondary yield component traits. Among the secondary yield compo-nent traits, FPS tended to have stronger total effect on yield than did FDEN and SP (Table 3). The direction of
direct influences of secondary yield component traits
on the SPA and LI was similar across all six categories of tests (Fig. 1-3). Seed percentage had essentially
no influence on SPA with path coefficients ranging from 0.08 in the V2ni (Fig. 3) to -0.05 in AST (Fig
2). Seed percentage is the near-reciprocal of LP, and would affect the weight of seed produced per area but appeared to be independent of SPA. Seed percentage was negatively related to MIC with effects greater in non-irrigated (Fig. 3) than in irrigated tests (Fig. 1-2).
Seed percentage also had a negative influence on FDEN across all tests with path coefficients ranging from -0.39 in NST (Fig. 2) to -0.66 in the V1ir (Fig. 1), and with values slightly higher in V1ir, V2ir, and AST compared to the V1ni, V2ni, and NST, respectively.
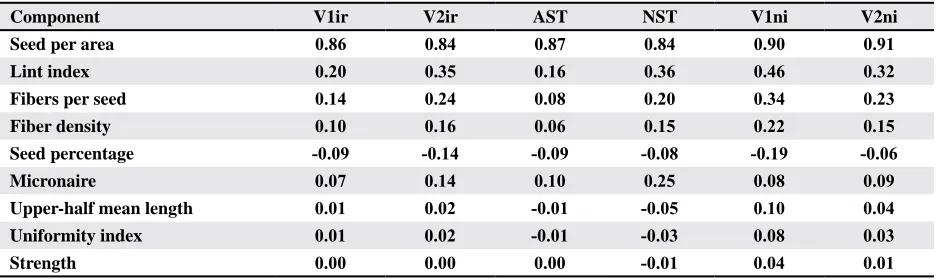
Table 3. Total effects of basic and secondary yield component traits and fiber quality traits on lint yield in cultivar (V1ir,
V1ni, V2ir & V2ni) and strain (S5&6) testsZ
Component V1ir V2ir AST NST V1ni V2ni
Seed per area 0.86 0.84 0.87 0.84 0.90 0.91 Lint index 0.20 0.35 0.16 0.36 0.46 0.32 Fibers per seed 0.14 0.24 0.08 0.20 0.34 0.23 Fiber density 0.10 0.16 0.06 0.15 0.22 0.15 Seed percentage -0.09 -0.14 -0.09 -0.08 -0.19 -0.06 Micronaire 0.07 0.14 0.10 0.25 0.08 0.09 Upper-half mean length 0.01 0.02 -0.01 -0.05 0.10 0.04 Uniformity index 0.01 0.02 -0.01 -0.03 0.08 0.03 Strength 0.00 0.00 0.00 -0.01 0.04 0.01
Z University of Arkansas Irrigated Main Cultivar Tests (V1ir), Irrigated 1st year Cultivar Tests (V2ir), Advanced Strain
Tests (AST), New Strain Tests (NST), Non-irrigated Main Cultivar Tests (V1ni), and Non-irrigated 1st year Cultivar Tests
Fibers per seed and LI were positively related in
every test with lower path coefficients in the strain
tests than in the irrigated and non-irrigated cultivar
tests (Fig. 1-3). The lower path coefficients may be
due to the lower genetic diversity associated with strain tests compared to cultivar tests. The same
argument could be made for the indirect influence of FPS on MIC and LEN. The indirect influence of FPS
on MIC appeared less negative for strain tests than for cultivar tests. The association of FPS on LEN appeared negative for the strain tests and positive for the cultivar trials.
The influence of FDEN on FPS was consistently strong in all tests (Fig. 1-3). Path coefficients ranged from 0.73 in NST to 0.63 in V1ni test. These values remained consistent despite varied influence from seed percentage on FDEN and the influence of envi -ronment or genetic diversity. These data suggest that
by normalizing seed surface area, the influence on
FPS would become more consistent. Therefore, FDEN could be an improved selection tool for yield stability. Relationships associated with fiber quality traits. Relative influences of fiber quality traits on yield were similar across tests. Average total effect of MIC on yield (0.12) was stronger than any other
fiber quality trait (Table 3). Average absolute values of the total effects of each of the other fiber quality traits were less the 0.04, indicating little total influ -ence on yield.
Direct effects of LEN and MIC were similarly and inversely related to each other in each category of tests (Fig. 1-3). As LEN increased, MIC tended
to decline. The coarseness of fibers (MIC) tends
to decrease as the synthesized carbohydrates are
dispersed into longer fibers. The magnitude of path coefficients associated with the direct effects of MIC
and LEN on LI differed among categories of trials, being strongest in the strain tests and weakest in the non-irrigated cultivar tests. Length was weakly related to LI in each test.
These data suggest that MIC had a greater influ -ence in strains developed in the University of Arkan-sas Cotton Breeding program than in cultivars from other sources (Fig. 1-3). For the strain tests, MIC was the dominant trait associated with LI. However, that was not the case for the cultivar trials, which tested a much wider genetic base. For both irrigated and non-irrigated cultivar tests, FPS was the most
influential trait on LI.
Uniformity index was consistently strong and positively related to LEN for each category of test
(Fig 1-3). The non-irrigated trials tended to have
greater path coefficients (0.75 and 0.83) for UI on
LEN than the irrigated trails, which suggest that LEN is more sensitive to UI under moisture stressed conditions. Strength tended to be positively related to
UI, with coefficients ranging from 0.29 to 0.50 with highest coefficients in the non-irrigated tests (Fig 3). Again, the influence of the trait was increased under
moisture stressed environments.
Summary of Relationships. These findings high
-light the effect of genetic and environmental influ
-ences on yield components and fiber quality traits. The direction and magnitude of influences of the
traits on each other were relatively similar over all of the categories of tests. Compared to the irrigated cultivar and strain tests, non-irrigated cultivar tests
exhibited increased influence for five interrelation -ships (SPA-LY, SP-MIC, LEN-LI, STR-UI, and UI-LEN), two of which involved the primary yield components, LI and SPA (Fig. 1-3).
Genetic influence was evident when compari -sons between strain tests and cultivar tests were made. Limited genetic diversity among the geno-types in the strain tests contributed to differences between strain and cultivar tests. Compared to strain tests, irrigated cultivar tests had a decreased MIC-LI relationship and an increased FPS-LI rela-tionship (Fig. 1 and 2). Similar values, but contrast-ing signs were observed for LEN-LI and FPS-LEN relationships. However, variation in diversity had
little influence on relationships involving basic
yield components or the relationship between FDEN and FPS.
Relationships associated with FPS and FDEN were largely consistent across varying genetic and
environmental influences (Fig. 1-3). The consistent
relationship among variables related to basic yield components would infer yield stability is attainable.
Consistency for any selection index is difficult when
components vary. Unfortunately, FPS is subject to variation in seed size. By normalizing seed size, FDEN should be more stable over time. As a selec-tion index, FDEN could provide a much-needed
emphasis on fiber quality while maintaining yield
stability.
ACKNOWLEDGEMENT
REFERENCES
Bednarz, C.W., D.C. Bridges, and S.M. Brown. 2000. Analy-sis of cotton yield stability across population densities. Agron. J. 92:128-135.
Bednarz, C.W., R.L. Nichols, and S.M. Brown. 2006. Plant
density modifications of cotton within-boll yield compo -nents. Crop Sci. 46:2076-2080.
Benson, N.R., F.M. Bourland, W.C. Robertson, J.M. Horn-beck, and F.E. Groves. 2001. Arkansas cotton variety tests 2000. Arkansas Agric. Exp. Stn. Research Series 481.
Benson, N.R., F.M. Bourland, A.B. McFall, J.M. Hornbeck and F.E. Groves. 2002. Arkansas cotton variety tests 2001. Arkansas Agric. Exp. Stn. Research Series 491.
Bourland, F.M. 2004. Overview of the University of Arkan-sas cotton breeding program. p. 1093-1097. In Proc. Beltwide Cotton Conf., San Antonio, TX. 5-9 Jan. Natl. Cotton Counc. Am., Memphis, TN.
Bourland, F.M. 2013. Novel approaches used in the Univer-sity of Arkansas cotton breeding program. p. 409-418. In
Proc. Beltwide Cotton Conf., San Antonio, TX. 7-10 Jan. Nat’l, Cotton Counc. Am., Memphis, TN.
Bourland. F.M., N.R. Benson, J.M. Hornbeck and C.D. Capps, Jr. 2000. Arkansas cotton variety tests 1999. Arkansas Agric. Exp. Stn. Research Series 473.
Bourland. F.M., B.S. Brown, J.M. Hornbeck, R.C. Doherty and W.C. Robertson. 2005. Arkansas cotton variety tests 2004. Arkansas Agric. Exp. Stn. Research Series 526.
Bourland, F.M., B. S. Brown, J.M. Hornbeck, K. Kaufman,
and W.C. Robertson. 2006. Arkansas Cotton Variety Test
2005. Ark. Agric. Exp. Stn. Research Series 538.
Bourland, F.M., B.S. Brown, J.M. Hornbeck, and K. Kaufman. 2007. Arkansas cotton variety test 2006. Arkansas Agric. Exp. Stn. Research Series 547.
Bourland. F.M., S.B. Jackson, J.M. Hornbeck and F.E. Groves. 2004. Arkansas cotton variety tests 2003. Arkansas Agric. Exp. Stn. Research Series 513.
Bourland. F.M., J.T. Johnson, S.B. Jackson, M.W. Duren, J.M. Hornbeck, F.E. Groves, and W.C. Robertson. 2003. Arkansas cotton variety tests 2002. Arkansas Agric. Exp.
Stn. Research Series 501.
Bourland, F., R. McNew, B. Phipps, C. Craig, and O.
Gwath-mey. 2005. Stability of yield and fiber quality in the
north Delta: II. Comparison of varieties. p. 987. In Proc. Beltwide Cotton Prod. Conf., New Orleans, LA. 47 Jan. Nat’l. Cotton Counc. Am., Memphis, TN.
Bridge, R.R., W.R. Meredith, and J.F. Chism. 1971. Compara-tive performance of obsolete varieties and current variet-ies of upland cotton. Crop Sci. 11:29–32.
Bridge, R.R., W.R. Meredith, Jr., and J.F. Chism. 1973. Influ -ence of planting method and plant population on cotton (Gossypium hirsutum L.). Agron J. 65:104-109. Breaux, R.D. 1954. A genetic analysis of the major
compo-nents of yield in American upland cotton. Ph.D. disserta-tion. Louisiana State University.
Clement, J.D., G.A. Constable, and S.M. Liu. 2014.
Increas-ing cotton seed fibre density as a breedIncreas-ing strategy to improve fibre fineness. Field Crops Res. 160:81-89.
Clement, J.D., G.A. Constable, W.N. Stiller, and S.M. Liu. 2012. Negative associations still exist between yield and
fibre quality in cotton breeding programs in Australia
and USA. Field Crops Res. 128:1-7.
Cramer, C.S., T.C. Wehner, and S.B. Donaghy. 1999.
PATH-SAS: a SAS computer program for path coefficient
analysis of quantitative data. J. Hered. 90:260-262.
Cook, O.E. 1908. Danger in judging cotton varieties by lint percentage. U.S.D.A Bur. Plant Ind., Cir. 11.
Culp, T.W., and D.C. Harrell. 1975. Influence of lint percent -age, boll size, and seed size on lint yield of upland cotton
with high fiber strength. Crop Sci. 15:741–746.
Groves, F.E., and F.M. Bourland. 2010. Estimating seed sur-face area of cottonseed. J. Cotton Sci. 14:74-81. Avail-able at http://www.cotton.org/journal/2010-14/2/upload/ JCS14-74.pdf
Harrell, D.C., and T.W. Culp. 1976. Effects of yield
com-ponents on lint yield of upland cotton with high fiber
strength. Crop Sci. 16:205–208.
Hodson, E.A. 1920. Lint frequency in cotton with a method for determination. p. 3-11. Arkansas Agric. Exp. Stn. Bul. 168.
Lewis, H. 2001. A review of yield and quality trends and components in American upland cotton. p. 1447-1452. In
Proc. Beltwide Cotton Prod. Conf., Anaheim, CA. 9-13 Jan. Nat’l. Cotton Counc. Am., Memphis, TN.
Lewis, H., L. May, and F. Bourland. 2000. Cotton yield com-ponents and yield stability. p. 532-537. In Proc. Beltwide Cotton Prod. Conf., San Antonio, TX. 4-8 Jan. Nat’l. Cotton Counc. Am., Memphis, TN.
May, O.L. 2004. Directional selection for average weight of
fibers per seed. p. 1192. In Proc. Beltwide Cotton Prod. Conf., San Antonio, TX. 5-9 Jan. Nat’l. Cotton Counc. Am., Memphis, TN.
McNew, R., O. Gwathmey, C. Craig, B. Phipps, and F.
Bourland. 2005. Stability of yield and fiber quality in
the north Delta: I. Evaluation of methods. p. 981-986. In
Proc. Beltwide Cotton Prod. Conf., New Orleans, LA. 47 Jan. Nat’l. Cotton Counc. Am., Memphis, TN.
Minton, E.B., and J.R. Supak. 1980. Effects of seed density
on stand, Verticillium wilt, and seed and fiber characters
of cotton. Crop Sci. 20:345-347.
Owens, B. and T. Wallace. 2004. Comparison of methods for
estimating fibers per seed. p. 114. In Proc. Beltwide Cot-ton Prod. Conf., San AnCot-tonio, TX. 5-9 Jan. Nat’l. CotCot-ton Counc. Am., Memphis, TN.
Smith, C.W., and G.G. Coyle. 1997. Association of fiber
quality parameters and within-boll yield components in upland cotton. Crop Sci. 37:1775-1779.