in the population sciences published by the Max Planck Institute for Demographic Research Konrad-Zuse Str. 1, D-18057 Rostock · GERMANY www.demographic-research.org
DEMOGRAPHIC RESEARCH
VOLUME 11, ARTICLE 4, PAGES 95-110
PUBLISHED 27 August 2004
www.demographic-research.org/Volumes/Vol11/4/
DOI: 10.4054/DemRes.2004.11.4
Research Materials
Demographic trends in Sweden:
An update of childbearing and
nuptiality up to 2002
Gunnar Andersson
1 Our update 96
2 Fluctuating fertility in Sweden – at present being manifested
in increasing birth rates
97
3 Long-term decline in the propensity to marry – but a
moderate upsurge in marriage formation at the turn of the century
97
4 Long-term increase in Swedish divorce risks – but no
further increases 2001-2002
98
5 Acknowledgments 98
Notes 98
References 99
Research Materials
Demographic trends in Sweden:
An update of childbearing and nuptiality up to 2002
Gunnar Andersson 1
Abstract
In the present note, we present the main features of recent trends in vital family-demographic behavior in Sweden. For this purpose, published indices of marriage, divorce, and childbearing risks by calendar year are updated by adding another two or three years of observation to our series. We demonstrate that the latest trend reversal in Swedish birth rates, which occurred at the end of the 1990s, continued to manifest itself in increasing propensities for childbearing during the early years of the 21st century. The rise pertains to all birth orders. Marriage propensities showed an increase as well, however, to a large extent expressed in a short-term development that was prevalent at the turn of the millennium. The previous long-term trend of rising divorce risks leveled off during the first two years of the new century.
1
1. Our update
We provide an update of previous presentations on trends in family-demographic behavior of women in Sweden (see Andersson and Liu 2001 for the most recent version), covering childbearing and nuptiality developments up to 2002. These trends are presented in the form of a number of calendar-year indices on childbearing, marriage, and divorce risks (Figures 1-8). As an additional service, we attach an Excel file that contains the calendar-year indices themselves to the electronic version of this note, published in Demographic Research.
Our calculations are based on data derived from the Swedish population registers, made available to us by Statistics Sweden. We have access to information on the dates of all births and civil-status changes in Sweden of all registered women born in that country. Our childbearing analyses are based on women born in Sweden since 1925, with a presentation of childbearing trends in 1961-2002. Divorce registers were not reliable before 1968; therefore we restricted our study on civil-status changes to 1971 and onwards. It is based on women born in Sweden after 1945.
2. Fluctuating fertility in Sweden – at present being manifested in
increasing birth rates
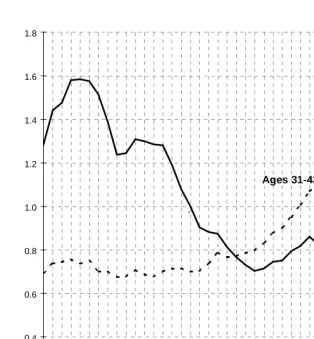
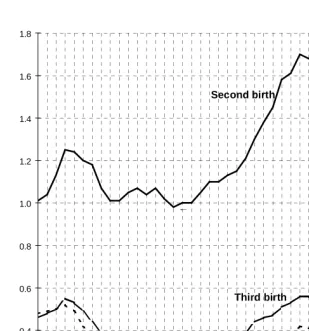
In recent decades, childbearing trends in Sweden have been highly volatile (Andersson 1999; for a comparison with neighboring Denmark and Norway, see Andersson 2004). First-birth fertility of younger women declined continuously from the mid-1960s to the mid-80s; from the early 80s it rose markedly for women in their 30s and 40s, altogether reflecting a general postponement of entry into motherhood (Figure 1). During the 1980s, birth propensities increased for younger childless women, too, as well as for mothers at various parities (Figures 1-3). The 1990s, by contrast, were characterized by strong declines in birth risks. As in the 1980s, this trend was followed by practically all demographic sub-groups of women. We have observed yet another uniform trend reversal towards the end of the 1990s, however (Andersson and Liu 2001): Birth propensities of mothers (Figures 2-3) and childless women aged 31 and above (Figure 1) experienced another increase after 1997. The rise continued without interruption through 2001 and 2002. For younger childless women (Figure 1), a new trend can be noted too, as birth propensities have remained stable during the five years since 1998. As for our update, this also holds for 2001-2002. Interestingly, the trend reversal in 1998 is not evident if access is restricted to aggregate data such as the Total Fertility Rate (see Appendix: Figures A1-A2). Sweden saw a TFR of 1.50 in 1998 and 1999, the lowest ever recorded for that country. (This compares to 1.65 in 2002.) Our presentation enables deeper insights into the underlying behavior of different subgroups of Swedish women, revealing to greater precision the occurrence of important changes in childbearing dynamics.
3. Long-term decline in the propensity to marry – but a moderate
upsurge in marriage formation at the turn of the century
marriage-formation intensities of the never-married indicates that the turn of the millennium may have caused an additional number of people to enter marriage in that year. Nevertheless, marriage propensities have remained higher in 2001 and 2002 than immediately before this last upsurge. It remains to be seen whether this constitutes a lasting development.
4. Long-term increase in Swedish divorce risks – but no further
increases 2001-2002
The divorce risk rose sharply in 1974 in response to the liberalization of divorce legislation in that year. From the end of the 1980s onwards, standardized divorce risks have increased again but this time more gradually (Andersson 1997). The rise in 1974 was mainly due to a growing propensity for divorce among childless women, while the increase from the late 1980s onwards can be attributed to a rise in divorce risks for mothers, who constitute the vast majority of married women. The update reveals that the trend of increasing divorce risks leveled off during the first two years of the 21st century (Figures 7-8).
5. Acknowledgments
I thank the anonymous reviewers of Demographic Research for their very helpful suggestions and comments. In addition, I thank Susanne Backer for language editing.
Notes
References
Andersson, G., 1997. The impact of children on divorce risks of Swedish women.
European Journal of Population 13: 109-145.
Andersson, G., 1998. Trends in marriage formation in Sweden 1971-1993. European
Journal of Population 14: 157-178.
Andersson, G., 1999. Childbearing trends in Sweden 1961-1997. European Journal of
Population 15: 1-24.
Andersson, G., 2001. Trends in childbearing and nuptiality in Sweden, 1961(71)-1997. In: Tedebrand, L.-G., Sköld, P. (Eds.): Nordic Demography in History and
Present-day Society. Umeå, Sweden: Umeå University, 67-100.
Andersson, G., 2004. Childbearing developments in Denmark, Norway, and Sweden from the 1970s to the 1990s: A comparison. Demographic Research Special Collection 3(7): 155-176. Available at: http://www.demographic-research.org.
Andersson, G., and Liu Guiping, 2001. Demographic trends in Sweden: Childbearing developments in 1961-1999, marriage and divorce developments in 1971-1999.
Demographic Research 5: 65-78. Updated as: Demographic trends in Sweden:
Childbearing developments in 1961-2000, marriage and divorce developments in 1971-1999. Demographic Research 5: A1-A14. Available at:
http://www.demographic-research.org/Volumes/Vol5/3.
Hoem, J.M., 1991a. To marry, just in case ...: the Swedish widow’s-pension reform and the peak in marriages in December 1989. Acta Sociologica 34: 127-135.
Hoem, J.M., 1991b. La standardisation indirecte améliorée et son application à la divor-tialité en Suède (1971-1989). Population 46: 1551-1568.
Hoem, J.M., 1993. Classical demographic methods of analysis and modern event-history techniques. IUSSP: 22nd International Population Conference,
Figure 1: Annual index of first-birth rates. Swedish childless women, 1961-2002, by group of ages, standardized for age in single years.
0.0 0.2 0.4 0.6 0.8 1.0 1.2 1.4 1.6 1.8
1965 1975 1985 1995
Rates relative to rates of younger women in 1977
Ages 31-43
Ages 16-28
Figure 2: Annual index of second-, third-, and fourth-birth rates. Swedish mothers, 1961-2002, by birth order, standardized for age of mother and duration since previous birth.
0.0 0.2 0.4 0.6 0.8 1.0 1.2 1.4 1.6 1.8
1965 1975 1985 1995
Rates relative to second births in 1977
Third birth
Fourth birth
q
Figure 3: Annual index of second-, third-, and fourth-birth rates. Swedish mothers, 1961-2002, by birth order, standardized for age of mother and duration since previous birth.
0.0 0.5 1.0 1.5 2.0 2.5 3.0
1965 1975 1985 1995
Rates relative to 1977 for each birth order (separate models for each order)
Second birth
Third birth Fourth birth
Figure 4: Annual index of marriage-risk level. Never-married Swedish women, 1971-2002, standardized for parity and age.
0.0 0.5 1.0 1.5 2.0 2.5
1971 1975 1979 1983 1987 1991 1995 1999
Risks relative to 1980
Figure 5: Annual index of marriage-risk level. Never-married Swedish women, 1971-2002, by parity, standardized for age.
0.0 0.5 1.0 1.5 2.0 2.5
1971 1975 1979 1983 1987 1991 1995 1999
Risks relative to one-child mothers in 1980
parity 0
parity 1
parity 2
parity 3
Figure 6: Annual index of remarriage-risk level. First-divorced Swedish women, 1971-2002, by parity, standardized for age and time since divorce.
Note: Relative risk in 1989 for women with new child after the divorce = 5.09. 0.0
0.5 1.0 1.5 2.0 2.5 3.0
1971 1975 1979 1983 1987 1991 1995 1999
Risks relative to childless women in 1980
no child
child from previous marr. / no new child
new child after the divorce
Figure 7: Annual index of divorce-risk level. First-married Swedish women, 1971-2002, standardized for age at marriage, parity, premarital childbearing, 0.0
0.5 1.0 1.5 2.0 2.5
1971 1975 1979 1983 1987 1991 1995 1999
Figure 8: Annual index of divorce-risk level. First-married Swedish women, 1971-2002, by parity, standardized for age at and duration of marriage. Risks for mothers also standardized for duration since previous birth and premarital childbearing.
0.0 0.5 1.0 1.5 2.0 2.5 3.0
1971 1975 1979 1983 1987 1991 1995 1999
Risks relative to one-child mothers in 1980
parity 0
parity 1
parity 2
Figure A1: Annual index of first-birth rates (as of Figure 1) vs TFR of Sweden, 1961-2002. 0.0 0.2 0.4 0.6 0.8 1.0 1.2 1.4 1.6 1.8
1961 1965 1969 1973 1977 1981 1985 1989 1993 1997 2001
Figure A2: Annual index of second-, third-, and fourth-birth rates (as of Figure 2) vs
TFR of Sweden, 1961-2002.
0.0 0.2 0.4 0.6 0.8 1.0 1.2 1.4 1.6 1.8
1961 1965 1969 1973 1977 1981 1985 1989 1993 1997 2001