in the population sciences published by the Max Planck Institute for Demographic Research Konrad-Zuse Str. 1, D-18057 Rostock · GERMANY www.demographic-research.org
DEMOGRAPHIC RESEARCH
VOLUME 16, ARTICLE 11, PAGES 315-374
PUBLISHED 27 APRIL 2007
http://www.demographic-research.org/Volumes/Vol16/11/ DOI: 10.4054/DemRes.2007.16.11
Research Article
Cohort birth order, parity progression
ratio and parity distribution trends
in developed countries
Tomas Frejka
Jean-Paul Sardon
© 2007 Frejka & Sardon
This open-access work is published under the terms of the Creative Commons Attribution NonCommercial License 2.0 Germany, which permits use, reproduction & distribution in any medium for non-commercial purposes, provided the original author(s) and source are given credit.
2 The data 317
3 A summary of main findings of the project to date 318
4 Birth order levels and trends 319
4.1 First births 319
4.2 Second births 323
4.3 Third births 325
4.4 Fourth and higher order births 327
5 Cohort mean ages of birth orders 329
6 The age structure of birth orders 334
7 Fertility of older women 336
8 Fertility of young women 338
9 Birth order trends, parity progression and parity distribution in selected countries
341
9.1 Denmark 341
9.2 England & Wales 350
9.3 Netherlands 357
9.4 Italy 359
9.5 Czech Republic 362
9.6 Romania 366
9.7 United States 369
10 Conclusions 372
11 Acknowledgements 373
Cohort birth order, parity progression ratio and
parity distribution trends in developed countries
Tomas Frejka 1
Jean-Paul Sardon 2
Abstract
Major changes in childbearing patterns are continuously taking place in the majority of low-fertility populations with postponement being virtually universal. Almost everywhere the two-child family became dominant. Proportions of childless women and one-child families were increasing recently. Changes in childbearing patterns in Central and Eastern Europe have been profound justifying the label of an historic transformation. Young women are bearing considerably fewer children compared to older cohorts. Especially proportions of women having second births in most CEE countries were declining rapidly and these were lower than in western countries. Postponement of childbearing might be nearing cessation in some western countries.
1
Independent consultant, Max Planck Institute for Demographic Research, Rostock, Germany
1. Introduction
It is now well known that levels and trends in period total fertility rates can be inflated or deflated by the timing, postponement or anticipation, of childbearing (Hajnal 1947, Henry 1953, Ryder 1951, Whelpton 1954, Bongaarts and Feeney 1998).
For two to three decades in the middle of the 20th century in western countries the quantum of fertility was increasing, and, in addition, period fertility was being augmented by a shift of childbearing into younger ages. This was the era of the “baby boom.” In South European countries this process took place with a time lag of about a decade. At the same time, in Central and East European countries the quantum of fertility was stable coupled with only a moderate anticipation of childbearing.
Profoundly changing economic, social and cultural circumstances modifying fertility emerged in the 1960s in the industrialized western countries (Hobcraft and Kiernan 1995), which engendered a fertility quantum decline and started an enduring postponement of childbearing. Roughly analogous developments occurred in the South European countries, again with a one to two decades delay. In Central and East European countries the historical political events around 1990 which brought down the authoritarian regimes also entailed radical transformations in the economic, social and cultural environment conditioning family formation and fertility. As a result fertility quantum declined rapidly and apparently childbearing postponement was also taking root. Exceptionally moderate fertility reductions and delays started prior to the momentous political transitions.
In 1999 Calot, Frejka and Sardon started to work on a project investigating childbearing levels and trends in low fertility countries during the 20th century from a cohort perspective. A preliminary report was published in the Population and
Development Review (Frejka, Calot 2001). Since then about a dozen papers were
published, in 2004 a comprehensive report came out in book form (Frejka, Sardon 2004), and an update was presented at the 2005 IUSSP Conference (Frejka, Sardon 2005).
We begin with a brief section on data and a short summary of findings of the project to date. The next part discusses birth order levels and trends. We then continue with an investigation of the timing of childbearing by analyzing a variety of measures: (a) the cohort mean age of the respective birth order; (b) the crude age structure of the respective birth order in cohorts that have effectively completed their childbearing; (c) trends in cumulated rates of the respective birth order in older and young women. Finally, we turn to detailed analyses of age patterns of the respective birth order in cohorts that have completed childbearing and in cohorts that are still at various stages of their reproductive period; trends of parity progression ratios; and trends in parity distributions in specific countries.
Most of the analysis deals with cohorts that had already concluded their childbearing; the last such cohorts scrutinized tend to be those of the mid- to late 1960s. Thus the respective conclusions are relevant mainly with respect to the last decades of the 20th century. -- There are sections in which the analysis deals exclusively or in part with young women, i.e. with women that had not yet reached the end of their reproductive periods. In these sections cohorts of the 1970s (up to and including the 1980 cohort) are included. This is important to keep in mind, because these are the cohorts whose childbearing behavior was reflected in the period fertility rates of the late 1990s and the early 21st century.
2. The data
In distinction to the overall project in which 35 low fertility country populations were part of the investigation, only 27 are analyzed in this paper; seven imperfectly representative populations are investigated in greater detail. These data were gathered at the Institut National d'Études Démographiques in Paris since the end of the 1970s and since 1996 by the Observatoire Démographique Européen, which was founded by Gérard Calot and of which Jean-Paul Sardon has been director in recent years3.
The series of cohort fertility data for some countries end earlier than for others. The series for the United States that include data based on statistics for recent years are currently being prepared at the U. S. National Center for Health Statistics and will not be released until late in 2006. Therefore these series are shorter than for other countries. For instance, for the 1970 birth cohort age-specific fertility rates are available up to age 33 for the Czech Republic, Denmark, Hungary and the Netherlands, but only up to age
3
25 for the United States. For Greece and Romania these are available up to age 32; for England & Wales up to age 30; and for Italy up to age 26.
Wherever any data include estimated values these are based on calculations in which less than 5 percent of the respective measure is estimated. This is in contrast to the estimation criterion used earlier, namely 15 percent (cf. Frejka, Sardon 2004). -- Throughout most of the investigation rates of the second kind are used, i.e. the number of occurrences-births is related to all women of the respective age category, not only to those exposed to the risk of having a birth of a specific birth order. The logical exception are parity progression ratios, which are necessarily rates of the first kind.
3. A summary of main findings of the project to date
The analysis for the low-fertility countries presented in the book and in the IUSSP update (Frejka, Sardon 2004 and 2005) came to the following principal substantive conclusions. Childbearing has never been as low as at the outset of the 21st century. In most countries, a moderate fertility decline is likely to continue during the first decade. A fertility increase in the foreseeable future is unlikely. Incipient signs of fertility plateaus are apparent. Rates of recuperation among older women are slowing down. A low fertility plateau might be reached in individual countries with completed cohort fertility as low as 1.3 or less and probably no higher than 2.0 births per woman. The analysis implies that increases of total period fertility rates, including those of adjusted TFRs, in most countries are not a reflection of increases in cohort childbearing, but a result of lesser postponement of births.
Levels and trends of various facets concerning first births are continuously changing (Frejka, Sardon 2006). The evidence confirms that the postponement of first births is an ongoing and persisting process which started in western countries among cohorts of the 1940s, but only in the 1960s cohorts in Central and Eastern Europe. The mean age of women having first births is universally rising. Fertility of older women was increasing. The decline in childbearing of young women is robust among the cohorts of the late 1960s and the 1970s; in Southern Europe as well as in Central and Eastern Europe the rates of decline have accelerated. Childbearing behavior in the formerly socialist countries is in transition to a different regime.
4. Birth order levels and trends
The most prevalent feature of trends in cohort fertility in the developed countries of any birth order is decline among the cohorts born during the 1960s, i.e. those ending their reproductive careers early in the 21st century. In some countries and at some birth orders a leveling off has occurred, but not a single case of notable increase has taken place.
4.1 First births
Long-term regional trends were evident in the levels and trends of first births (Figure 1). Most western countries experienced increases in the first birth TCFRs among cohorts of the 1920s and 1930s. These reached a peak among the 1940s cohorts and from thereon started to decline. The United States population was about a decade ahead of the general trend.
In contrast, first birth TCFRs in Central and East European countries were high and stable from the cohorts of the 1930s through those of around 1960, with a considerable decline thereafter.
A smaller amount of data for the Nordic and South European countries also indicate regional similarities between countries, albeit less pronounced.
In the 1960s birth cohorts in most countries between 83 and 90 percent of women had a first birth (Figure 1 and Table 1). In some countries the proportions were as low as 80 percent, implying that around 20 percent were remaining childless. Exceptionally around 95 percent of women had first births with only about five percent remaining childless4.
In practically all the South, Central and East European countries first birth TCFRs were declining quite rapidly among the 1960s cohorts. A moderate first birth TCFR descent was also taking place in Finland, Austria and England & Wales. In most Nordic countries, the Netherlands and the United States, the first birth TCFRs were quite stable (Figure 1).
4
Figure 1: First birth total cohort fertility rates, selected countries, birth cohorts 1915-1972
Panel A
Western countries
0.75 0.80 0.85 0.90 0.95 1.00
1915 1920 1925 1930 1935 1940 1945 1950 1955 1960 1965 1970 1975
Birth cohort
F
irs
t bi
rt
h
TC
FR
Denmark Finland Norway Sweden England &Wales Netherlands Austria United States
Panel B
Central and East European countries
0.75 0.80 0.85 0.90 0.95 1.00
1915 1920 1925 1930 1935 1940 1945 1950 1955 1960 1965 1970 1975
Birth cohort
Fi
rs
t bi
rt
h
T
C
F
R
Czech Republic
Hungary
Poland
Slovak Republic
Romania
Figure 1: (continued) First birth total cohort fertility rates, selected countries, birth cohorts 1915-1972
Panel C
South European countries
0.75 0.80 0.85 0.90 0.95 1.00
1915 1920 1925 1930 1935 1940 1945 1950 1955 1960 1965 1970 1975
Birth cohort
Fir
s
t bir
th T
C
FR
Greece
Italy
Portugal
Spain
The source for this and all subsequent figures and tables: Observatoire Démographique Européen.
Table 1: First, second, third, fourth and higher birth order total cohort fertility rates, selected low fertility countries, birth cohorts 1930, 1940, 1950, 1960 and the latest available (see notes)
Total cohort fertility rates of cohort born in Annual change between birth
cohorts (percent)
Country
1930 1940 1950 1960 1965 Latest
available
1930-1940
1940-1950
1950-1960
1960-1965 1965-latest
First births
Denmark … … … 0.899 0.873 0.878l … … … -0.6 0.2
England & Wales 0.870 0.893 0.861 0.811 … 0.796h 0.3 -0.4 -0.6 … -0.5
Netherlands … 0.888 0.854 0.824 0.817 0.816k … -0.4 -0.4 -0.2 -0.1
Greece … … 0.903 0.894 0.834 0.834j ... … -0.1 -1.4 -0.1
Italy … 0.854 0.870 0.849 … 0.849d … 0.2 -0.2 … …
Czech Republic … 0.923 0.933 0.936 0.929 0.887n … 0.1 0.0 -0.2 -0.8
Hungary … 0.910 0.909 0.924 0.903 0.865m … 0.0 0.2 -0.5 -0.9
Romania … … … 0.919 0.885 0.865m … … … -0.7 -0.4
Table 1: (continued) First, second, third, fourth and higher birth order total cohort fertility rates, selected low fertility countries, birth cohorts 1930, 1940, 1950, 1960 and the latest available (see notes)
Total cohort fertility rates of cohort born in Annual change between birth
cohorts (percent)
Country
1930 1940 1950 1960 1965 Latest
available
1930-1940
1940-1950
1950-1960
1960-1965 1965-latest
Second births
Denmark … … 0.706 0.679 0.694 0.698j … … -0.4 0.4 0.6
England & Wales 0.685 0.760 0.733 0.691 … 0.671h 1.0 -0.4 -0.6 … …
Netherlands 0.753 0.782 0.702 0.669 0.647 0.647i 0.4 -1.1 -0.5 -0.7 …
Greece … 0.777 0.765 0.735 0.671 0.668j … -0.2 -0.4 -1.8 -0.5
Italy … 0.694 0.652 … … 0.613c … -0.6 … … …
Czech Republic 0.714 0.744 0.799 0.783 0.742 0.707l 0.4 0.7 -0.2 -1.1 -1.6
Hungary … 0.646 0.719 0.725 0.691 0.650l … 1.1 0.1 -1.0 -2.0
Romania … … 0.723 0.674 0.576 0.491l … … -0.7 -3.1 -5.3
United States 0.802 0.783 0.665 … … 0.659c -0.2 -1.6 … … …
Third births
Denmark … … 0.230 0.243 … 0.253h … … 0.6 … …
England & Wales 0.382 0.394 0.299 0.297 … 0.287f 0.3 -2.8 -0.1 … …
Netherlands 0.490 0.358 0.227 0.251 … 0.229h -3.2 -4.5 1.0 … …
Greece … 0.284 0.254 0.213 … 0.190h … -1.1 -1.7 … …
Italy 0.363 0.322 0.232 … … 0.201a -1.2 -3.3 … … …
Czech Republic 0.316 0.267 0.270 0.229 0.194 0.194i -1.7 0.1 -1.6 -3.3 …
Hungary … 0.205 0.210 0.237 0.242 0.242i … 0.2 1.2 0.4 …
Romania … … 0.361 0.285 0.218 0.201j … … -2.4 -5.4 -8.1
United States 0.584 0.508 0.311 … … 0.308b -1.4 -4.9 … … …
Fourth and higher births
Denmark … … 0.071 0.085 … 0.089f … … 1.8 … 2.2
England & Wales 0.405 0.301 0.163 0.166 … 0.166d -2.9 -6.1 0.2 … …
Netherlands 0.576 0.193 0.106 0.106 … 0.099e -10.9 -6.0 0.0 … -3.5
Greece … 0.142 0.097 0.079 … 0.073f … -3.8 -2.0 … -4.5
Italy 0.419 0.241 0.106 … … … -5.5 -8.2 … … …
Czech Republic 0.217 0.130 0.093 0.081 … 0.071g -5.2 -3.3 -1.4 … -4.5
Hungary 0.252 0.160 0.114 0.131 … 0.139g -4.5 -3.4 1.4 … 1.9
Romania … … 0.381 0.300 … 0.273f … … -2.4 … -4.8
United States … 0.538 0.198 0.193 … 0.193d … -10.0 -0.2 … …
4.2 Second births
Certain characteristic regional features are discernible also in the long-term second birth TCFR trends (Figure 2 and Table 1): Near stability in the Nordic countries; a gradual decline in most western countries; relative stability turning into a rapid decline in the Central and East European countries; and South European countries experiencing reasonable stability followed by descent.
Differences in the levels of second birth TCFRs among the 1960s cohorts were quite considerable, ranging from below 0.55 in Romania to 0.73 in Norway (Figure 2).
In the western countries between 64 and 73 percent of women were having second births. In Norway and Sweden rates were stable, and in Denmark and the US even a slight increase was under way. In Finland, the Netherlands and England & Wales rates were declining moderately. Austria’s second birth TCFR in the 1960s cohorts was exceptionally low – only 57 percent of women were having second births.
Figure 2: Second birth total cohort fertility rates, selected countries, birth cohorts 1915 - 1970
Panel A
Western countries
0.45 0.50 0.55 0.60 0.65 0.70 0.75 0.80 0.85
1915 1920 1925 1930 1935 1940 1945 1950 1955 1960 1965 1970 1975 Birth cohort
S
econd
bi
rt
h TC
FR
Figure 2: (continued) Second birth total cohort fertility rates, selected countries, birth cohorts 1915 - 1970
Panel B
Central and East European countries
0.45 0.50 0.55 0.60 0.65 0.70 0.75 0.80 0.85
1915 1920 1925 1930 1935 1940 1945 1950 1955 1960 1965 1970 1975
Birth cohort
S
e
c
ond
bir
th TC
FR
Czech Republic
Hungary
Poland
Slovak Republic
Romania
Russia
Panel C
South European countries
0.45 0.50 0.55 0.60 0.65 0.70 0.75 0.80 0.85
1915 1920 1925 1930 1935 1940 1945 1950 1955 1960 1965 1970 1975
Birth cohort
S
e
c
ond
bir
th TC
FR
Greece
Italy
Portugal
There was a wide difference in the second birth TCFR among the formerly socialist countries of Central and Eastern Europe. For the latest available cohorts of the 1960s the values ranged from less than 0.55 in Romania to around 0.70 in the Czech Republic. Two features stand out in contrast to the western countries. The proportions of women having second births were declining rapidly and in most countries these proportions were reaching levels that were lower than in the western countries, i.e. around 0.65 second births per woman (Figure 2).
In the South European countries second birth TCFRs were between 0.60 and 0.65 among the 1960s cohorts; in Greece it was higher, 0.67 second birth per woman. These rates were declining moderately.
4.3 Third births
The differential regional features persisted among long-term third birth TCFR trends (Figure 3).
In the western countries between 20 and 30 percent of women were bearing third children. Starting with the cohorts of the late 1940s these rates have apparently stabilized.
In the Central and East European countries third birth TCFRs were also in the 0.20 to 0.30 range in the 1960s birth cohorts. Most countries experienced a long-term decline which was still continuing among the 1960s cohorts. The trend in Hungary was not typical, third order births even increased among the cohorts of the late 1950s, from 0.20 to 0.24 births per woman.
Figure 3: Third birth total cohort fertility rates, selected countries, birth cohorts 1915 - 1966
Panel A
Western countries
0.10 0.20 0.30 0.40 0.50 0.60
1915 1920 1925 1930 1935 1940 1945 1950 1955 1960 1965 1970 1975
Birth cohort
T
h
ird bi
rt
h TC
FR
Denmark
Finland
Norway
Sweden
England & Wales
Netherlands
Austria
United States
Panel B
Central and East European countries
0.10 0.20 0.30 0.40 0.50 0.60
1915 1920 1925 1930 1935 1940 1945 1950 1955 1960 1965 1970 1975
Birth cohort
Thi
rd
bi
rt
h TC
FR
Czech Republic
Hungary
Poland
Slovak Republic
Romania
Figure 3: (continued) Third birth total cohort fertility rates, selected countries, birth cohorts 1915 - 1966
Panel C
South European countries
0.10 0.20 0.30 0.40 0.50 0.60
1915 1920 1925 1930 1935 1940 1945 1950 1955 1960 1965 1970 1975
Birth cohort
T
h
ir
d
or
d
e
r
TC
FR
Greece
Italy
Portugal
Spain
4.4 Fourth and higher order births
Fourth and higher order births TCFRs ranged from 0.05 to 0.25 births per woman among the cohorts of the early 1960s in the countries for which data are available (Figure 4 and Table 1).
Following a long-term decline the fourth and higher order births TCFRs had stabilized among the 1950s cohorts in the western countries within the 0.10 to 0.20 range (Figure 4). A minor increase did occur in some countries, for instance, in Sweden. In the Central and East European countries there was a relatively wide range of fourth and higher order TCFRs among the early 1960s cohorts from 0.07 in the Czech Republic to 0.25 in Romania. In some countries a moderate decline was still under way. In Hungary and Poland these TCFRs were stabilizing among the late 1950s cohorts; in the latter at a relatively high level of 0.22 births per woman.
Figure 4: Fourth and higher birth order total cohort fertility rates, selected countries, birth cohorts 1915 – 1963
Panel A
Western countries 0.00 0.10 0.20 0.30 0.40 0.50 0.60 0.70 0.80
1915 1920 1925 1930 1935 1940 1945 1950 1955 1960 1965 1970 1975
Birth cohort Fo urt h a n d hi ghe r orde bi rt hs TC FR Denmark Finland Norway Sweden
England & Wales
Netherlands
Austria
United States
Panel B
Central and East European countries
0.00 0.10 0.20 0.30 0.40 0.50 0.60 0.70 0.80
1915 1920 1925 1930 1935 1940 1945 1950 1955 1960 1965 1970 1975
Birth cohort F o u rt h a n d hi gh r o rde r bi rt h TC FR
Czech Republic
Hungary
Poland
Slovak Republic
Romania
Figure 4: (continued) Fourth and higher birth order total cohort fertility rates, selected countries, birth cohorts 1915 – 1963
Panel C
South European countries
0.00 0.10 0.20 0.30 0.40 0.50 0.60 0.70 0.80
1915 1920 1925 1930 1935 1940 1945 1950 1955 1960 1965 1970 1975
Birth cohort
F
o
u
rt
h
a
n
d
hi
gh
e
r ord
e
r TC
FR
Greece
Italy
Portugal
Spain
5. Cohort mean ages of birth orders
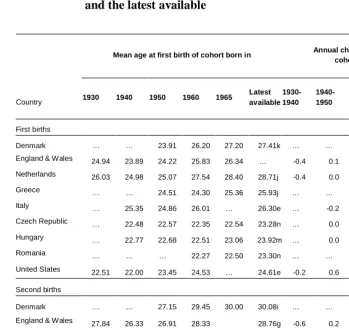
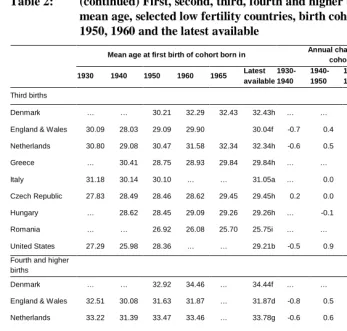
The cohort mean ages of the birth orders inform on whether these occur early or late, and the trends are a crude indication of whether fertility is being advanced or postponed (Table 2 and Figure 5).
A decline in the cohort mean age of childbearing in all birth orders among cohorts of the 1920s and 1930s which then transformed into an increase among cohorts of the 1950s and 1960s was the overriding long-term trend in most countries. In the Central and East European countries the cohort mean ages of childbearing were relatively stable from the 1930s to the 1950s cohorts and started a gradual increase among the 1960s cohorts.
In the cohorts of the 1960s cohort mean ages of first births ranged from 23 to 29 years of age; second birth mean ages from 25 to 31; third birth mean ages from 26 to 32; and fourth and higher birth order mean ages from 29 to 34.
for instance, in Denmark, Hungary and the United States. Stability in the mean ages of fourth and higher birth orders among recent cohorts was the rule. These were not being postponed (Figure 5).
Table 2: First, second, third, fourth and higher birth order cohort mean age, selected low fertility countries, birth cohorts 1930, 1940, 1950, 1960 and the latest available
Mean age at first birth of cohort born in Annual change between birth
cohorts (percent)
Country
1930 1940 1950 1960 1965 Latest
available 1930-1940
1940-1950
1950-1960
1960-1965
1965-latest
First births
Denmark … … 23.91 26.20 27.20 27.41k … … 0.9 0.8 0.3
England & Wales 24.94 23.89 24.22 25.83 26.34 … -0.4 0.1 0.6 0.4 …
Netherlands 26.03 24.98 25.07 27.54 28.40 28.71j -0.4 0.0 0.9 0.6 0.5
Greece … … 24.51 24.30 25.36 25.93j … … -0.1 0.9 1.1
Italy … 25.35 24.86 26.01 … 26.30e … -0.2 0.5 … 1.1
Czech Republic … 22.48 22.57 22.35 22.54 23.28n … 0.0 -0.1 0.2 0.5
Hungary … 22.77 22.68 22.51 23.06 23.92m … 0.0 -0.1 0.5 0.7
Romania … … … 22.27 22.50 23.30n … … … 0.2 0.6
United States 22.51 22.00 23.45 24.53 … 24.61e -0.2 0.6 0.5 … …
Second births
Denmark … … 27.15 29.45 30.00 30.08i … … 0.8 0.4 0.1
England & Wales 27.84 26.33 26.91 28.33 28.76g -0.6 0.2 0.5 … …
Netherlands 28.63 27.43 27.64 29.81 30.72 30.90i -0.4 0.1 0.8 0.6 0.6
Greece … 28.33 26.84 26.70 27.89 28.18i … … 0.0 0.9 1.0
Italy 29.05 28.24 27.88 … … 29.06c … -0.1 … … …
Czech Republic 25.93 25.94 25.63 25.30 25.83 26.46l … -0.1 -0.1 0.4 0.6
Hungary … 26.65 25.97 25.83 26.27 26.65k … -0.3 -0.1 0.3 0.5
Romania … … 25.10 24.64 24.58 25.32k … … … 0.0 1.0
Table 2: (continued) First, second, third, fourth and higher birth order cohort mean age, selected low fertility countries, birth cohorts 1930, 1940, 1950, 1960 and the latest available
Mean age at first birth of cohort born in Annual change between birth
cohorts (percent)
1930 1940 1950 1960 1965 Latest
available 1930-1940
1940-1950
1950-1960
1960-1965
1965-latest
Third births
Denmark … … 30.21 32.29 32.43 32.43h … … 0.7 0.1 …
England & Wales 30.09 28.03 29.09 29.90 30.04f -0.7 0.4 0.3 … 0.2
Netherlands 30.80 29.08 30.47 31.58 32.34 32.34h -0.6 0.5 0.4 0.5 …
Greece … 30.41 28.75 28.93 29.84 29.84h … … 0.1 0.6 …
Italy 31.18 30.14 30.10 … … 31.05a … 0.0 … … …
Czech Republic 27.83 28.49 28.46 28.62 29.45 29.45h 0.2 0.0 0.1 0.6 …
Hungary … 28.62 28.45 29.09 29.26 29.26h … -0.1 0.2 0.1 …
Romania … … 26.92 26.08 25.70 25.75i … … … -0.3 0.2
United States 27.29 25.98 28.36 … … 29.21b -0.5 0.9 … … …
Fourth and higher
births
Denmark … … 32.92 34.46 … 34.44f … … 0.5 … 0.0
England & Wales 32.51 30.08 31.63 31.87 … 31.87d -0.8 0.5 0.1 … …
Netherlands 33.22 31.39 33.47 33.46 … 33.78g -0.6 0.6 0.0 … 0.3
Greece … 32.28 30.95 31.04 … 31.20g … -0.4 0.0 … 0.2
Italy 33.77 31.79 31.34 … … … -0.6 -0.1 … … …
Czech Republic 30.29 30.81 30.70 31.47 … 32.00g 0.2 0.0 0.2 … 0.6
Hungary 30.68 30.71 30.70 31.68 … 31.67g 0.0 0.0 0.3 … 0.0
Romania … … 30.61 29.13 … 28.98g … … -0.5 … -0.2
United States … 28.44 30.81 31.57 … 31.57d … 0.8 0.2 … 0.0
Figure 5: Cohort mean age for first, second, third, fourth and higher order births, selected countries, birth cohorts 1915-1971
Panel A
First birth order
21 23 25 27 29 31 33 35
1915 1920 1925 1930 1935 1940 1945 1950 1955 1960 1965 1970 1975
Birth cohort Co h o rt m e a n a g e a t fi rs t b ir th Denmark
England & Wales
Netherlands Greece Italy Czech Republic Hungary United States
Panel B
Second birth order
21 23 25 27 29 31 33 35
1915 1920 1925 1930 1935 1940 1945 1950 1955 1960 1965 1970 1975
Birth cohort C ohor t m e a n a g e a t s e c o n d bi rt h Denmark
England & Wales
Netherlands
Greece
Italy
Czech Republic
Hungary
Figure 5: (continued) Cohort mean age for first, second, third, fourth and higher order births, selected countries, birth cohorts 1915-1971
Panel C
Third birth order
21 23 25 27 29 31 33 35
1915 1920 1925 1930 1935 1940 1945 1950 1955 1960 1965 1970 1975
Birth cohort C o h o rt m e an ag e at th ir d b ir th Denmark
England & Wales
Netherlands
Greece
Italy
Czech Republic
Hungary
United States
Panel D
Fourth and higher order births
21 23 25 27 29 31 33 35
1915 1920 1925 1930 1935 1940 1945 1950 1955 1960 1965 1970 1975
6. The age structure of birth orders
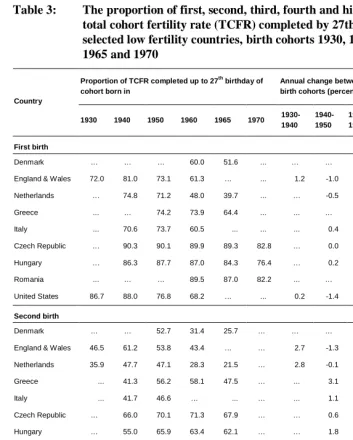
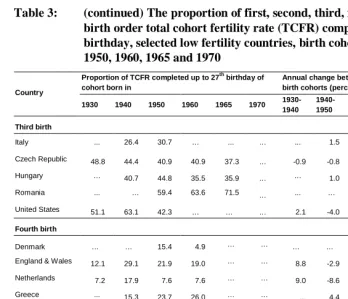
A complementary crude device to assess the timing of childbearing is to analyze changes in the age structure of women having births of the respective birth orders (Table 3). The measure applied in this project is the proportion of births borne by “young” women (defined as prior to the 27th birthday). A rise in this proportion implies anticipation of births, a decline indicates childbearing postponement5.
In all birth orders countries differ from each other considerably as to the basic timing of births. One of the clearly distinct differences in childbearing patterns during most of the second half of the 20th century between western and formerly socialist countries was late childbearing in the former and early childbearing in the latter. In the Central and East European countries among the 1960s cohorts close to 90 percent of first births were borne by young women, whereas in western and South European countries these proportions were between 40 and 70 percent. The differences were of similar orders of magnitude for second and third order births.
While there were large differences in proportions of young women bearing children, trends in time went in similar directions. Among the cohorts of the 1930s and often also of the 1940s the proportions tended to increase. For the more recent birth cohorts the proportion of young women bearing children has been declining across the board practically in all countries and for most birth orders (Table 3). Among the cohorts that have effectively concluded their childbearing, the 1960s cohorts covered in Table 3, the declines were faster among the western countries than among the formerly socialist ones. This is understandable as major parts of the reproductive life in the latter countries took place under the old communist regimes.
5
Table 3: The proportion of first, second, third, fourth and higher birth order total cohort fertility rate (TCFR) completed by 27th birthday, selected low fertility countries, birth cohorts 1930, 1940, 1950, 1960, 1965 and 1970
Proportion of TCFR completed up to 27th birthday of
cohort born in
Annual change between birth cohorts (percent)
Country
1930 1940 1950 1960 1965 1970
1930-1940 1940-1950
1950-1960
1960-1965
1965- 1970
First birth
Denmark … … … 60.0 51.6 ... … … … -3.0 ...
England & Wales 72.0 81.0 73.1 61.3 … ... 1.2 -1.0 -1.8 … ...
Netherlands … 74.8 71.2 48.0 39.7 ... … -0.5 -4.0 -3.8 ...
Greece ... … 74.2 73.9 64.4 ... ... … 0.0 -2.8 ...
Italy ... 70.6 73.7 60.5 ... ... ... 0.4 -2.0 ... ...
Czech Republic … 90.3 90.1 89.9 89.3 82.8 … 0.0 0.0 -0.1 -1.5
Hungary … 86.3 87.7 87.0 84.3 76.4 … 0.2 -0.1 -0.6 -2.0
Romania ... … … 89.5 87.0 82.2 ... … … -0.6 -1.1
United States 86.7 88.0 76.8 68.2 … ... 0.2 -1.4 -1.2 … ...
Second birth
Denmark … … 52.7 31.4 25.7 … … … -5.2 -4.0 ...
England & Wales 46.5 61.2 53.8 43.4 … … 2.7 -1.3 -2.1 … ...
Netherlands 35.9 47.7 47.1 28.3 21.5 … 2.8 -0.1 -5.1 -5.5 ...
Greece ... 41.3 56.2 58.1 47.5 … ... 3.1 0.3 -4.0 ...
Italy ... 41.7 46.6 … ... … ... 1.1 … ... ...
Czech Republic … 66.0 70.1 71.3 67.9 … … 0.6 0.2 -1.0 …
Hungary … 55.0 65.9 63.4 62.1 … … 1.8 -0.4 -0.4 …
Romania ... … 70.9 74.9 76.4 … ... … 0.5 0.4 …
United States 71.8 76.4 58.6 … … … 0.6 -2.6 … … ...
Third birth
Denmark … … 28.0 11.5 … … … … -8.9 … …
England & Wales 27.8 44.7 36.9 31.3 … … 4.7 -1.9 -1.6 … …
Netherlands 18.6 29.2 19.6 14.7 … … 4.5 -4.0 -2.9 … …
Table 3: (continued) The proportion of first, second, third, fourth and higher birth order total cohort fertility rate (TCFR) completed by 27th birthday, selected low fertility countries, birth cohorts 1930, 1940, 1950, 1960, 1965 and 1970
Proportion of TCFR completed up to 27th birthday of
cohort born in
Annual change between birth cohorts (percent)
Country
1930 1940 1950 1960 1965 1970
1930-1940 1940-1950
1950-1960
1960-1965
1965- 1970
Third birth
Italy ... 26.4 30.7 … ... … ... 1.5 … ... ...
Czech Republic 48.8 44.4 40.9 40.9 37.3 … -0.9 -0.8 0.0 -1.9 …
Hungary … 40.7 44.8 35.5 35.9 … … 1.0 -2.3 0.2 …
Romania ... … 59.4 63.6 71.5 … ... … 0.7 2.3 ...
United States 51.1 63.1 42.3 … … … 2.1 -4.0 … … …
Fourth birth
Denmark … … 15.4 4.9 … … … … -11.4 … …
England & Wales 12.1 29.1 21.9 19.0 … … 8.8 -2.9 -1.4 … …
Netherlands 7.2 17.9 7.6 7.6 … … 9.0 -8.6 0.0 … …
Greece ... 15.3 23.7 26.0 … … ... 4.4 0.9 … …
Italy ... 16.1 24.3 … ... … ... 4.1 … ... …
Czech Republic 30.8 25.9 25.5 22.0 … … -1.7 -0.2 -1.5 … …
Hungary … 26.1 30.4 21.0 … … … 1.5 -3.7 … …
Romania ... … 29.3 37.7 … … ... … 2.5 … …
United States … 43.6 26.3 … … … … -5.0 … … …
7. Fertility of older women
Table 4 provides information about the absolute levels and trends of childbearing of older women by birth order.
For the most part, there was an impressive increase of first births among older women. In western countries this took place starting with the 1940 cohorts, in Central and Eastern Europe the increase commenced in the early 1960s cohorts.
In the 1950s and 1960s cohorts there was also a measurable increase in second order births among older women in the West, but not in the Central and East European countries.
Table 4: Cumulated cohort fertility rates after 27th birthday, first, second, third, fourth and higher birth order, selected low fertility countries, birth cohorts 1930, 1940, 1950, 1960, 1965 and 1970
Cumulated fertility after 27th Birthday Decennial change between cohorts (percent)
Country
1930 1940 1950 1960 1965 1970
1930-1940 1940-1950
1950-1960
1960-1965
1965-1970
First births
Denmark … … … 0.360 0.422 … … … … 17.4 ...
England & Wales 0.243 0.169 0.231 0.314 … … -30.4 36.6 35.7 … ...
Netherlands … 0.223 0.246 0.429 0.493 … … 10.0 74.5 14.9 ...
Greece … … 0.233 0.233 0.297 … ... … -0.2 27.5 ...
Italy … 0.251 0.229 0.335 … … ... -8.8 46.5 ... ...
Czech Republic … 0.090 0.092 0.095 0.099 0.156 … 3.1 2.2 4.9 56.9
Hungary … 0.124 0.112 0.120 0.142 0.204 … -10.2 7.5 18.5 43.6
Romania … … … 0.096 0.115 0.154 ... … … 19.6 33.4
United States 0.120 0.108 0.196 0.269 … … -10.0 81.3 37.8 … ...
Second births
Denmark … … 0.334 0.466 0.516 … … … 39.5 10.8 ...
England & Wales 0.367 0.295 0.339 0.391 … … -19.6 15.0 15.4 … ...
Netherlands 0.482 0.409 0.371 0.480 0.508 … -15.1 -9.3 29.3 5.8 ...
Greece … 0.456 0.335 0.308 0.352 … ... -26.6 -8.1 14.5 ...
Italy … 0.405 0.348 … … … ... -14.0 … ... ...
Czech Republic … 0.253 0.239 0.225 0.238 … … -5.6 -5.8 5.9 …
Hungary … 0.291 0.245 0.265 0.262 … … -15.7 8.2 -1.1 …
Romania … … … 0.169 0.136 ... ... … … -19.9 …
United States 0.226 0.185 0.275 … … … -18.0 48.8 … … ...
Third births
Denmark … … 0.166 0.216 … … … … 30.1 … ...
Table 4: (continued) Cumulated cohort fertility rates after 27th birthday, first, second, third, fourth and higher birth order, selected low fertility countries, birth cohorts 1930, 1940, 1950, 1960, 1965 and 1970
Cumulated fertility after 27th Birthday Decennial change between cohorts (percent)
Country
1930 1940 1950 1960 1965 1970
1930-1940 1940-1950
1950-1960
1960-1965
1965-1970
Third births
Netherlands 0.399 0.253 0.183 0.215 … … -36.5 -27.8 17.3 … ...
Greece … 0.213 0.155 0.124 … … ... -27.0 -19.9 … ...
Italy … 0.237 0.161 … … … ... -32.4 … ... ...
Czech Republic 0.162 0.149 0.160 0.135 0.122 … -0.154 7.4 -15.1 -10.3 …
Hungary … 0.121 0.116 0.153 0.155 … … -4.7 32.4 1.5 …
Romania … … 0.147 0.104 0.062 ... ... … -29.3 -40.1 …
United States 0.286 0.187 0.179 … … … -34.4 -4.3 … … ...
Fourth and higher
births
Denmark … … 0.060 0.081 … … … … 34.9 … ...
England & Wales 0.356 0.214 0.128 0.135 … … -39.9 -40.3 5.6 … ...
Netherlands 0.535 0.159 0.098 0.098 … … -70.3 -38.3 0.2 … ...
Greece … 0.120 0.074 0.059 … … ... -38.5 -20.6 … ...
Italy … 0.202 0.080 … … … ... -60.4 … ... ...
Czech Republic 0.151 0.096 0.070 0.063 … … -0.067 -27.5 -9.3 … …
Hungary … 0.118 0.079 0.103 … … … -33.2 30.7 … …
Romania … … 0.269 0.187 ... ... ... … -30.6 ... …
United States … 0.304 0.146 0.152 … … … -52.0 4.3 … ...
8. Fertility of young women
There is a considerable variety in the levels of fertility between countries, particularly among first order births of young women. In the early 1970s cohorts these were around 0.3 births per woman in South European countries, 0.3 to 0.4 in western countries and 0.5 to 0.6 in countries of Central and Eastern Europe (Table 5).
Table 5: First, second, third, fourth and higher birth order cumulated cohort fertility rates (CCFRs) up to 27th birthday, selected low fertility countries, birth cohorts 1930, 1940, 1950, 1960, 1970 and 1975 (or latest available)
CCFR up to 27th birthday Annual change between birth cohorts (percent)
Country
1930 1940 1950 1960 1965 1970 1975 or latest available
1930-1940
1940-1950
1950-1960
1960-1965
1965-1970
1970-1975 (or latest available)
First births
Denmark … … … 0.539 0.451 0.421 0.350 … … … -3.6 -1.4 -3.7
England &
Wales 0.627 0.723 0.630 0.497 0.455 0.433 0.392c 1.4 -1.4 -2.4 -1.8 -1.0 -2.5
Netherlands … 0.665 0.608 0.395 0.324 0.268 0.268 … -0.9 -4.3 -4.0 -3.8 0.1
Greece … … 0.670 0.661 0.537 0.397 0.311 ... … -0.1 -4.1 -6.1 -4.9
Italy … 0.604 0.641 0.514 0.391 0.298 0.298b ... 0.6 -2.2 -5.5 -5.5 ...
Czech
Republic … 0.833 0.841 0.842 0.830 0.748 0.536 … 0.1 0.0 -0.3 -2.1 -6.6
Hungary … 0.785 0.797 0.804 0.761 0.661 0.481 … 0.1 0.1 -1.1 -2.8 -6.4
Romania … … … 0.822 0.770 0.712 0.569 ... … … -1.3 -1.6 -4.5
United
States 0.780 0.793 0.649 0.577 0.563 … … 0.2 -2.0 -1.2 -0.5 … ...
Second
births
Denmark … … 0.372 0.213 0.179 0.160 0.140 … … -5.6 -3.5 -2.2 -2.7
England &
Wales 0.318 0.465 0.394 0.300 0.257 0.233 0.214c 3.8 -1.6 -2.7 -3.1 -1.9 -2.2
Netherlands 0.271 0.373 0.331 0.189 0.139 0.106 0.101 3.2 -1.2 -5.6 -6.2 -5.4 -1.0
Greece … 0.321 0.430 0.427 0.319 0.203 0.142 … 2.9 -0.1 -5.9 -9.0 -7.2
Italy … 0.290 0.304 0.214 0.143 0.097 0.097b … 0.5 -3.5 -8.1 -7.8 …
Czech
Republic … 0.491 0.560 0.558 0.504 0.394 0.219 … 1.3 0.0 -2.0 -4.9 -11.7
Hungary … 0.356 0.474 0.460 0.429 0.334 0.200 … 2.9 -0.3 -1.4 -5.0 -10.2
Romania … … 0.513 0.504 0.440 0.297 0.224 … … -0.2 -2.7 -7.9 -5.6
United
Table 5: (continued) First, second, third, fourth and higher birth order cumulated cohort fertility rates (CCFRs) up to 27th birthday, selected low fertility countries, birth cohorts 1930, 1940, 1950, 1960, 1970 and 1975 (or latest available)
CCFR up to 27th birthday Annual change between birth cohorts (percent)
Country
1930 1940 1950 1960 1965 1970 1975 or latest available
1930-1940
1940-1950
1950-1960
1960-1965
1965-1970
1970-1975 (or latest available)
Third births
Denmark … … 0.064 0.028 0.027 0.030 0.025 … … -8.3 -0.7 2.1 -3.3
England &
Wales 0.106 0.176 0.110 0.093 0.086 0.076 0.067c 5.0 -4.7 -1.7 -1.7 -2.4 -3.1
Netherlands 0.091 0.104 0.045 0.037 0.028 0.021 0.019 1.3 -8.5 -1.9 -5.8 -5.9 -1.6
Greece … 0.071 0.098 0.089 0.063 0.038 0.027 ... 3.3 -1.0 -7.0 -10.1 -6.7
Italy … 0.085 0.071 0.036 0.020 0.012 0.012b ... -1.8 -6.9 -11.1 -9.8 ...
Czech
Republic 0.154 0.119 0.111 0.094 0.072 0.047 0.025 -2.6 -0.7 -1.7 -5.2 -8.5 -13.1
Hungary … 0.083 0.094 0.084 0.087 0.079 0.055 … 1.2 -1.1 0.6 -1.9 -7.1
Romania … … 0.214 0.181 0.156 0.068 0.055 ... … -1.7 -3.1 -16.5 -4.3
United
States 0.299 0.321 0.132 0.114 0.121 … 0.7 -8.9 -1.5 1.2 … ...
Fourth births and higher
Denmark … … 0.011 0.004 0.005 0.007 0.006 … … -9.6 3.2 7.0 -3.0
England &
Wales 0.049 0.088 0.036 0.032 0.027 0.024 0.021c 5.9 -9.0 -1.2 -3.0 -2.6 -3.1
Netherlands 0.042 0.035 0.008 0.008 0.006 0.004 0.004 -1.9 -14.6 0.0 -4.5 -8.8 -2.3
Greece … 0.022 0.023 0.021 0.016 0.011 0.009 ... 0.6 -1.1 -5.4 -6.6 -3.6
Italy 0.036 0.039 0.026 0.007 0.003 0.002 0.002b 0.8 -4.1 -13.1 -14.7 -9.9 ...
Czech
Republic 0.067 0.034 0.024 0.018 0.014 0.011 0.007 -6.9 -3.4 -2.9 -5.5 -4.6 -8.4
Hungary … 0.042 0.035 0.027 0.027 0.028 0.022 … -1.9 -2.3 0.0 0.4 -4.6
Romania … … 0.112 0.113 0.089 0.032 0.027 ... … 0.2 -4.8 -20.4 -3.4
United
States … 0.235 0.052 0.041 0.051 0.054 0.055c … -15.1 -2.3 4.1 1.1 0.7
Second order births in the mid 1970 cohorts were also the highest in the Central and East European countries, around or above 0.2 births per woman. In the other countries these rates were closer to 0.1 births per woman. – Third order births were rare among young women, usually not above 0.05 births per woman.
Two features stand out regarding trends:
1. Childbearing of all birth orders of young women has been declining persistently for a considerable sequence of cohorts. The decline started among the cohorts of the 1940s in the western countries, the 1950s cohorts in Southern Europe, and the 1960s cohorts in Central and Eastern Europe.
2. The decline has been more robust among the more recent cohorts born in the 1960s and the early 1970s.
These trends reflect a combination of fertility quantum decline and childbearing postponement. As these trends concern cohorts that are in the midst of their childbearing periods, the relative weight of these two effects cannot be singled out.
9. Birth order trends, parity progression and parity distribution in
selected countries
A more profound understanding of birth order trends and of the nature of their timing can be gained by studying detailed changes of age patterns of fertility measured by single year age-specific fertility rates in individual countries. In addition, cohort parity progression ratios and cohort parity distribution will be explored in selected countries6.
9.1 Denmark
Among the cohorts of the 1950s and 1960s between 87 and 90 percent of women in Denmark were having first births, 68 to 70 percent second births and between 22 and 27 percent were having third births (Table 1, Figures 1-3 and 7).
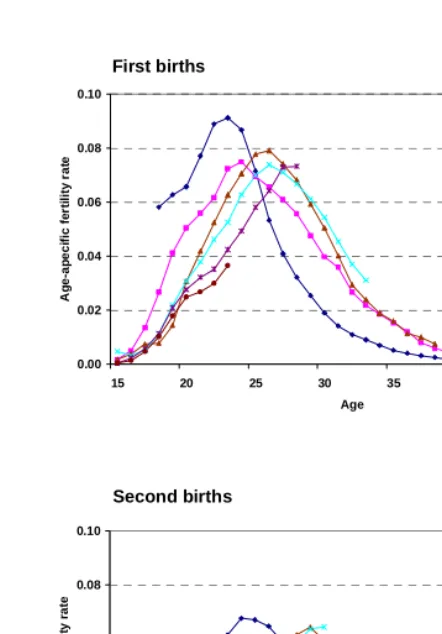
Developments in childbearing postponement by birth order are depicted in Figure 6. First order births were being postponed from one cohort to the next. Each successive curve is shifted more to the right into the higher ages with fertility at lower ages
6
declining and at higher ages increasing. The peak of childbearing was shifting from age 23 in the 1950 cohort to age 26 in the 1970 cohort.
Among second order births there was a considerable postponement of childbearing between the 1950 and the 1960 cohorts. The peak of childbearing between these two cohorts shifted from age 24 to 29. Postponement of second births was continuing among the cohorts of the 1960s and 1970s, but at a slower pace and the peak of the childbearing pattern shifted only by one year from the 1960 to the 1970 cohort.
Among third order births fertility was quite low, nevertheless childbearing postponement was taking place between the 1950 and the 1960 cohorts. Among the subsequent cohorts of the 1960s, while there had been a moderate rise in third order births, these were not being postponed further. – The incidence of fourth order births among cohorts of the 1950s and early 1960s was very low and very little if any changes in timing were taking place.
For the cohorts for which data are available parity progression ratios (PPRs) are reasonably stable: for first births close to 90 percent and slightly less than 80 percent of women progressed to a second birth (Figure 8 and Table 6). A slight increasing tendency could be detected in the 1950s and early 1960s cohorts with around 35 percent of women with second births having a third one, and close to 25 percent of 3-parity women having a fourth birth.
The parity distribution was also quite stable (Figure 9 and Table 7). In the cohorts of the early 1960s around 45 percent of women had two children, roughly equal proportions of almost 20 percent had one or three children; around 12 percent remained childless and families7 with 4 or more children were very rare.
Figure 6: First, second, third, fourth and higher birth order age-specific fertility rates, birth cohorts 1950, 1960, 1965, 1970,
1975 and 1980, Denmark
First births
0.00 0.02 0.04 0.06 0.08 0.10
15 20 25 30 35 40 45
Age
A
g
e-ap
eci
fi
c f
e
rt
il
it
y
ra
te
1950
1960
1965
1970
1975
1980
Second births
0.00 0.02 0.04 0.06 0.08 0.10
15 20 25 30 35 40 45
Age
A
g
e
-pe
c
if
ic
f
e
rt
ilit
y
r
a
te
1950
1960 1965 1970 1975
Figure 6: (continued) First, second, third, fourth and higher birth order age-specific fertility rates, birth cohorts 1950, 1960, 1965, 1970, 1975 and 1980, Denmark
Third births 0.00 0.02 0.04 0.06 0.08 0.10
15 20 25 30 35 40 45
Age A g e-sp e c if ic f e rt il it y r a te 1950 1960 1965 1970 1975 1980 Fourth births 0.00 0.02 0.04 0.06 0.08 0.10
15 20 25 30 35 40 45
Table 6: Parity progression ratios (in percent), selected low fertility countries, birth cohorts 1930 - 1970
Parity progression ratios
Country Cohort 01 12 23 34
Denmark 1950 88.9 79.4 32.5 22.7
1955 87.5 78.2 32.7 23.5
1960 89.9 75.5 35.9 24.8
1965 87.3 79.5 36.1
1968 87.8
England & Wales 1920 82.8 73.0 53.0 48.4
1925 84.1 73.9 53.7 50.1
1930 87.0 78.7 55.8 51.2
1935 88.6 82.8 55.8 47.6
1940 89.3 85.1 51.9 43.9
1945 90.2 83.7 43.1 36.4
1950 86.1 85.2 40.8 35.2
1955 84.2 84.0 42.5 34.7
1960 81.1 85.2 43.0 34.4
1965 79.5
Netherlands 1930 85.7 87.8 65.1 55.8
1935 87.9 88.6 58.2 46.4
1940 88.8 88.1 45.7 33.3
1945 88.7 84.3 33.4 27.3
1950 85.4 82.2 32.4 27.4
1955 83.1 81.7 36.8 26.8
1960 82.4 81.2 37.6 20.8
1965 81.7 79.2 34.8
1967 81.8
Italy 1935 84.8 81.3 52.4 46.6
1940 85.4 81.3 46.4 40.2
1945 88.3 78.9 41.0 35.2
1950 87.0 74.9 35.5 29.3
1955 87.3 72.4 32.7 25.2
1960 84.7
Table 6: (continued) Parity progression ratios (in percent), selected low fertility countries, birth cohorts 1930 - 1970
Parity progression ratios
Country Cohort 01 12 23 34
Czech Republic 1935 93.5 79.0 38.8 32.0
1940 92.3 80.6 35.9 29.1
1945 92.0 82.5 33.5 25.0
1950 93.4 85.5 33.8 23.4
1955 93.8 84.8 31.4 23.0
1960 93.6 83.6 29.2 23.7
1965 92.8 80.0 26.1
1970 90.6
1971 89.1
Romania 1950 93.7 77.1 49.9 55.9
1955 91.0 76.1 44.8 53.0
1960 91.8 73.4 42.3 50.2
1965 88.5 65.0 37.8 45.7
1970 86.8
1971 85.1
United States 1905 78.9 70.6 62.2 33.8
1910 78.9 72.5 60.3 60.6
1915 83.1 76.6 61.1 54.0
1920 88.1 80.8 64.2 52.5
1925 89.8 85.2 68.6 54.7
1930 90.0 89.1 72.9 58.1
1935 91.7 89.2 72.5 63.6
Table 7: Parity distribution (in percent), selected low fertility countries, birth cohorts 1930 - 1960
Parity
Country Cohort 0 1 2 3 4 and more
Total cohort fertility rate
Denmark 1950 10.9 18.3 47.8 17.8 5.2 1.91
1955 12.5 19.1 46.0 17.1 5.3 1.84
England & Wales 1930 13.1 18.5 29.9 19.0 19.5 2.34
1935 11.2 15.2 32.9 21.3 19.4 2.41
1940 10.6 13.0 37.3 21.9 17.2 2.35
1945 10.4 13.7 43.2 21.1 11.6 2.16
1950 14.5 12.2 43.2 19.5 10.6 2.06
1955 16.9 12.1 40.0 20.5 10.5 2.02
Netherlands 1930 14.1 10.6 26.3 21.6 27.4 2.67
1935 12.1 10.0 32.6 24.2 21.1 2.49
1940 11.2 10.6 42.5 23.8 11.9 2.22
1945 11.3 13.9 49.8 18.2 6.8 2.00
1950 14.6 15.2 47.5 16.5 6.2 1.89
1955 16.9 15.2 42.9 18.2 6.8 1.87
1960 17.7 15.5 41.7 19.5 5.6 1.85
Italy 1935 15.3 15.8 32.8 19.3 16.8 2.28
1940 14.5 16.0 37.2 19.3 13.0 2.14
1945 11.7 18.6 41.1 18.5 10.1 2.07
1950 12.7 22.1 42.0 16.4 6.8 1.89
1955 12.4 24.3 42.5 15.5 5.3 1.80
Czech Republic 1935 6.5 19.6 45.2 19.5 9.2 2.12
1940 7.6 18.0 47.7 18.9 7.8 2.07
1945 8.1 16.6 49.9 18.9 6.5 2.03
1950 6.7 13.5 52.8 20.7 6.3 2.10
1955 6.3 14.2 54.6 19.2 5.7 2.07
1960 6.5 15.4 55.3 17.4 5.4 2.03
Romania 1950 6.3 20.9 36.5 16.1 20.2 2.48
1955 8.8 21.9 38.2 14.6 16.5 2.27
1960 8.1 24.5 38.9 14.2 14.3 2.16
1965 11.7 31.1 35.6 11.7 9.9 1.91
Table 7: (continued) Parity distribution (in percent), selected low fertility countries, birth cohorts 1930 - 1960
Parity
Country Cohort 0 1 2 3 4 and more
Total cohort fertility rate
United States 1930 10.0 9.9 21.7 24.5 33.9 3.18
1935 8.3 9.9 22.5 21.6 37.7 3.14
1940 9.9 11.8 27.5 17.6 33.2 2.73
1945 12.9 15.5 34.0 15.5 22.1 2.26
1950 15.6 17.9 35.4 17.4 13.7 2.03
1955 16.0 18.3 35.1 19.3 11.3 1.99
9.2 England & Wales
In England & Wales the total cohort fertility rates for all birth orders had been declining since the cohorts of the mid-1940s (Table 1 and Figures 1-4 and 7). The proportions of women having a first birth declined from 90 percent in the cohorts of the mid 1940s to 80 percent in the mid-1960s cohorts (Figure 7). The proportions having second children dropped from 75 percent to 67 percent. – Third, fourth and fifth order births experienced a considerable decline in the late 1930s and early 1940s cohorts and thereafter the descent was moderate.
Starting with the cohorts of the 1940s a continuous postponement of childbearing has occurred in all birth orders (Figure 10). The basic feature of childbearing postponement is maintained, namely that fertility at younger ages is declining from one cohort to the next and increasing at older ages among successive cohorts. However the age trajectory of fertility is distinct compared to most other countries. Age peaks of childbearing have practically disappeared among women in their twenties. Age-specific fertility rates tend to be at more or less even level and thus the curves are almost flat.
Parity progression rates to parity one (PPR0) declined starting with the cohorts of the 1940s (Figure 8, Table 6). At the same time the progression to second births following a rise among the cohorts of the 1920s and 1930s remained stable around 85 percent. The progression ratios to third and fourth parity births declined sharply among the 1930s and early 1940s cohorts. Since the cohorts of the mid-1940s, only slightly more than 40 percent of 2-parity women went on to have a third birth and around 35 percent of 3-parity women had a fourth birth.
Figure 10: First, second, third, fourth and higher birth order age-specific fertility rates, birth cohorts 1940, 1950, 1960, 1965, 1970, 1975 and 1980, England & Wales
First births 0.00 0.02 0.04 0.06 0.08 0.10 0.12
15 20 25 30 35 40 45
Age A g e-sp e c if ic f e rt il it y r a te 1940 1950 1960 1965 1970 1975 1980 Second births 0.00 0.02 0.04 0.06 0.08 0.10 0.12
15 20 25 30 35 40 45
Figure 10: (continued) First, second, third, fourth and higher birth order age-specific fertility rates, birth cohorts 1940, 1950, 1960, 1965, 1970, 1975 and 1980, England & Wales
Third births 0.00 0.02 0.04 0.06 0.08 0.10 0.12
15 20 25 30 35 40 45
Age A g e -s p e c if ic f e rt ilit y r a te 1940 1950 1960 1965 1970 1975 1980 Fourth births 0.00 0.02 0.04 0.06 0.08 0.10 0.12
15 20 25 30 35 40 45
9.3 Netherlands
In the Netherlands first and second birth order TCFRs were quite similar to those in England & Wales (Table 1, Figures 1-4 and 7). Close to 90 percent of women were having first births in the mid-1940s cohorts and this proportion declined steadily to 82 percent in the cohorts of the mid-1960s. Almost 80 percent of women had second births in the cohorts born around 1940 which declined to 65 percent in the mid-1960s cohorts. A precipitous decline occurred in third and higher order births between the mid-1930s and mid-1940s cohorts which remained quite stable after that (Figure 7).
Postponement of childbearing was in progress from the cohorts of around 1940 to those of around 1970 in all birth orders, and has apparently come to a halt, at least as far as data are available, among the cohorts of the 1970s (Figure 11). The peak age of childbearing in first births was at age 24 in the 1940 cohort and has shifted to age 29 in the 1970 cohort. Among second births the peak age of childbearing went from age 25 to age 32 in the same cohorts. In third births the curve of age-specific fertility rates has also been shifting continuously to the right up to the 1970 cohort, even though at a relatively low level. That childbearing postponement appears to have ceased among the 1970s cohorts is evident from the fact that age-specific fertility patterns have not been changing from one cohort to the next. The trajectories of the curves overlap. This is the case for all birth orders.
The parity progression ratio to first births was at close to 90 percent in the cohorts of the 1930s and declined to 82 percent in the mid-1960s cohorts (Figure 8, Table 6). Progression to the second birth has been declining gradually from 88 in the 1940 cohort to 78 percent in the cohorts of the mid-1960s. Precipitous declines occurred in the PPRs to third and fourth order births from the cohorts of the 1920s to those of the late 1940s. PPRs to third births recovered somewhat in the 1950s cohorts and then resumed a moderate descent. The decrease of the progression to fourth births paused among the early 1950s cohorts, but thereafter continued.
Figure 11: First, second and third birth order age-specific fertility rates, birth cohorts 1940, 1950, 1960, 1965, 1970, 1975 and 1980, Netherlands
First births 0.00 0.02 0.04 0.06 0.08 0.10 0.12
15 20 25 30 35 40 45
Age A g e -s p e c if ic f e rt ili ty r a te 1940 1950 1960 1965 1970 1975 1980 Second births 0.00 0.02 0.04 0.06 0.08 0.10 0.12
15 20 25 30 35 40 45