KLECZKOWSKI, A. (1953). J . gen. Microbiol. 8, 2954301.
A Method for Testing Results of Infectivity Tests with
Plant Viruses for Compatibility with Hypotheses
BY A. KLECZKOWSKI
Rothamsted Experimental Station, Harpenden, Hertfordshire
SUMMARY: A statistical method is described to test the compatibility between results of local-lesion counts and hypotheses relating changes in infectivity of plant- virus preparations to treatments applied to them. The method allows the variance- ratio test to be applied: it involves establishing a relation between numbers of lesions and virus concentration for each experiment and a logarithmic transforma- tion of lesion counts to make variance independent of the magnitude of the variate. Its use is illustrated with results obtained to see whether inactivation of viruses by ultraviolet radiation is a first order reaction.
When the infectivity of plant-virus preparations is assayed by the local-lesion method, exact conclusions are difficult to draw because there is no simple relationship between numbers of lesions and virus concentration; also, standard errors of individual numbers are high and depend on the magnitude of the number (Kleczkowski, 1949). With no method to overcome these difficulties, compatibility between experimental results and a hypothesis predicting quantitative changes in infectivity could be judged only by intuition and not tested statistically. The purpose of this paper is to describe a method whereby objective statistical tests can replace subjective judgement.
THE METHOD Experimental design
When infectivity of several virus preparations is to be assayed, each of them can be inoculated at one convenient dilution for comparison with a standard preparation inoculated at several dilutions. Each inoculum is rubbed on a number of half-leaves (or whole leaves) distributed in such a way as to eliminate as many causes of variation as possible. Thus each inoculum must occur an equal number of times on each of a number of plants, or of blocks of
plants, and, if the leaves occupy different positions on the stem, each inoculum must occur an equal number of times on each leaf position or on each leaf level comprising not more than two neighbouring positions. Some convenient distributions are given by Kleczkowski (1950).
The statistical treatment to be described can be applied only if all the inocula produce on the average at least about five lesions per half-leaf (or
per leaf) and not more than can be conveniently counted.
Statistical test
296
A .
Klecxkowski
where k is an adjustable constant. The variable ZI can be any quantitative aspect of a treatment, such as time of its duration, concentration of a reagent, etc. There can be more than one function and/or more than one variable or one constant involved, but this does not alter the principle of the procedure. The procedure is based on two facts. First, it is usually possible, by suitably adjusting the values of three constants, N ,
6
and A, to express the relationship between the numbers of lesions ( Y ) and the concentration of a virus preparation in the inoculum (z) by the equationwhere u=logloz if the virus preparation has not been subjected to the treat- ment under test or u=log,,px if the preparation has been subjected to the treatment which has altered its activity by the factor p of equation (1). (The value of Y / N can be obtained from a table of
‘
probits ’.)Secondly, if individual numbers of lesions (y) on each half-leaf (or whole leaf) are transformed by the formula
(where c is a constant whose value can be determined from experimental data or taken as anything between 5 and 15), the values of
x
are approximately normally distributed with a standard error independent of their magnitude (Kleczkowski, 1949). It is essential that the mean value of y, obtained withany inoculum, should not be smaller than about 5, otherwise the transforma- tion (3) may not make the standard error of x independent of its magnitude. Thus all the numbers of lesions per half-leaf (or whole leaf) are transformed according to the formula (3) and the values of x thus obtained are used throughout.
An estimate of the variance (s2) of single values of x is then obtained by means of the customary analysis of variance, when use is made of the experi- mental design eliminating a number of known sources of variation in mean values of
x
for each inoculum.Further procedure resembles that used to test different equations for expressing the relationship between numbers of lesions and virus concentra- tions (Kleczkowski, 1950).
Mean values of x are decimal logarithms of geometric means of experimental values (y+c), whereas the values of Y (given by equation (2)) are expected arithmetic means of the values of y. Thus the values of Y must be transformed into decimal logarithms of expected geometric means of values (y+c), and the logarithms can then be directly’ compared with mean values of x. The
(4)
transformation is Z = log10 ( Y
+
c),-
1 *149s2,where 2 is an estimate of the logarithm of the geometric mean and s2 the
estimate of the variance of single values of x obtained from the analysis of variance (Kleczkowski, 1950).
Z((Xi -Zi)', where Xi's are the mean values of x obtained with different inocula and Zi's are the corresponding values of Z of equation (4). As the values of x can be assumed to be normally distributed around the corresponding values of Z with the same variance, the method of the least squares of adjusting the values of the constants is here equivalent with the method of maximum likelihood,
If each X is a mean of n values of x, nX(Zi-Z,)2/?F' (where W is the number of degrees of freedom equal to the number of inocula minus the number of adjustable constants), should give an estimate of the variance of single values of x independently of that given by s2, obtained from the customary procedure
of the analysis of variance. If the hypothesis on which equation (1) is based is true, the two estimates should be compatible, and this can be tested by the variance-ratio test.
Adjusting the values of the constants is usually the most laborious part of the procedure. There may be several ways of doing this but all start by guessing likely values of the constants, substituting them and computing the results. Successive improvements are then made. Sometimes the two esti- mates of the variance can be made compatible by a few successive improve- ments of the values of the constants simply by guesses helped by inspecting the last results. Various graphical methods of adjusting the constants can also be used. If the two estimates of the variance still remain incompatible, several successive improvements of the constants can finally be made by computing increments to be added to the constants by solving the 'normal' equations :
A N C ( - - $ & ) + A @ ~ $ ) ' + A h C ( $ ~ ) + A k C ( $ - & )
az
az
a z a .
az.az.
=C(+(z,-Z,)),The partial derivatives are
az
0.4343N--
8 2 0.lSSSN
_ -
298
A .
Klecxkowski
experimental data. If the two estimates of the variance remain incompatible, the adjustment of the constants can be discontinued when it becomes obvious that the value X(Zi - Zi)2 cannot be further reduced to any appreciable extent. It can then be concluded that the hypothesis is incompatible with the data.
The course of inactivation of two viruses by ultraviolet radiation
As an example of application of the method results of three experiments made by Bawden & Kleczkowski (1953) with ultraviolet-irradiated viruses (Exps. 1, 2 and 4 in Table 3 of their paper) will be tested for compatibility
with the hypothesis that inactivation by ultraviolet radiation is a first-order reaction. If it is, the fraction p of the original activity left after the time t of irradiation will be
p = e-kt, ( 5 )
where
k
is an adjustable constant whose value depends on experimental conditions. Equation (1) takes the form of ( 5 ) , the variable v becoming t.Table 1 shows the results of analyses of variances carried out on the values of x obtained by (3) using 5 as the constant c, and Tables 2-4 show the results
of testing the experimental data for compatibility with the hypothesis. In Exp. 4 (Table 4) tobacco mosaic virus was irradiated at two different
concentrations, so that two different values of k
(k,
and k,) had to be used. Had it been necessary to use the ‘normal’ equations for adjusting the values of the five constants involved, there would have been five such equations.The results of Exps. 1 and 4 (Tables 2 and 4) are compatible with the hypothesis, whereas those of Exp. 2 (Table 3) are not. However, although the deviations of the values of 5 from the corresponding values of 2 are statistically significant, they are small, so that it can be concluded that if the inactivation is not exactly a first-order reaction, its course approaches that
of a first-order reaction quite closely. It is, of course, also possible that the inactivation is exactly a first-order reaction and that Exp. 4 contained some
experimental inaccuracies that were not allowed for in the treatment of the data.
REFERENCES
BAWDEN, F. C. & KLECZKOWSKI, A. (1953). The behaviour of some plant viruses KLECZKOWSKI, A. (1949). The transformation of local lesion counts for statistical
KLECZKOWSKI, A. (1950). Interpreting relationships between the concentrations of after exposure to ultraviolet radiation. J . gen. Microbiol. 8, 145.
analysis. Ann. appl. Biol. 36, 139.
plant viruses and numbers of local lesions. J . gen. Microbiol. 4, 53.
Table 1. Analyses of variances Exp. 1 Exp. 2 Exp. 4
h
3
3.Virus
. . .
Rothamsted tobacco necrosis virus Rothamsted tobacco necrosis virus Tobacco mosaic virus Host plant...
French bean French bean N,icotiana glutinosas.
h Between inocula h L A r \I >I >5
Degrees of Sums of Mean square Degrees of Sums of Mean square Degrees of Sums of Mean square3
freedom squares (s2) freedom squares (87 freedom squares (s2) .o - 7 11.6574 - 11 12.9707 - 7 12.1 369 - - - - - - _. 4, 1.6568 2 Between leaf levels* Left-right half-leaves 1 0.0163 - 1 0.0181s-
k?
Between plants (or blocks of plants) 13 0.4990 - 13 0.7670 - 8 5.1 102 I Residual 90 1 -4004 0.0156 00 0.9797 0~0100 86 4.4219 0.051 4
5k
- - - -- c3. 107 24-1 596SI
s
A .
Klecxkomski
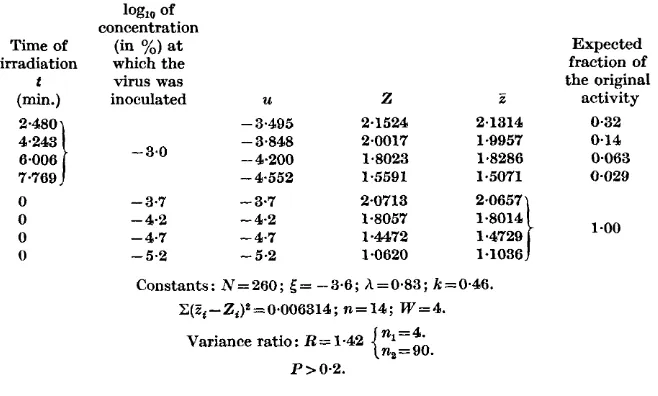
Table 2. Comparison of experimental with computed values for Exp. L
Rothamsted tobacco necrosis virus irradiated as a 1 yo solution
log,, of
concentration
Time of (in
yo)
atirradiation which the
t virus was
(min.) inoculated U 2
Expected fraction of the original
z activity
2.480 - 3.495 2.1524 2.1314 0.32
- 3.848 2.0017 1.9957 0.14
]
-3.0 - 4.200 1.8023 1,8286 0.0634.243
8.006
7,789 - 4.552 1.5591 1.5071 0-029
0 0 0
0
- 3.7 - 3.7 2.0713 2.0657
- 4.2 - 4.2 1.8057 1.8018
- 4.7 - 4.7 1 4472 1.4729
- 5.2 - 5.2 1.0620 1.1038
Constants : N = 260 ; 6 = - 3.6 ; h = 0.83 ; k = 0.46.
X(Z5
-
Zi)z = 0.006314 ; n = 14 ; W = 4.}
1.00Variance ratio : R = 1.42
{El
P > 0.2.
Table 3. Comparison of ezperirnental with computed values for Exp. 2
Rothamsted tobacco necrosis virus irradiated as a 0.1 % solution.
~ o g , , of
concentration
Time of (in yo) at Expected
irradiation which the fraction of
t virus was the original
(min.) inoculated u 2 2 activity
0.58 - 3.736 2.0313 1.0807 0.18
1.42 I
1.84 ) - 5.333 0.9334 0.9600 0.0047
0 - 3.7 - 3.7 2.05 12 2.0943
0 - 4.2
-
4.2 1.7315 1.77140 - 4.7 - 4.7 1.3650 1.3700
0
-
5.2 - 5.2 1.0185 0.9921-
4.268 1.6835 1.6221 0.054- 4.801 1.2903 1 *34443 0.016
'*O0!- -3.0
Constants : N = 580; 6 =
-
2.8; h = 1.03; k = 2.92.I;(Zi-2i)2=0~0141; n=14; W=4.
Variance ratio : R = 4.5275
{::to,
Table 4. Comparison of experimental with computed values for Exp. 4 Tobacco mosaic virus log,, of Time of concentration irradiation (in
yo)
at which t the virus was (min.) inoculated U z 2.0876 - 3.503 1-8383 - 4.005 1.559511-55 15.40
- 4.506 1-2644 - 3.002 - 2.5 Virus irradiated as a 0.5 % solution Virus irradiated as a 0.01
yo
solution 0.575 - 3.163 2-0038 - 3.822 1-6619 - 4.485 1 -2784 2.300, - 5.147 0-93M 1.150) - 2.5 Unirradiated virus0 0 0 0
- 3.0
-
3.0 2.0876 - 3.5 - 3.5 1.8383 - 4.0 - 4.0 1.5595 - 4.5 - 4.5 1.2697 Constants: N=850; [= -1.6; A=1.4; k, = 0.3 (for 0.5 "/b virus solution) ; k,=2-65 (for 0.01 yo virus solution). C(Z,-Z&*=O*0589; n=9 ; W=7. Variance ratio : R = 1.478{
Ei
:;,
1.9633 1-8933 1.5178 1.3111 1.9333 1 *7800 1.1989 0.971
1
2.1456 1.7689 1.5833 1.271
1 ) Expected fraction of the original
activity 0.32 0.099 0-0098
9
E
0.031
3.
@. cr, n n L
0.22 0.047 0*0104
s?
z
%
0-0023
P=
0.2