O R I G I N A L A R T I C L E
Open Access
From the bottom to the top: a more complete
picture of the immigrant-native wage gap in
Britain
Priscillia Hunt
1,2Correspondence:[email protected]
1
RAND Corporation, 1774 Main Street, Santa Monica, CA 90407, USA
2IZA, Bonn, Germany
Abstract
This paper investigates wage assimilation of foreign-born male workers in Britain over the period 1993 to 2009. Using Labour Force Survey data, the paper employs a methodology (Blinder-Oaxaca quantile regressions) to decompose the
immigrant-native wage differential at the mean and across the conditional wage distribution. Although immigrants earn more on average than natives, mean results mask that immigrants at the bottom (top) of the distribution earn less (more) than natives. Over the period investigated, the pro-UK-born unexplained component of the wage gap was greater at the bottom of the distribution and has shifted towards the centre of the distribution.
Jel codes:J15, J16, J31, J71
Keywords:Wage assimilation, Decomposition, Quantile regression, Immigrant
Introduction
International migrants comprise an increasing proportion of the population in many countries throughout the world. This is evident in the United Kingdom (UK) where the proportion of international migrants (immigrants) increased 60%, from 6.5% to 10.4% of the population from 1990 to 2010 (United Nations 2009). Where the UK dif-fers from many other developed countries, however, is that immigrants earn more on average than natives (Dustmann et al. 2010). After controlling for a number of factors known to influence earnings, analysis suggests immigrants should be earning even more (Denny et al. 1997; Dustmann and Fabbri 2005; Bell 1997).
Whilst differences in human capital endowment and socio-economic characteristics explain some of the lack of earnings assimilation (Elliott and Lindley 2008), there are still unexplained differences in earnings between immigrants and natives. In order to better understand wage differentials, decomposition techniques are used to estimate the‘explained’portion of a wage gap due to differences in observed characteristics and the‘unexplained’portion of the wage gap due to differences in returns to those charac-teristics (typically referred to as discrimination). When the earnings distribution is quite wide or skewed, there are also questions about whether discrimination differs across the conditional distribution.
In order to more fully describe wage assimilation in Britain, this study estimates wage differentials of immigrant and native males using Blinder-Oaxaca (B-O) decompositions. We also apply the Machado and Mata (2005) technique to estimate B-O decompositions across the distribution using quantile regressions. We utilise data from the Labour Force Survey (LFS) for countries of Britain over the period 1993 to 2009 and focus on prime working age males in non-self-employment. This is the first study we are aware of that decomposes wages of immigrant and native males in Britain over this period and also describes decompositions across the conditional wage distribution.
The remainder of this paper is organised as follows. Chapter 2 surveys literature look-ing at sources of the immigrant-native wage gap in the UK and outlines the theoretical underpinning of the empirical strategy. Chapter 3 describes the empirical model and estimation strategy. Chapter 4 presents the data set and Chapter 5 presents results. The final chapter 6 concludes with policy implications and areas for further research.
Background
In most developed countries, salaried immigrants earn less than salaried natives. In Britain, however, immigrants’ raw wages are greater than natives’ (Dustmann et al. 2010) and immigrants have more years of education (Clark and Drinkwater 2009). When controlling for human capital and socio-economic characteristics, a different picture emerges and immigrants’conditional earnings are less than natives’. Research has mainly focused on the role ethnicity plays in describing this wage gap because Britain experienced a shift from largely South Asian and East African immigrants to European migrants following several European Community-related policies on free movement since the 1980’s. Denny et al. (1997) use the approach developed in Jenkins (1994) to examine discrimination indices across the distribution in Britain using General Household Survey (GHS) data from 1974 to 1993. Comparing different ethnic groups, authors find non-whites in Britain face wage discrimination generally and non-white immigrants face slightly more discrimination. Whilst the GHS is a useful household survey, the sample size and immigrant demographic profile are limited for labour market analysis given relatively low numbers of immigrants in Britain. Using LFS data over the period 1993 to 2000, Dustmann et al. (2003) find non-white immigrants earned 10% less than non-white natives, even after accounting for a variety of characteristics known to affect wages. One explanation for the lack of wage assimilation for non-white immigrants is that they were overrepresented in low paid occupations (Elliott and Lindley 2008). Another explanation for the wage gap is that immigrants earned less for the same observable characteristics and, thus, faced discrimination in the labour market (Bell 1997; Clark and Lindley 2006). Given the methods applied, however, it is unclear whether immigrants earn less than natives due to differences in the distributions of their characteristics or immigrants face discrimination. As for white immigrants in Britain, they earn more than their white native counterparts, yet this dissipates over time. Some of this pattern appears to be due to selection into higher paying jobs rather than positive discri-mination in favour of white immigrants (Elliott and Lindley 2008).
techniques. We identify only one such study in Britain for immigrants. Elliott and Lindley (2008) apply the B-O technique to break down the wage gap between immigrant groups and the base category of white natives for full-time employed males using British LFS data over the period 1993 to 2003. Authors find a majority of the observed mean earnings dif-ference between white and non-white immigrants is attributed to unexplained difdif-ferences, including ethnic discrimination. As immigrants’earnings performance varies widely (Shields and Price 2002), the unexplained difference may diverge for those at the bottom than the top of the skills distribution. Rather than focusing investigation on decomposing the mean wage gap for a variety of ethnic-immigrant groups, we investigate differences of decomposi-tions across the conditional distribution.
Empirical strategy
Following the enhanced human capital regression approach of Mincer (1974), we ini-tially estimate a single wage equation on a pooled sample of immigrants and natives of the form:
wi¼βXiþπMiþγTiþδRiþεi; ð1Þ
where wi is logarithm of gross hourly wages for individual i, Xi is a vector of typical human capital and socio-economic characteristics applicable to natives and immigrants (education, experience, part/full-time, industry, ethnicity, marital status and an intercept term) explaining wages for individualsi,Miis a dummy variable indicating whether indi-vidual i was born in England, Scotland, Wales or Northern Ireland (UK-born) and 1 if born abroad (non-UK-born),Ti is a set of dummy variables controlling for year of the survey (1993-2009) and Riis a set of dummy variables that control for eleven regions of Britain (nine government office regions of England, Scotland, and Wales). The error term, εi, captures the unobserved components of wages. The coefficient of interest, π, indicates the wage premium associated with being an immigrant. We also estimate equa-tion (1) separately for immigrants and natives to observe whether there are differences in returns for immigrants and natives.
We then estimate this model for immigrants only with a further set of human capital and socio-economic characteristics to investigate immigration-specific factors potentially driving the value of π. Research shows assimilation can occur over time with increasing length of stay in the host country (Constant and Massey 2003). We, therefore, include years since immigrated inXi. Earnings assimilation may be also affected by the time period
in which immigrants arrived (Borjas 1995). Economic or social conditions of the host country can lead to differential wage profiles for different cohorts and we, therefore, include inXia set of dummies for cohort groups of entry. Since home country conditions,
language and culture may influence the returns to human capital characteristics, we esti-mate the model separately for those from English-speaking and non-English-speaking countries (Manning and Roy 2010; Constant et al. 2012).
Decompositions
decompositions have been shown to be a useful technique in immigration research to determine whether various dimensions, such as ethnicity or language, drive differences in labour market assimilation (Constant et al. 2012). We then estimate an extension of the B-O technique to quantile regressions (QR) as in Machado and Mata (2005). The wage gap becomes the difference between immigrants’predicted wage at each quantile, θ, using a generated wage distribution and the counterfactual distribution for natives (Chernozhukov et al. 2012).
Of particular interest is the gap in pay immigrants would face at theθthquantile if their distribution of characteristics were the same as natives but they received immigrant returns, or discrimination. Depending on the extent to which returns vary, immigrants at the bot-tom of the conditional wage distribution may experience less wage assimilation than immi-grants at the top (known as a ‘sticky floor’), or vice versa (a‘glass ceiling’). The definition used for sticky floors and glass ceilings in this paper is provided in Arulampalam et al. (2007). A sticky floor refers to a situation in which the wage gap at the 10thpercentile is at least 2 percentage points greater than the 25th percentile wage gap. A glass ceiling is observed if the 90th percentile wage is 2 percentage points greater than the wage gaps estimated at the other parts of the wage distribution.
A potential bias of our approach is selectivity in which only employed persons are included and individuals facing employment discrimination, or choosing ‘zero’ wages or self-employment due to weak employment offers, are excluded. We do not correct esti-mates for employment selection bias for two key reasons. First, the selectivity component of the raw wage gap in Britain has been shown to be minor with the white/non-white earnings gap changing by 1% when correcting for selectivity (Blackaby 2002). Second, correction methods often depend on the selection of arguable instruments that potentially introduce another imprecision. Furthermore, it does not appear to be essential because Elliott and Lindley (2008) show the ethnic earnings gap in Britain is robust to selection effects.
Data
The analysis in this paper is based upon the UK quarterly Labour Force Survey (LFS), which is a systematic, random sample design of an ordered list of postcodes (implicit stratified design). The LFS is a continuous survey of nearly 60,000 households each quarter, approximately 140,000 individuals, over five consecutive waves. In addition to providing demographic information, individuals respond to a range of labour market questions, such as earnings, education, work experience and industry of employment1. From the winter of 1992/1993 onwards, earnings questions are asked in individuals’ wave five; and from 1997 onwards, individuals are additionally asked in wave one. The empirical analysis is based on 68 pooled LFS quarters from the first quarter of 1993 through the fourth quarter of 2009; we utilise unique observations for any individual.
learning age is 16 years old (meaning in practice, children are compelled to attend school until obtaining their General Certificate of Secondary Education) and the default or forced retirement age in Britain was 65.
Although the LFS collects educational qualifications, foreign qualifications are coded as ‘other’ and immigrants are more likely than natives to use this response. Alternatively, education leaving age has been shown to be a good proxy for qualifications (Elliott and Lindley 2008) and is thus used to compare years of schooling. We distinguish 11 regional units of residence: the two constituent countries Wales and Scotland, and nine govern-ment office regions in England including London, South East, South West, East2, East Midlands, West Midlands, North East, North West, and Yorkshire and the Humber. We exclude those residing in Northern Ireland because the ethnicity question is not compa-rable with the question asked for the rest of the UK.
Immigrant status is defined by country of birth, a definition used in other immigrant-native labour market studies of the UK as well (Dustmann and Fabbri 2005). Immigrants refer to those not born in England, Scotland, Wales or Northern Ireland. Another defi-nition could additionally utilise the year of arrival and consider only those arriving after compulsory education (age 11 or above) to truly be international migrants. Our general conclusions do not change when defining immigrants as those arriving after the age of 10 (see the Additional file 1: Appendix Table S9 for these results). In the wage equations, we include three cohort entry periods (pre-1956, 1956-1985 and 1986-2008, using the first cohort as the reference group)3. To capture potential language effects on earnings, we iden-tify those coming from a country in which the main language is English or non-English. We classify English-speaking countries as those where the main language is English including the following: Aruba, Australia, Barbados, Belize, Bermuda, Canada, Caribbean Common-wealth islands, Jamaica, Newfoundland, Nova Scotia, other New CommonCommon-wealth, New Zealand, other Old Commonwealth, Republic of Ireland, South Africa, Tasmania, Trinidad and Tobago, West Indies, and United States. All others are classified as from non-English speaking countries. This classification is only used from 1997 onwards when the LFS begins providing individual countries of birth. Over the period 1997 to 2009, the largest propor-tions of wage earning immigrants were from India (11%), Germany (6.7%), Pakistan (5.3%) and South Africa (4.5%). During this period, however, there were changes in immigrants’ countries of origin. Much of the change in source countries involves the effect of the 2004 EU enlargement in which workers from Accession Eight (A8) countries gained access to some EU labour markets, resulting in the largest migration flows in contemporary Europe. In the UK in particular, the majority of A8 migrants arrived from Poland, such that Poles were the single largest foreign national group resident in the UK by year end 2007 (Trevena 2009). Exploring our LFS data from 2005-2009 for male wage earners, we also observe this trend in which Poland enters the top five countries in terms of proportions in the immigrant population: India (10.6%), Poland (8.9%), Pakistan (5.1%), Germany (5.0%) and Republic of Ireland (4.7%).
entire period 1993 to 2009 with missing data is 328,307 (26,926 of which are non-UK-born). The proportion of immigrants in the sample grows from 6.0% in 1993 to 11.2% in 2009.
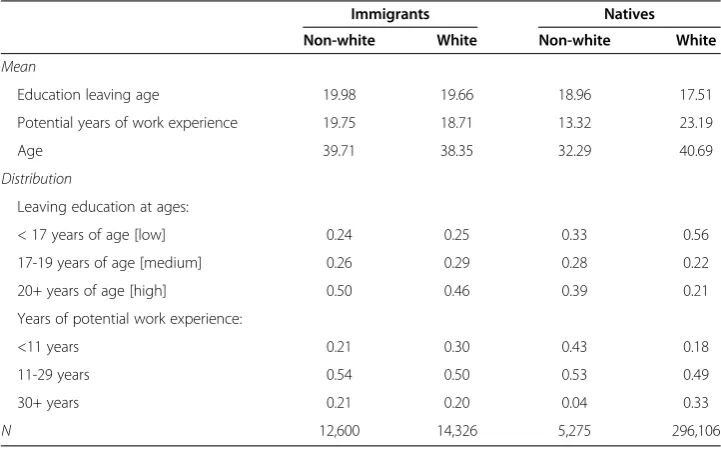
Human capital differences between ethnic and nativity groups are detailed in Table 1. The non-white native sample is younger than the other ethnic-nativity groups and thus not surprisingly has worked substantially fewer years. Non-white native males of the UK have more years of education on average than their white counterparts, leaving full-time education at approximately 19 years and 17 years of age respectively. Although the mean education leaving age of immigrants and natives is approximately similar, 19 and 18 years of age respectively, the mean leaving age masks the distri-butional issues discussed earlier. Approximately 50% of non-white and 46% of white immigrants responded leaving full-time education at 20 years of age or older, while slightly more than 20% of white and 39% of non-white natives left full-time education at 20 years of age.
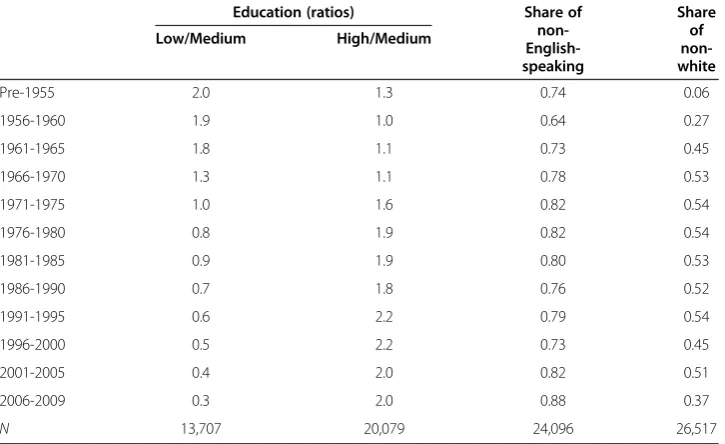
Changes in the human capital and socio-economic characteristics of immigrants are illustrated in Table 2. Relative to the medium-educated, there has been a decrease in low-educated and increase in high-educated immigrant workers. During the late-1950’s through the 1970’s, the share of immigrants coming from a country where the main language is not English increased and remained stable until increases in the 2000’s. Regarding ethnicity, there was an increase in the proportion of non-white immigrants entering the UK from the 1950’s to the 1970’s, until there was a sharp decrease in the last five years of the sample. The pre-1970’s increases in non-white and non-English-speaking country of origin (as the main language) immigrants coincide with the British Nationality Act of 1948, which gave all Commonwealth citizens free entry into Britain. During this Act, individuals from the Indian subcontinent and Caribbean communities accessed their right to enter the UK. The later years of relative increases in non-English
Table 1 Education, potential work experience and age, by ethnic-nativity groups
Immigrants Natives
Non-white White Non-white White
Mean
Education leaving age 19.98 19.66 18.96 17.51
Potential years of work experience 19.75 18.71 13.32 23.19
Age 39.71 38.35 32.29 40.69
Distribution
Leaving education at ages:
< 17 years of age [low] 0.24 0.25 0.33 0.56
17-19 years of age [medium] 0.26 0.29 0.28 0.22
20+ years of age [high] 0.50 0.46 0.39 0.21
Years of potential work experience:
<11 years 0.21 0.30 0.43 0.18
11-29 years 0.54 0.50 0.53 0.49
30+ years 0.21 0.20 0.04 0.33
N 12,600 14,326 5,275 296,106
speaking white immigrants accord with the EU enlargements of 1995 and 2004, which allowed people from mainly Northern Europe and then Eastern Europe to work in the UK. Figure 1 shows hourly pay by ethnic-nativity groups from 1993 to 2009. The non-white, UK-born were the lowest earners until 2003 when non-white immigrants became the lowest paid workers. Although white immigrants always earn more than any other group, their wages decreased from 2005 to 2006. This timing is consistent with the increased inflow of A8 migrants.
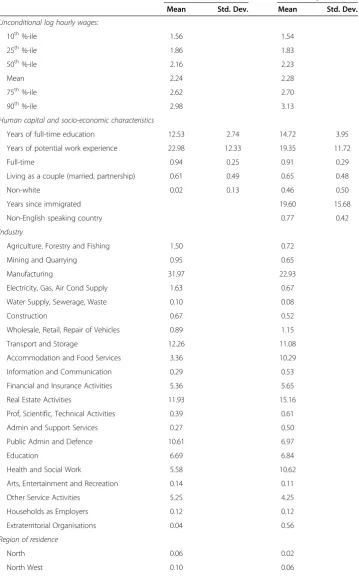
The data used in the analysis is summarised below in Table 3. The table includes descrip-tive statistics for aggregated data of individual level responses from the 1993-2009 LFS data of employed males. The data show non-UK-born workers earn more than UK-born workers and are on average slightly younger. Non-UK-born have on average two more years of Table 2 Summary of immigrant cohort period of entry to the UK, 1993-2009
Education (ratios) Share of
non- English-speaking
Share of non-white
Low/Medium High/Medium
Pre-1955 2.0 1.3 0.74 0.06
1956-1960 1.9 1.0 0.64 0.27
1961-1965 1.8 1.1 0.73 0.45
1966-1970 1.3 1.1 0.78 0.53
1971-1975 1.0 1.6 0.82 0.54
1976-1980 0.8 1.9 0.82 0.54
1981-1985 0.9 1.9 0.80 0.53
1986-1990 0.7 1.8 0.76 0.52
1991-1995 0.6 2.2 0.79 0.54
1996-2000 0.5 2.2 0.73 0.45
2001-2005 0.4 2.0 0.82 0.51
2006-2009 0.3 2.0 0.88 0.37
N 13,707 20,079 24,096 26,517
Source: Author’s LFS sample. Employed males only.
£5 £7 £9 £11 £13 £15 £17
1993 1994 1995 1996 1997 1998 1999 2000 2001 2002 2003 2004 2005 2006 2007 2008 2009 Native,White Native,Non-white Imm,White Imm,Non-white
Table 3 Summary statistics of analytical sample
Variable Natives Immigrants
Mean Std. Dev. Mean Std. Dev.
Unconditional log hourly wages:
10th%-ile 1.56 1.54
25th%-ile 1.86 1.83
50th%-ile 2.16 2.23
Mean 2.24 2.28
75th%-ile 2.62 2.70
90th%-ile 2.98 3.13
Human capital and socio-economic characteristics
Years of full-time education 12.53 2.74 14.72 3.95
Years of potential work experience 22.98 12.33 19.35 11.72
Full-time 0.94 0.25 0.91 0.29
Living as a couple (married, partnership) 0.61 0.49 0.65 0.48
Non-white 0.02 0.13 0.46 0.50
Years since immigrated 19.60 15.68
Non-English speaking country 0.77 0.42
Industry
Agriculture, Forestry and Fishing 1.50 0.72
Mining and Quarrying 0.95 0.65
Manufacturing 31.97 22.93
Electricity, Gas, Air Cond Supply 1.63 0.67
Water Supply, Sewerage, Waste 0.10 0.08
Construction 0.67 0.52
Wholesale, Retail, Repair of Vehicles 0.89 1.15
Transport and Storage 12.26 11.08
Accommodation and Food Services 3.36 10.29
Information and Communication 0.29 0.53
Financial and Insurance Activities 5.36 5.65
Real Estate Activities 11.93 15.16
Prof, Scientific, Technical Activities 0.39 0.61
Admin and Support Services 0.27 0.50
Public Admin and Defence 10.61 6.97
Education 6.69 6.84
Health and Social Work 5.58 10.62
Arts, Entertainment and Recreation 0.14 0.11
Other Service Activities 5.25 4.25
Households as Employers 0.12 0.12
Extraterritorial Organisations 0.04 0.56
Region of residence
North 0.06 0.02
education than the UK-born and four years less work experience. Average age at immigra-tion is 19 years old and average number of years in the UK is 19 years. This is similarly reported in Dustmann et al. (2003) in which they find immigrant male workers in LFS data on average have 19 years in the UK. There are significantly more non-whites in the immi-grant than native, working age male LFS sample. Less than 2% of working-age wage earning, UK-born males are non-white and 46% of non-UK-born are non-white.
Results
Wage equations
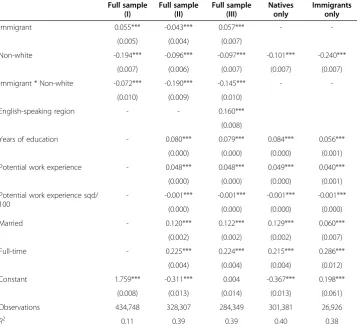
To investigate the relationship between immigration status and pay, we begin by esti-mating equation (1) for a pooled sample of immigrants and natives and then separately for immigrants and natives with an additional set of characteristics. In the results, Table 4, the effects are relative to the default category UK-born white for columns one through three, and white in the separate equations of columns four and five.
Column one shows white immigrants appear to have a wage advantage of approxi-mately 5% over white natives and non-white immigrants face a 21% wage disadvantage to white natives. When controlling for characteristics, column two shows the immi-grant premium is eliminated and immiimmi-grants appear to earn 4% less than natives. In addition, non-white immigrants earn 19% less than white natives in Britain. However, when we add a variable for English-speaking region of birth in column three, the sign on immigrant status switches to positive again and is of similar magnitude as initially estimated in Model (1). The sign and magnitude of variables for non-white remain similar. This suggests it is language, culture or country-sponsorship arrangements rather than being foreignper sethat influences wage differentials.
When examining separate wage equations in column four and five, we see that non-whites face more than double the wage disadvantage for belonging to the immigrant than native group. Returns for every human capital and socio-economic characteristic appear lower for immigrants than natives, except full-time employment. Years of edu-cation and marital status appear to have different partial effects on hourly pay for immigrants and natives. Each additional year of schooling is associated with greater pay for natives than immigrants. Being married or in a civil partnership, as opposed to
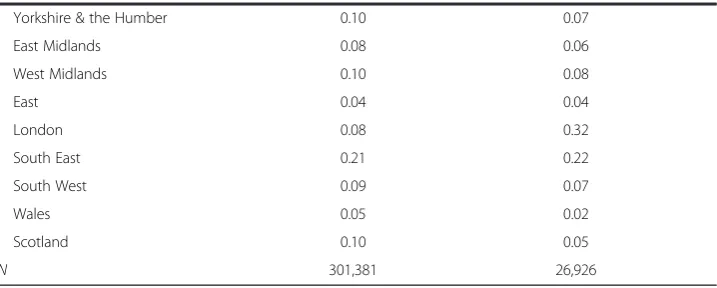
Table 3 Summary statistics of analytical sample(Continued)
Yorkshire & the Humber 0.10 0.07
East Midlands 0.08 0.06
West Midlands 0.10 0.08
East 0.04 0.04
London 0.08 0.32
South East 0.21 0.22
South West 0.09 0.07
Wales 0.05 0.02
Scotland 0.10 0.05
single/never been married, widowed or divorced, is associated with greater pay for immigrants than natives. These results indicate immigrants possess‘more’of the bene-ficial characteristics that influence wages and thus earn more on average than natives, but they face a wage penalty for belonging to the immigrant group.
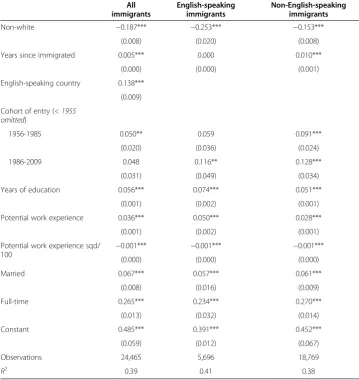
Before decomposing this wage gap, we further investigate assimilation and the associ-ation of immigrant-specific characteristics with wages. Table 5 estimates wage equassoci-ations with additional variables (years since immigrated, main language of source country and cohort year of entry) and separately for immigrants from English-speaking and non-English-speaking countries. The first column shows average returns for all immigrants with effects relative to white, non-English-speaking country of birth. All else equal, being from a country where the main language is English is associated with approximately 15% increase in immigrants’ hourly pay. Each additional year in Britain is associated with a 0.5% increase in hourly pay, which may be viewed as a measure of assimilation.
Column two and three results suggest wage assimilation associated with time in Britain is mainly gained by those from non-English-speaking source countries. Immigrants from English-speaking countries earn more for each additional year of education than those from non-English-speaking countries, 7.4% and 5.1% respectively. As we cannot disen-tangle this result from qualifications, this may be evidence that the British labour market places a greater value on qualifications earned in English-speaking countries.
Table 4 OLS estimates for logarithmic gross hourly wages, 1993-2009
Full sample (I)
Full sample (II)
Full sample (III)
Natives only
Immigrants only
Immigrant 0.055*** -0.043*** 0.057*** -
-(0.005) (0.004) (0.007)
Non-white -0.194*** -0.096*** -0.097*** -0.101*** -0.240***
(0.007) (0.006) (0.007) (0.007) (0.007)
Immigrant * Non-white -0.072*** -0.190*** -0.145*** -
-(0.010) (0.009) (0.010)
English-speaking region - - 0.160***
(0.008)
Years of education - 0.080*** 0.079*** 0.084*** 0.056***
(0.000) (0.000) (0.000) (0.001)
Potential work experience - 0.048*** 0.048*** 0.049*** 0.040***
(0.000) (0.000) (0.000) (0.001)
Potential work experience sqd/ 100
- -0.001*** -0.001*** -0.001*** -0.001***
(0.000) (0.000) (0.000) (0.000)
Married - 0.120*** 0.122*** 0.129*** 0.060***
(0.002) (0.002) (0.002) (0.007)
Full-time - 0.225*** 0.224*** 0.215*** 0.286***
(0.004) (0.004) (0.004) (0.012)
Constant 1.759*** -0.311*** 0.004 -0.367*** 0.198***
(0.008) (0.013) (0.014) (0.013) (0.061)
Observations 434,748 328,307 284,349 301,381 26,926
R2 0.11 0.39 0.39 0.40 0.38
Comparing to the previous estimation in which non-white immigrants face a wage disadvantage, results in Table 5 indicate immigrants from English-speaking countries face more of this ethnic discrimination than those from non-English-speaking coun-tries. This may be the result of discrimination towards black Caribbean individuals in particular (Dustmann et al. 2003). All else equal, recent immigrants earn more than previous cohorts. This difference over time is particularly noticeable for those from English-speaking countries and thus an indication that home country changes rather than conditions in Britain at the time of entry or specific immigration policies between these countries are associated with improved wages.
Decomposition analysis
Table 6 decomposes wage differences between immigrants and the base category of natives split into three columns based on timeframe of analysis: the entire sample from 1993 to 2009; the 1997 LFS data only (when more detailed country data was first Table 5 OLS estimates for logarithmic gross hourly wages by language of origin group, 1997-2009
All immigrants
English-speaking immigrants
Non-English-speaking immigrants
Non-white −0.187*** −0.253*** −0.153***
(0.008) (0.020) (0.008)
Years since immigrated 0.005*** 0.000 0.010***
(0.000) (0.000) (0.001)
English-speaking country 0.138***
(0.009)
Cohort of entry (< 1955 omitted)
1956-1985 0.050** 0.059 0.091***
(0.020) (0.036) (0.024)
1986-2009 0.048 0.116** 0.128***
(0.031) (0.049) (0.034)
Years of education 0.056*** 0.074*** 0.051***
(0.001) (0.002) (0.001)
Potential work experience 0.036*** 0.050*** 0.028***
(0.001) (0.002) (0.001)
Potential work experience sqd/ 100
−0.001*** −0.001*** −0.001***
(0.000) (0.000) (0.000)
Married 0.067*** 0.057*** 0.061***
(0.008) (0.016) (0.009)
Full-time 0.265*** 0.234*** 0.270***
(0.013) (0.032) (0.014)
Constant 0.485*** 0.391*** 0.452***
(0.059) (0.012) (0.067)
Observations 24,465 5,696 18,769
R2 0.39 0.41 0.38
available); and the 2009 LFS data only. The last two columns present wage differentials between natives and English-speaking immigrants and with non-English-speaking immi-grants over the period 1997 to 2009.
Given wages for natives are generally lower on average than for immigrants, column one shows the total log-pay differentials over the full period are negative. A benefit of performing decomposition analysis can be seen here where the negative total differential is smaller than the negative characteristic effect, which implies the unexplained compo-nent favours natives. In other words, the raw wage advantage is due to immigrants’ greater set of endowments and immigrants would earn more for their characteristics if they belonged to the native group. Natives benefit more from greater levels of schooling, although we cannot determine the precise labour market value of education because we cannot distinguish between types of qualifications. Natives also earn more for each additional year of potential work experience. The decline in returns to potential Table 6 OLS results for logarithmic gross hourly wage decompositions
By timeframea By languagea
1993-2009 1997 2009 English-speaking non-English-speaking
Total differential −0.059*** −0.034* 0.087** −0.290*** −0.040***
(0.005) (0.020) (0.017) (0.009) (0.006)
Characteristic −0.140*** −0.096*** −0.086*** −0.250*** −0.164***
(0.004) (0.015) (0.011) (0.006) (0.005)
Coefficient 0.081*** 0.057*** 0.173*** −0.041*** 0.124***
(0.005) (0.017) (0.017) (0.008) (0.006)
Coefficient components
Education 0.412*** 0.406*** 0.405*** 0.224*** 0.461***
(0.017) (0.063) (0.055) (0.038) (0.019)
Experience 0.184*** 0.230** 0.265*** 0.018 0.261***
(0.021) (0.093) (0.067) (0.047) (0.025)
Experience sqd./100 −0.071*** −0.073 −0.126*** 0.033 −0.112***
(0.012) (0.053) (0.038) (0.026) (0.014)
Non-white 0.018*** 0.029*** 0.014* 0.028*** 0.009*
(0.002) (0.010) (0.007) (0.003) (0.004)
Married 0.046*** 0.095*** 0.045*** 0.034*** 0.050***
(0.005) (0.020) (0.016) (0.009) (0.006)
Part-time −0.057*** −0.044 −0.020 −0.022 −0.053***
(0.014) (0.050) (0.036) (0.036) (0.015)
Industry 0.026*** 0.040*** 0.025** −0.071*** −0.013**
(0.009) (0.013) (0.010) (0.009) (0.006)
Region −0.005** −0.006 0.004 −0.016*** −0.010***
(0.002) (0.006) (0.005) (0.004) (0.002)
Year −0.001 - - 0.126*** 0.087***
(0.014) (0.016) (0.010)
Constant −0.536*** −0.667*** −0.526*** −0.579*** −0.706***
(0.040) (0.118) (0.095) (0.077) (0.038)
N 328,307 26,946 22,368 307,028 320,207
Standard errors in parentheses. *** p<0.01, ** p<0.05, * p<0.10. The total differential is equal to the characteristic (‘explained’) and coefficient (‘unexplained’) portions of the wage gap and any differences are due to rounding.
a
experience is slower for immigrants. This may be due to immigrants benefiting from additional years in Britain and thus wage assimilation.
In columns two and three, we observe an important shift in log-pay differentials. Whereas mean wages were greater for immigrants in 1997 (-0.03), natives earned more than immigrants in 2009 (0.09). The change in the wage differential can be almost entirely explained by increases in the unexplained component because the differential due to characteristics remained stable over the period. The greatest contribution to the increase in the unexplained component is a reduction in the unexplained difference favouring immigrants that cannot be attributed to any variables, e.g. intercept term. Perhaps importantly given interest in ethnic discrimination, the unexplained negative wage effect of being non-white fell slightly for immigrants from 1997 to 2009.
Turning to the last two columns, an interesting picture emerges. First, we see the log-differential is negative for both groups compared to natives indicating greater wages of immigrants. Immigrants from English-speaking and non-English-speaking countries earn more than natives due to a greater endowment of characteristics, 0.25 log points and 0.16 log points respectively. Second, the log-wage differential between non-English-speaking immigrants and natives would be significantly greater (0.12) if it were not for the wage enhancing coefficients of natives. This is not the case for English-speaking immigrants. There is evidence English-English-speaking immigrants experience a coef-ficient effect in their favour (-0.04). Third, the largest unexplained component of the decomposition is education, which favours natives more compared to non-English-speaking than English-non-English-speaking immigrants. Specifically, natives would earn approxi-mately 0.2 log points more for English-speaking immigrants’ educational attainment and 0.5 log points more for non-English-speaking immigrants’education. Lastly, some of the wage gap can be explained by the evidence that there is a negative wage effect of being non-white and a larger proportion of immigrants are non-white. However, there is another portion of the negative effect which is due to immigrants earning even less for being white, which is greater for English-speaking immigrants, 0.03, than non-English-speaking immigrants, 0.009. We consider this a form of discrimination since identical immigrants and natives received different returns to being non-white, particu-larly for immigrants with satisfactory language skills.
When examining panel (b) and (c), we observe temporal changes in the log differen-tial, particularly the unexplained component. In 1997, immigrants below the median earned less than natives and immigrants at or above the median earned more than natives. Immigrants faced a sticky floor such that those at the 10th percentile earned 10% less than similarly skilled natives and immigrants at the 25th percentile earned approximately 4% less than their native counterparts. In 2009, the differential shifted towards the middle of the distribution where the pay gap at the 25th percentile was greater than elsewhere and only those at the 90thpercentile earned more than natives. Whereas the coefficient effect reduced as a proportion of the total differential for those Table 7 OLS and QR results for immigrant-native wage decompositionsa
OLS Quantiles
0.10 0.25 0.50 0.75 0.90
(a) 1993-2009
Total differential −0.059*** 0.025** −0.002 −0.049*** −0.095*** −0.126***
Characteristic effect −0.140*** −0.082*** −0.130*** −0.182*** −0.237*** −0.289***
Coefficient effect 0.081*** 0.108*** 0.127*** 0.134*** 0.142*** 0.162***
(as % of total differential) (37%) (57%) (49%) (42%) (37%) (36%)
(b) 1997
Total differential −0.034* 0.109*** 0.036* −0.033* −0.089*** −0.129***
Characteristic −0.096*** −0.026 −0.104*** −0.171*** −0.228*** −0.272***
Coefficient 0.057*** 0.135*** 0.139*** 0.138*** 0.139*** 0.144***
(as % of total differential) (37%) (84%) (57%) (45%) (38%) (35%)
(c) 2009
Total differential 0.087** 0.112*** 0.144*** 0.101*** 0.015 −0.034*
Characteristic −0.086*** −0.035** −0.068*** −0.110*** −0.153*** −0.183***
Coefficient 0.173*** 0.148*** 0.213*** 0.211*** 0.168*** 0.149***
(as % of total differential) (67%) (81%) (75%) (66%) (52%) (45%) *** p<0.01, ** p<0.05, * p<0.10. Number of observations: 328,307 (panel a); 26,946 (panel b); 22,368 (panel c). The total differential is equal to the characteristic (‘explained’) and coefficient (‘unexplained’) portions of the wage gap and any differences are due to rounding.
a
UK-born is the reference group.
Table 8 OLS and QR results for immigrant country of origin decompositionsa, 1997-2009
OLS Quantiles
0.10 0.25 0.50 0.75 0.90
(a) English-speaking immigrants
Total differential −0.290*** −0.184*** −0.210*** −0.259*** −0.306*** −0.340***
Characteristic −0.250*** −0.166*** −0.192*** −0.231*** −0.275*** −0.306***
Coefficient −0.041*** −0.018 −0.019** −0.027*** −0.031*** −0.033*
(as % of total differential) (14%) (10%) (10%) (10%) (10%) (10%)
(b) non-English-speaking immigrants
Total differential −0.040*** 0.034*** 0.028*** −0.010 −0.053*** −0.082***
Characteristic −0.164*** −0.106*** −0.152*** −0.203*** −0.261*** −0.313***
Coefficient 0.124*** 0.140*** 0.180*** 0.193*** 0.203*** 0.231***
(as % of total differential) (43%) (49%) (54%) (49%) (44%) (42%) *** p<0.01, ** p<0.05, * p<0.10. Number of observations: 307,028 (panel a); 320,207 (panel b). The total differential is equal to the characteristic (‘explained’) and coefficient (‘unexplained’) portions of the wage gap and any differences are due to rounding.
a
at the 10thpercentile, it increased for those at other points of the distribution, particu-larly at the 25ththrough 50thpercentiles. These results suggest low-skilled immigrant workers were less of a target for wage discrimination, but that discrimination increased overall such that immigrants appear to have experienced a declining‘middle-class’.
QR decomposition results for main language of source country, Table 8, similarly paint a more complex picture than mean results. For English-speaking immigrants, the total log-pay differential is less at the bottom than the top of the distribution. The low-skilled (at the 10thpercentile) earn approximately 0.18 log points (20%) more than their native counterparts and the highly-skilled (90thpercentile) earn approximately 0.34 log points (40%) more than their native counterparts. The levels of both the coefficient and characteristic effects increase across the distribution and are greatest at the 90th per-centile. As a proportion of the pay differential, however, the unexplained component is broadly similar, approximately 10% of the wage gap, at points above the 10thpercentile. At the 10thpercentile, the coefficient effect is not statistically different from zero.
When examining results for non-English-speaking immigrants in panel (b) of Table 8, it is clear the labour market experience differs from English-speaking immigrants and the reason for performing QR technique is most apparent. We uncover the mean total log-pay differential in favour of immigrants conceals that immigrants from non-English-speaking countries earn less than natives below the median (lower skilled) and earn more than natives above the median (high-skilled). Specifically, immigrants from non-English-speaking countries at the 10th and 25th percentiles earn approximately 0.03 log points less than their native counterparts. At the median, the pay differential is not statistically different from zero. The highest-skilled immigrants from non-English-speaking countries (at the 90thpercentile) earn 0.08 log points more than highly-skilled natives. At all points along the distribution, non-English-speaking immigrants are endowed with greater characteristics and this characteristic component of the wage gap increases with skill (wage). The coefficient effect favours natives and increases across the distribution such that the level of the unexplained component of the wage gap is greater for higher-skilled immigrants, approximately 0.2 log points at the 75thand 90th percentile. However, the coefficient effect is a larger proportion of the wage gap for low-skilled immigrants than high-skilled immigrants from non-English-speaking coun-tries. The unexplained component is approximately half the total pay gap at the 10th and 25thpercentiles and approximately 40% of the total pay gap at the 90thpercentile.
Conclusion
Decomposition estimations from different time periods indicate the pro-UK-born unex-plained component of the wage gap is an increasing source of the pay gap. Our empir-ical analysis for immigrants from English-speaking and non-English-speaking countries indicates the growing unexplained component of wage assimilation is largely experi-enced by non-English-speaking immigrants. With increased inflows of migrants from non-English-speaking countries following the 2004 EU enlargement, our findings suggest one consequence of this migration pattern was to increase wage bias in favour of natives and reduce immigrants’positive wage gap.
A second contribution of this paper is to characterise wage assimilation across the conditional wage (skill) distribution. We identify one previous study examining decom-positions across the conditional distribution in Britain, although the analysis was prior to the recent EU enlargement. Our analysis determined mean results masked important differences across the distribution over the period investigated. In 1997, immigrants below the median earned less than natives to the extent that immigrants faced a sticky floor. Immigrants at the 50thpercentile and above earned more than natives. In 2009, the differential shifted towards the middle of the distribution and the lack of wage assimilation for low- to medium-skilled immigrants was increasingly attributed to the unexplained component of the wage gap. Results are consistent with an ‘eroding immi-grant middle-class’and highlight concerns of a potentially disaffected middle-class of wage earning immigrants increasingly finding they cannot explain or improve their weaker economic outcomes. Furthermore, QR decomposition results suggest the shift towards a pro-UK-born pay differential was due in part to increases in lower-skilled, non-English-speaking immigrants since they are the group earning less than their native counterparts.
This raises some further interesting questions as to how such wage differentials can persist. Theoretically, it is argued these differentials may exist because of incomplete information, friction or search costs and market power of individuals and firms. There is some research on information and search costs, which indicate that immigrants use formal routes as much as informal methods to gain employment (Frijters et al. 2005). This study finds that wage discrimination increased when workers from countries where the main language differed from the host country comprised a larger proportion of the immigrant group. Since they were also increasingly more similar to the native population in terms of ethnicity, it would appear language, culture and/or sponsorship played an increasing role in discrimination. Whether the language barrier did in fact reduce productivity and thus pay or it was used by employers to justify reduced pay is an important area for further research. It may also be that language and culture barriers reduce the ability to negotiate wages in which case we might expect collective bargain-ing to play an important role in wages. An interestbargain-ing avenue of research may be to investigate how public versus private sector employment influences wages of natives and immigrants.
Endnotes
2. East Anglia only
3. We initially performed analysis with five-year cohorts and observe differences for these three 30-year cohorts selected only.
Additional file
Additional file 1:Appendix Table S9.Sensitivity of immigration definition.
Competing interests
The IZA Journal of Migration is committed to the IZA Guiding Principles of Research Integrity. The author declares that she has observed these principles.
Acknowledgements
The author would like to acknowledge funding from the European Commission FP6 Marie Curie Early Career Training and support from the University of Warwick. I am grateful to Ian Walker, Jennifer Smith, Robin Naylor, Christian Dustmann and the anonymous reviewers for their time and comments made on previous drafts of this paper. Material from the British Labour Force Survey is used with permission of the Office of National Statistics and made available through the UK Data Archive at the University of Essex.
The author is responsible for all contents of this paper. Responsible editor: Amelie Constant.
Received: 23 April 2012 Accepted: 5 December 2012 Published: 24 December 2012
References
Arulampalam W, Booth A, Bryan M (2007)Is there a glass ceiling over Europe? Exploring the gender pay gap across the wage distribution.Ind Labor Relat Rev60:163–186
Bell B (1997)The performance of immigrants in the United Kingdom: Evidence from the GHS.The Economic Journal 107:333–344
Blackaby DH (2002)White/ethnic minority earnings and employment differentials in Britain: evidence from the LFS.
Oxford Economic Papers54:270–297. doi:10.1093/oep/54.2.270
Blinder A (1973)Wage discrimination: reduced form and structural estimates.J Hum Resour8:436–455
Borjas G (1995)Assimilation and changes in cohort quality revisited: what happened to immigrant earnings in the 1980s?Journal of Labor Economics13:201–245
Chernozhukov V, Fernández-Val I, Melly B (2012)Inference on counterfactual distributions. CeMMAP working papers
CWP05/12.http://www.cemmap.ac.uk/wps/cwp051212.pdf Accessed 29 August 2012
Clark K, Drinkwater S (2009)The labour-market performance of recent migrants.Oxford Review of Economic Policy 24:495–516. doi:10.1093/oxrep/grn023
Clark K, Lindley J (2006) Immigrant labour market assimilation and arrival effects: Evidence from the UK Labour Force Survey., IZA Discussion Paper No. 2228. http://ftp.iza.org/dp2228.pdf Accessed 24 April 2012
Constant A, Kahanec M, Zimmermann K (2012) The Russian-Ukrainian earnings divide. Economics of Transition20:1–35. doi:10.1111/j.1468-0351.2011.00428.x
Constant A, Massey D (2003)Self-selection, earnings, and out-migration: a longitudinal study of immigrants to Germany.Journal of Population Economics16:631–653
Denny K, Harmon C, Roche M (1997)The Distribution of discrimination in immigrant earnings-evidence from Britain
1974-93.Institute of Fiscal Studies, London
Dustmann C, Fabbri F (2005)Immigrants in the British labour market. Centre for Research and Analysis of.Migration, London
Dustmann C, Glitz A, Vogel T (2010)Employment, wages, and the economic cycle: differences between immigrants and natives.European Economic Review54:1–17. doi:10.1016/j.euroecorev.2009.04.004
Dustmann C, Wadsworth J, Preston I, Fabbri F (2003)Labour market performance of immigrants in the UK labour market. UK Home Office, London
Elliott R, Lindley J (2008)Immigrant wage differentials, ethnicity and occupational segregation.J R Stat Soc A Stat Soc171:645–671. doi:10.1111/j.1467-985X.2007.00535.x
Fortin N, Lemieux T, Firpo S (2011)Decomposition methods in economics.In: Card D, Ashenfelter O (eds)Handbook
of Labor Economics (Volume 4a).Elsevier B.V, pp 1–102
Frijters P, Shields M, Price SW (2005)Job search methods and their success: a comparison of immigrants and natives in the UK.The Economic Journal115:F359–F376. doi:10.1111/j.1468-0297.2005.01040.x
Jenkins S (1994)Earnings discrimination measurement: a distributional approach.Journal of Econometrics61:81–102 Machado JAF, Mata J (2005)Counterfactual decomposition of changes in wage distributions using quantile
regression.J Appl Econ20:445–465. doi:10.1002/jae.788
Manning A, Roy S (2010) Culture clash or culture club? National identity in Britain. The Economic Journal 120:F72–F100. doi:10.1111/j.1468-0297.2009.02335.x
Mincer J (1974)The human capital earnings function. Schooling, Experience, and Earnings.National Bureau of Economic Research, New York, pp 83–96
Oaxaca R (1973)Male–female wage differentials in urban labor markets.International Economic Review14:693–709 Shields M, Price SW (2002)The English language fluency and occupational success of ethnic minority immigrant
Trevena P (2009)“New”Polish migration to the UK: A synthesis of existing evidence. ESRC Centre for Population Change
Working Papers Series 3/2009.p 35,
http://eprints.soton.ac.uk/72026/1/2009_-_New_Polish_Migration_to_the_UK_-_P_Trevena.pdf Accessed 24 April 2012
United Nations (2009)Trends in international migrant stock: The 2008 revision.United Nations database POP/DB/MIG/ Stock/Rev.2008. http://esa.un.org/migration/index.asp?panel=4 Accessed 24 April 2012
doi:10.1186/2193-9039-1-9
Cite this article as:Hunt:From the bottom to the top: a more complete picture of the immigrant-native wage gap in Britain.IZA Journal of Migration20121:9.
Submit your manuscript to a
journal and benefi t from:
7Convenient online submission
7Rigorous peer review
7Immediate publication on acceptance
7Open access: articles freely available online
7High visibility within the fi eld
7Retaining the copyright to your article