R E S E A R C H
Open Access
Fluid loading and norepinephrine infusion
mask the left ventricular preload decrease
induced by pleural effusion
Kristian Borup Wemmelund
1,2*, Viktor Kromann Ringgård
1,2, Simon Tilma Vistisen
2,3, Janus Adler Hyldebrandt
4,
Erik Sloth
1,2,5and Peter Juhl-Olsen
1* Correspondence:
[email protected] 1Department of Anaesthesiology and Intensive Care, Aarhus University Hospital, Palle Juul-Jensens Boulevard 99, 8200 Aarhus N, Denmark
2
Department of Clinical Medicine, Aarhus University, Palle Juul-Jensens Boulevard 82, 8200 Aarhus N, Denmark
Full list of author information is available at the end of the article
Abstract
Background:Pleural effusion (PLE) may lead to low blood pressure and reduced cardiac output. Low blood pressure and reduced cardiac output are often treated with fluid loading and vasopressors. This study aimed to determine the impact of fluid loading and norepinephrine infusion on physiologic determinants of cardiac function obtained by ultrasonography during PLE.
Methods:In this randomised, blinded, controlled laboratory study, 30 piglets (21.9 ± 1. 3 kg) had bilateral PLE (75 mL/kg) induced. Subsequently, the piglets were randomised to intervention as follows: fluid loading (80 mL/kg/h for 1.5 h,n= 12), norepinephrine infusion (0.01, 0.03, 0.05, 0.1, 0.2 and 0.3μg/kg/min (15 min each,n= 12)) or control (n = 6). Main outcome was left ventricular preload measured as left ventricular end-diastolic area. Secondary endpoints included contractility and afterload as well as global measures of circulation. All endpoints were assessed with echocardiography and invasive pressure-flow measurements.
Results:PLE decreased left ventricular end-diastolic area, mean arterial pressure and cardiac output (pvalues < 0.001), but fluid loading (20 mL/kg) and norepinephrine infusion (0.05 μg/kg/min) restored these values (pvalues > 0.05) to baseline. Left ventricular contractility increased with norepinephrine infusion (p = 0.002), but was not affected by fluid loading (p = 0.903). Afterload increased in both active groups (pvalues > 0.001). Overall, inferior vena cava distensibility remained unchanged during intervention (pvalues≥0.085). Evacuation of PLE caused numerical increases in left ventricular end-diastolic area, but only significantly so in controls (p= 0.006).
Conclusions:PLE significantly reduced left ventricular preload. Both fluid and norepinephrine treatment reverted this effect and normalised global haemodynamic parameters. Inferior vena cava distensibility remained unchanged.
The haemodynamic significance of PLE may be underestimated during fluid or norepinephrine administration, potentially masking the presence of PLE.
Keywords:Pleural effusion, Animal models, Ventricular function, Fluid therapy, Norepinephrine, Thoracentesis
Background
A growing number of clinical and experimental studies unambiguously show that pleural effusion (PLE) not only causes respiratory derangement but also may
signifi-cantly compromise circulation [1–5]. PLE impairs circulation by decreasing left
ven-tricular (LV) preload resulting in hypotension, low cardiac output (CO) and, in the
worst cases, shock [6–8].
Patients presenting with low blood pressure or shock are commonly resuscitated with fluid loading, vasopressors and inotropes either as single therapy or in combination [9, 10]. The selected treatment is initiated to increase peripheral resistance or blood flow and, hence, blood pressure. However, blind manipulation of these determinants of blood pressure carries a risk of unphysiological restoration of blood pressure and CO, potentially harming the patient without treating the underlying cause.
We have recently shown that, in addition to the desired inotropic effect, dobutamine aggravated the preload depletion already caused by PLE [11]. PLE is a frequent finding
in critically ill patients [12–14], who often present with clinical symptoms similar to,
e.g. distributive shock. As fluid loading and norepinephrine are first-line treatments for low blood pressure and shock, the risk of symptomatic and potentially fatal mistreat-ment is evident. Detailed knowledge of the haemodynamic effects of fluid loading and norepinephrine administration in the presence of PLE is thus crucial for an optimal treatment strategy.
The aim of this study was to examine the effects of fluid loading and norepinephrine administration on invasive measures of global circulation and echocardiographic indi-ces of basic physiologic determinants in a porcine model with PLE. We hypothesised that a PLE-induced reduction in LV preload as measured by LV end-diastolic area (LVEDA) would be restored by fluids and norepinephrine and hence normalise blood pressure and CO.
Methods
Animal preparation
Thirty-three female Danish Landrace and Yorkshire piglets (21.9 ± 1.3 kg) were anaes-thetised with midazolam 0.5 mg/kg and S-ketamine 0.25 mg/kg. Pentobarbital 10 mg/ kg was given before intubation. Anaesthesia was maintained with infusion of fentanyl
10 μg/kg/h and propofol 5 mg/kg/h. The piglets were subject to volume-controlled
ventilation (S/5 Datex-Ohmeda Avance, GE HealthCare, Horten, Norway) with a tidal
volume of 10–12 mL/kg, oxygen fraction of 0.50 and positive end-expiratory pressure
set off maintaining actual expiratory pressures of 2–3 cmH2O. End-tidal CO2 values
were kept between 4 and 6 kPa. Piglets received a continuous fluid infusion of Lactated
Ringer’s solution (2 mL/kg/h).
Study protocol
After stabilisation, a volume of 75 mL/kg temperate vegetable oil was installed equally into both pleural spaces. The piglets then stabilised for 30 min before PLE readings and were randomly assigned in a 2:2:1 allocation ratio into three groups using
www.rando-mization.com: a fluid loading group (n= 12) received continuous infusion of Lactated
Ringer’s solution (80 mL/kg/h) persisting in six 15-min intervals, a norepinephrine
group (n= 12) treated with incremental infusion rates in six intervals of 15 min each
(0.01, 0.03, 0.05, 0.1, 0.2 and 0.3μg/kg/min) and a control group (n= 6) with no further
intervention. PLE was evacuated in all groups, at which point fluid loading was discon-tinued whereas norepinephrine infusion condiscon-tinued at the maximal infusion rate. The final data point was obtained 30 min after evacuation.
The investigator performing the experiment and obtaining data including echocardi-ography was blinded to the intervention throughout the experiment and during offline analyses.
Physiological determinants, data acquisition and analyses
Echocardiography was performed using a Vivid S6 ultrasound system (GE Healthcare, Horten, Norway) equipped with a cardiac M4S probe. Image acquisition of the para-sternal long-axis view was performed as described previously [15]. The inferior vena cava was visualised in a long-axis view, and data covering at least one respiratory cycle was captured.
Preload
LV preload was estimated as LV end-diastolic area (LVEDA). LVEDA was measured by tra-cing the LV endocardium at end-diastole, defined as just before the ECG R-wave (Fig. 1a).
Afterload
Afterload requires both assessment of the LV pressure and LV dimensions measured simultaneously in systole [16]. LV afterload was calculated as:
LV afterload = (LV pressure × LV systolic diameter)/2 × LV myocardial thickness. LV cavity diameter was obtained from 2-D images (Fig. 1b) and LV myocardial thick-ness was calibered using anatomical M-mode (Fig. 1c). LV systolic pressure was gath-ered from the LV catheter. All measures were obtained 100 ms after the ECG S-wave.
Myocardial contractility
LV myocardial contractility was determined by calculating the LV fractional area change, derived from endocardiac tracings in the same cardiac cycle, as:
LV fractional area change = ((LV end-diastolic area − LV end-systolic area)/LV
end-diastolic area) × 100%.
Inferior vena cava dynamics
The diameters of the IVC were measured with tracings perpendicular to the vessel
walls approximately 2–3 cm upstream to the diaphragm (Fig. 1d). The maximal
guidance of a respiration curve automatically generated from respiratory changes in thoracic impedance. The distensibility of the IVC was calculated as:
IVC distensibility = ((inspiratory IVC diameter−expiratory IVC diameter)/expiratory
IVC diameter) × 100%.
Extraction of pulse pressure variation
Pulse pressure variation [17] was derived based on the ECG and arterial blood pressure waveforms as previously described [18]. Briefly, maximal and minimal pulse pressures were calculated for each respiratory cycle of a 1-min window resulting in a series of pulse pressure variation representatives for that minute. The representatives between the 40th and 60th percentile were averaged, removing the effect of arrhythmias.
General haemodynamic parameters
CO and central venous pressure (CVP) were measured from the pulmonary artery cath-eter using a Vigilance monitor (Edwards LifeScience, CA, USA). Mean arterial pressure
(MAP), heart rate and arterial partial pressure of oxygen (PaO2) were obtained via a
cen-tral arterial line. LV end-diastolic pressure measured immediately before atrial contraction at expiration and was acquired from the LV catheter. Invasive pressures and ECG were stored continuously using S5 Collect software (Datex-Ohmeda, Helsinki, Finland).
LVEDA was the primary endpoint. Secondary endpoints were ultrasonographic indi-ces of LV afterload, contractility and the inferior vena cava along with pulse pressure variations and invasive pressure and flow measures.
Fig. 1Ultrasonographic data acquisition. Ultrasonographic images of the left ventricle obtained from a parasternal short-axis view. Endocardial tracing allowed for measurement of left ventricular end-diastolic
area (LVEDA) (a), left ventricular systolic diameter (LVDia) (b) and left ventricular myocardial thickness (LVMT)
Statistics
A power calculation was based on the difference between two dependent means and standard deviations from a previous study [19]. A 25% increase in LVEDA after a fluid
bolus of 20 mL/kg was considered clinically relevant. A total sample size (β= 0.9 and
α = 0.05) was estimated to 12 subjects in each intervention group. For all continuous
variables, a mixed model of univariate repeated measurements was used to analyse the
within-group time dependence. Paired Student’s t test was used to analyse the
differ-ences in the same group between two data points. Variables were considered normal-ised when no statistical difference compared with baseline prior to PLE installation was found. The primary observer performed blinded offline analyses of all data. Subse-quently, the primary and a secondary observer performed a blinded reanalysis of 50% of all the echocardiographic measurements. Inter- and intra-observer variation was cal-culated according to the Bland-Altman principle [20]. Data is presented as mean with
the corresponding standard deviation, and a two-sidedp< 0.05 was considered
statisti-cally significant. The STATA software 13.1 (StataCorp LP, College Station, TX, USA) was used throughout.
Results
A total of 33 piglets (21.9 ± 1.3 kg) were included. Three piglets were excluded due to
substantial data loss (n= 1), pneumothorax (n = 1) and circulatory collapse after PLE
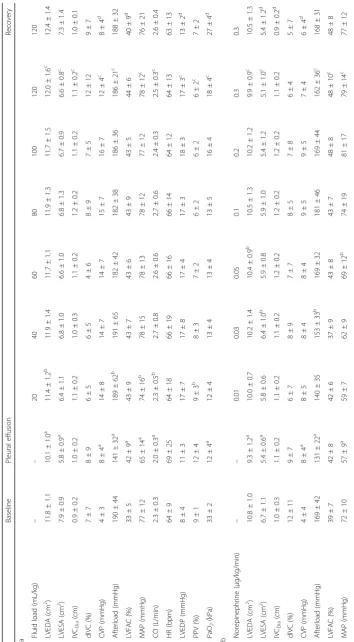
installation (n = 1), leaving 30 pigs for investigation. Haemodynamic data before and
after PLE installation are given in Table 1. Data from the fluid loading group,
norepin-ephrine group and control group are presented in Table 2 (2a–2c), respectively.
Model of pleural effusion
Preload, measured as LVEDA, decreased after PLE installation (p < 0.001), while LV
end-diastolic pressure increased (p= 0.001). CVP increased simultaneously (p< 0.001).
LV afterload, MAP, PaO2and CO decreased significantly (pvalues ≤0.001). IVC
diam-eter, IVC distensibility and pulse pressure variation were not significantly affected by
PLE installation (pvalues≥0.352; Table 1).
Effects of fluid loading and norepinephrine infusion after installation of pleural effusion Preload
LVEDA increased during both fluid infusion and increments in norepinephrine infusion
rates (p values < 0.001; Table 2 (2a, 2b)). Meanwhile, fluid loading increased LV
end-diastolic pressure and decreased pulse pressure variation (p values < 0.001). At a fluid
load of 20 mL/kg and a norepinephrine infusion rate of 0.05 μg/kg/min, LVEDA was
restored (pvalues≥0.061). Numerical baseline values were not reached in the
norepin-ephrine group, and LVEDA decreased at subsequent higher infusion rates.
Evacuation of PLE increased the numerical values of LVEDA in all groups, although only statistically significantly so in the control group. In contrast, only LV end-diastolic
pressure decreased after evacuation in the intervention groups (pvalues < 0.001).
Afterload
LV afterload increased over time in both intervention groups (pvalues < 0.001; Table 2
at norepinephrine infusion rates≥0.03μg/kg/min (pvalues≥0.306). Evacuation of PLE
did not affect LV afterload significantly in any group (pvalues≥0.195).
Contractility
LV fractional area change was unaffected in the fluid loading group (p= 0.903; Table 2
(2a)). After an initial decreasing trend, LV fractional area change increased at
norepin-ephrine infusion rates > 0.03 μg/kg/min (p values > 0.002; Table 2 (2b)). LV fractional
area change decreased in the fluid loading group only (p = 0.022) when PLE was
evacuated.
Inferior vena cava and pulse pressure variations
IVC diameter increased in both the fluid loading and the control group (p values ≤
0.048), but remained unchanged in the norepinephrine group (p= 0.931; Table 2 (2a–
2c)). Fluctuations of mean values were within 2 mm.
IVC distensibility was unaffected in all groups except for an increase after PLE
evacu-ation in the control group (p= 0.002).
PPV decreased in a dose-dependent manner in the fluid loading group only
(p < 0.001). Likewise, CVP increased only during fluid loading (p < 0.001), but
de-creased after PLE evacuation in both intervention groups (pvalues < 0.001). CVP was
unaffected in the control group (p= 0.115).
Systemic blood pressure
Fluid loading and incremental norepinephrine infusion rates increased MAP (pvalues
< 0.001; Table 2 (2a, 2b)). MAP was restored after a fluid load of 20 mL/kg and at a
norepinephrine infusion rate of 0.05 μg/kg/min (p values ≥0.416). No significant
change in MAP was observed in any of the groups after evacuation (pvalues≥0.205).
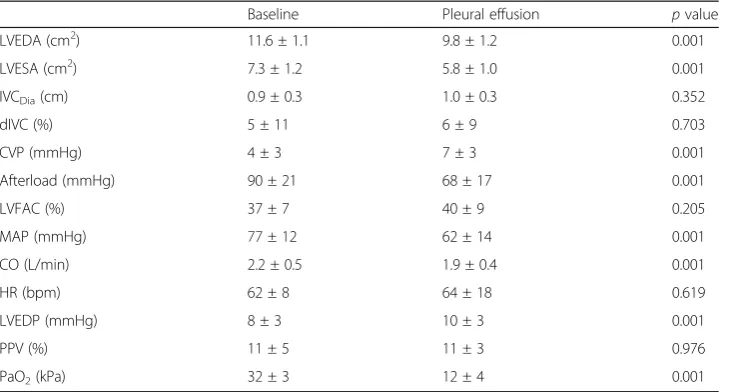
Table 1Pleural effusion and haemodynamic variables
Baseline Pleural effusion pvalue
LVEDA (cm2) 11.6 ± 1.1 9.8 ± 1.2 0.001
LVESA (cm2) 7.3 ± 1.2 5.8 ± 1.0 0.001
IVCDia(cm) 0.9 ± 0.3 1.0 ± 0.3 0.352
dIVC (%) 5 ± 11 6 ± 9 0.703
CVP (mmHg) 4 ± 3 7 ± 3 0.001
Afterload (mmHg) 90 ± 21 68 ± 17 0.001
LVFAC (%) 37 ± 7 40 ± 9 0.205
MAP (mmHg) 77 ± 12 62 ± 14 0.001
CO (L/min) 2.2 ± 0.5 1.9 ± 0.4 0.001
HR (bpm) 62 ± 8 64 ± 18 0.619
LVEDP (mmHg) 8 ± 3 10 ± 3 0.001
PPV (%) 11 ± 5 11 ± 3 0.976
PaO2(kPa) 32 ± 3 12 ± 4 0.001
Table1depicts the haemodynamic variables as mean ± standard deviation at baseline and after 75 mL/kg bilateral pleural effusion installation
Abbreviations:LVEDAleft ventricular end-diastolic area,LVESAleft ventricular end-systolic area,IVCDiaexpiratory inferior
vena cava diameter,dIVCinferior vena cava distensibility,CVPcentral venous pressure,Afterloadleft ventricular afterload,
LVFACleft ventricular fractional area change,MAPmean arterial pressure,COcardiac output,HRheart rate,LVEDPleft
Variability
Mean intra-observer variability for all echocardiographic endpoints was −0.4% (95%
limits of agreement −14.5–13.6%) (95% confidence interval −0.9–0.0%) and mean
inter-observer variability was 1.1% (95% limits of agreement −14.8–17.0%) (95%
confi-dence interval 0.6–1.5%).
Discussion
Installation of pleural effusion decreased preload and markers of global circulation. These changes were effectively restored with both fluid loading and infusion of norepinephrine.
Fluid loading
Moderate amounts of fluid loading (20 mL/kg) restored LVEDA (Fig. 2) and normalised MAP, CO and pulse pressure variation. As systemic blood pressure was quickly re-stored, this treatment clearly involves a risk of misdiagnosis. Hence, PLE mimics hypo-volaemic or distributive shock both in its clinical appearance and the effects of fluid loading. This may hamper diagnosis of PLE or falsely reduce the perceived clinical sig-nificance of a known PLE. However, the immediate rise in CVP to supranormal values (Table 2 (2a)) following fluid loading testified to the volume overload induced by fluid loading, potentially subjecting recipients to the harmful effects of compromised organ microcirculation [21, 22].
Norepinephrine infusion
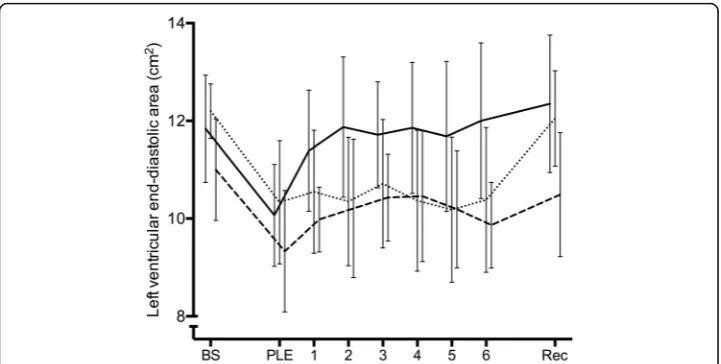
Relatively low infusion rates of norepinephrine restored LVEDA, CO, MAP and LV afterload (Fig. 2), hence nullifying the haemodynamic effects of PLE. In parallel to fluid
Fig. 2Left ventricular preload. Graph showing left ventricular end-diastolic area at baseline (BS), after pleural effusion installation (PLE), during the intervals of incremental intervention (1, 2, 3, 4, 5 and 6) corresponding to: fluid loading
(20, 40, 60, 80, 100 and 120 mL/kg) (full line), norepinephrine infusion (0.01, 0.03, 0.05, 0.1, 0.2 and 0.3μg/kg/min)
loading, haemodynamic restoration was easily accomplished with a first-line treatment for hypotension, although still not treating the underlying cause.
First, α1-stimulation contracts peripheral, systemic vasculature, and the resulting
crease in LV afterload may to some extend impede LV ejection and subsequently
in-crease LVEDA [23]. Second, stimulation of myocardial β1-receptors enhances
contractility and maintains heart rate [24]. Third, the biphasic effect of norepinephrine may be explained by its receptor affinity. First, the splanchnic and hepatic vessel beds
act as a reservoir of blood (unstressed volume), and stimulation ofα1,α2andβ2
-recep-tors in these vessel beds, and in turn increases the stressed blood volume, venous re-turn and consequently LVEDA [25, 26].
Norepinephrine increased LVEDA from 9.3 ± 1.2 to 10.5 ± 1.3 cm2from installation
of pleural effusion to a norepinephrine dose of 0.1 μg/kg/min despite an approximate
10% increase in HR. LV fractional area change was constant. As CO increased by 39% (1.8 ± 0.3 to 2.5 ± 1.0 L/min) whereas MAP increased by a comparable 30% (57 ± 9 to 74 ± 19 mmHg, see Fig. 2b), systemic vascular resistance must have changed minimally (MAP = CO × systemic vascular resistance). Therefore, the effect on LVEDA was pri-marily mediated by an increase in venous return. At high doses of norepinephrine (>
0.1μg/kg/min), LVEDA decreased; we attribute this to myocardial β1-receptor
stimula-tion as LV fracstimula-tional area change increased concomitantly.
Measures of inferior vena cava
The marked decrease in LV preload and doubling of CVP after installation of PLE were not mirrored in measures of IVC dimensions (Table 1). Extensive fluid loading and an accompanying substantial increase in CVP did not affect the respiratory variation of the IVC, whereas the expiratory diameter of the IVC increased. However, the increase of 2 mm was negligible and close to practical measurement error [27]. Hence, our find-ings do not support IVC measurements as reliable indices of CVP in the presence of PLE, although these are related [28, 29]. Likewise, the initial increase and subsequent levelling out in CO caused by fluid loading was not reflected in changes in IVC respira-tory variations, de-emphasising IVC dynamics as a measure of preload responsiveness when PLE is present [30, 31].
Installation of pleural effusion
This animal model confirmed the haemodynamic effects of PLE including an increase in
CVP and concomitant decreases in arterial blood pressure, PaO2and CO [4, 5, 7, 16]
(Table 1). LV fractional area change showed an increasing trend, but this was not a conse-quence of a higher inotropic state, but instead due to a reduced preload and a decrease in LV transmural pressure as LV end-diastolic pressure increased.
Together with the decreases in MAP and CO, the increases in LV end-diastolic pres-sure and CVP testify to the pathophysiological effect of pleural effusion. As described in a previous study [6], pleural effusion likely decreased biventricular transmural
pres-sures and, hence, effective filling prespres-sures and ventricular volumes. PaO2was reduced
markedly with pleural effusion, but did not reach sub-normal levels so we find it
PLE did not lead to changes in pulse pressure variation, though an increase was ex-pected. However, a study with a comparable PLE intervention also detected only slight
increases in pulse pressure variation [8]. While not addressing pulse pressure variations’
fluid responsiveness prediction abilities in this study and merely addressing physiology, we speculate that the significant PLE-induced changes in lung mechanics [8] may duce pressure transmission to the pleural space during ventilation and, as such, may re-duce the effective preload changes responsible for pulse pressure variation. Therefore, pulse pressure variation should probably be interpreted with caution when PLE is present. Apart from the effect of PLE, pulse pressure variation behaved as expected by declining in the fluid group and not changing in the two other groups.
Evacuation of pleural effusion
Evacuation of PLE altered most endpoints in the control group significantly or with a convincing trend (Table 2 (2b)). These effects were less obvious in the fluid loading group and in the norepinephrine group as numerical changes were virtually absent.
PaO2 increased markedly in all groups after evacuation regardless of intervention.
Altogether, these observations favour early detection and drainage of PLE [3], as fluid load or infusion of norepinephrine have considerable side effects.
Clinical implications
This study confirms the profound effects pleural effusion may elicit on key haemo-dynamic variables. The decrease in arterial pressure and CO together with a rise in CVP, seen with pleural effusion, is synonymous with cardiac failure or pulmonary embolism to many clinicians and, seen together, emphasises the potential benefits of ultrasonographic visualisation of the heart and lungs.
Nevertheless, both fluid loading and infusion of norepinephrine effectively reserved the haemodynamic changes of pleural effusion. This underscores the value of these treatments as first-line options, but also reveals a risk of misdiagnosis, as physicians may attribute PLE-induced hypotension to hypovolaemia or vasodilatation, when either fluid- or vasopressor therapy prove effective.
Limitations
This study was conducted in an experimental model of young and healthy pigs, pre-cluding direct extrapolation to patients with PLE, who often suffer from significant comorbidities. Additionally, PLE was induced rapidly, whereas patients often accumu-late PLE slowly. The haemodynamic implications of the latter have not been described. The protocol comprised persistent and large amounts of fluid and norepinephrine, which might not resemble clinical practise. This was chosen as to evaluate the effect, or the lack of it, during overtreatment.
Conclusions
PLE significantly reduced LV preload, MAP, PaO2and CO despite increasing absolute
cardiac filling pressures. Both fluid loading and low norepinephrine infusion rates reverted this preload decrease and normalised most other frequently measured haemo-dynamic parameters. Interestingly, extensive fluid loading and high-dose norepineph-rine infusion prevented the haemodynamically beneficial effects of pleuracentesis. In addition, this study elucidated the risk of attributing PLE-induced circulatory com-promise to hypovolaemia or vasodilatation resulting in further administration of vol-ume or inoconstriction without addressing the underlying cause.
Abbreviations
Afterload:Left ventricular afterload; CO: Cardiac output; CVP: Central venous pressure; HR: Heart rate; IVC: Inferior vena
cava; dIVC: Inferior vena cava distensibility; IVCDia: Expiratory inferior vena cava diameter; LV: Left ventricle; LVEDA: Left
ventricular end-diastolic area; LVEDP: Left ventricular end-diastolic pressure; LVESA: Left ventricular end-systolic area;
LVFAC: Left ventricular fractional area change; MAP: Mean arterial pressure; PaO2: Arterial partial pressure of oxygen;
PPV: Pulse pressure variation
Acknowledgements
This study was funded by the Knud Roland Larsen foundation and institutional funds.
Funding
The funding contributed solely to the expenses associated with materials and execution of the study.
Availability of data and materials
Data and materials can be requested from the corresponding author. Please refer to the corresponding author’s
contact information.
Authors’contributions
KBW, PJ-O and ES handled the design. KBW, VKR and JAH handled the execution. KBW, VKR, STV and PJ-O handled the data analyses. KBW, STV, JAH, PJ-O and ES prepared the manuscript. All authors read and approved the final manuscript.
Ethics approval and consent to participate
This randomised, blinded laboratory study was approved by the National Committee on Animal Research Ethics
(2014–15–0201-00421; Glostrup, Denmark) and agreed with the principles of Laboratory Animal Care [32].
Consent for publication Not applicable.
Competing interests
The authors declare that they have no competing interests.
Author details
1Department of Anaesthesiology and Intensive Care, Aarhus University Hospital, Palle Juul-Jensens Boulevard 99, 8200 Aarhus N, Denmark.2Department of Clinical Medicine, Aarhus University, Palle Juul-Jensens Boulevard 82, 8200 Aarhus N, Denmark.3Research Centre of Emergency Medicine, Aarhus University, Nørrebrogade 44, 8000 Aarhus C, Denmark. 4Division of Medicine, Akershus University Hospital, Lørenskog, Norway.5University of Cape Town, Cape Town, South Africa.
Received: 10 May 2017 Accepted: 4 September 2017
References
1. Krell WS, Rodarte JR (1985) Effects of acute pleural effusion on respiratory system mechanics in dogs. J Appl
Physiol 59:1458–1463
2. Talmor M, Hydo L, Gershenwald JG, Barie PS (1998) Beneficial effects of chest tube drainage of pleural effusion in
acute respiratory failure refractory to positive end-expiratory pressure ventilation. Surgery 123:137–143
3. Nishida O, Arellano R, Cheng DC, DeMajo W, Kavanagh BP (1999) Gas exchange and hemodynamics in
experimental pleural effusion. Crit Care Med 27:583–587
4. Nils Petter Oveland NB, Benedict W, Kasper B, Erik S (2013) Focus assessed transthoracic echocardiography (FATE)
to diagnose pleural effusions causing haemodynamic compromise. Case Reports in Clinical Medicine 2:133–137
5. Hermansen JF, Juhl-Olsen P, Frederiksen CA, Christiansen LK, Horlyck A, Sloth E (2014) Drainage of large pleural
effusions increases left ventricular preload. J Cardiothorac Vasc Anesth 28:885–889
6. Vaska K, Wann LS, Sagar K, Klopfenstein HS (1992) Pleural effusion as a cause of right ventricular diastolic collapse.
Circulation 86:609–617
7. Wemmelund KB, Lie RH, Juhl-Olsen P, Frederiksen CA, Hermansen JF, Sloth E (2012) Pleural effusion decreases left
ventricular pre-load and causes haemodynamic compromise: an experimental porcine study. Acta Anaesthesiol
8. Broch O, Gruenewald M, Renner J, Meybohm P, Schottler J, Hess K, Steinfath M, Bein B (2013) Dynamic and volumetric variables reliably predict fluid responsiveness in a porcine model with pleural effusion. PLoS One 8:e56267
9. Vincent JL, De Backer D (2013) Circulatory shock. N Engl J Med 369:1726–1734
10. Oldner A, Rossi P, Karason S, Aneman A, Scandinavian Critical Care Trials G (2003) A practice survey on
vasopressor and inotropic drug therapy in Scandinavian intensive care units. Acta Anaesthesiol Scand 47:693–701
11. Wemmelund KB, Sorensen AH, Ringgard VK, Sloth E, Juhl-Olsen P (2017) Dobutamine aggravates haemodynamic
deterioration induced by pleural effusion: a randomised controlled porcine study. European journal of
anaesthesiology 34(5):262–270
12. Mattison LE, Coppage L, Alderman DF, Herlong JO, Sahn SA (1997) Pleural effusions in the medical ICU:
prevalence, causes, and clinical implications. Chest 111:1018–1023
13. Light RW, Rogers JT, Moyers JP, Lee YC, Rodriguez RM, Alford WC Jr, Ball SK, Burrus GR, Coltharp WH, Glassford DM Jr,
Hoff SJ, Lea JW, Nesbitt JC, Petracek MR, Starkey TD, Stoney WS, Tedder M (2002) Prevalence and clinical course of
pleural effusions at 30 days after coronary artery and cardiac surgery. Am J Respir Crit Care Med 166:1567–1571
14. Botker MT, Vang ML, Grofte T, Sloth E, Frederiksen CA (2014) Routine pre-operative focused ultrasonography by
anesthesiologists in patients undergoing urgent surgical procedures. Acta Anaesthesiol Scand 58:807–814
15. Wemmelund K, Sørensen A, Juhl-Olsen P, Sloth E (2016) The effect of dobutamine infusion on basic physiological
determinants in the presence of pleural effusion. An experimental porcine study. Heart lung vessel in review
16. Norton JM (2001) Toward consistent definitions for preload and afterload. Adv Physiol Educ 25:53–61
17. Michard F, Boussat S, Chemla D, Anguel N, Mercat A, Lecarpentier Y, Richard C, Pinsky MR, Teboul JL (2000)
Relation between respiratory changes in arterial pulse pressure and fluid responsiveness in septic patients with
acute circulatory failure. Am J Respir Crit Care Med 162:134–138
18. Vistisen ST, Koefoed-Nielsen J, Larsson A (2010) Automated pre-ejection period variation predicts fluid
responsiveness in low tidal volume ventilated pigs. Acta Anaesthesiol Scand 54:199–205
19. Renner J, Gruenewald M, Brand P, Steinfath M, Scholz J, Lutter G, Bein B (2007) Global end-diastolic volume as a
variable of fluid responsiveness during acute changing loading conditions. J Cardiothorac Vasc Anesth 21:650–654
20. Bland JM, Altman DG (1986) Statistical methods for assessing agreement between two methods of clinical
measurement. Lancet 1:307–310
21. Marik PE (2014) Iatrogenic salt water drowning and the hazards of a high central venous pressure. Ann Intensive Care 4:21
22. Prowle JR, Echeverri JE, Ligabo EV, Ronco C, Bellomo R (2010) Fluid balance and acute kidney injury. Nat Rev
Nephrol 6:107–115
23. Monnet X, Jabot J, Maizel J, Richard C, Teboul JL (2011) Norepinephrine increases cardiac preload and reduces
preload dependency assessed by passive leg raising in septic shock patients. Crit Care Med 39:689–694
24. Van Stee EW (1978) Autonomic innervation of the heart. Environ Health Perspect 26:151–158
25. Kjekshus H, Risoe C, Scholz T, Smiseth OA (1997) Regulation of hepatic vascular volume: contributions from active
and passive mechanisms during catecholamine and sodium nitroprusside infusion. Circulation 96:4415–4423
26. Di Giantomasso D, May CN, Bellomo R (2002) Norepinephrine and vital organ blood flow. Intensive Care
Med 28:1804–1809
27. Saul T, Lewiss RE, Langsfeld A, Radeos MS, Del Rios M (2012) Inter-rater reliability of sonographic measurements of
the inferior vena cava. The Journal of emergency medicine 42:600–605
28. Bendjelid K, Romand JA (2003) Fluid responsiveness in mechanically ventilated patients: a review of indices used
in intensive care. Intensive Care Med 29:352–360
29. Pinsky MR (1997) The hemodynamic consequences of mechanical ventilation: an evolving story. Intensive Care
Med 23:493–503
30. Feissel M, Michard F, Faller JP, Teboul JL (2004) The respiratory variation in inferior vena cava diameter as a guide
to fluid therapy. Intensive Care Med 30:1834–1837
31. Barbier C, Loubieres Y, Schmit C, Hayon J, Ricome JL, Jardin F, Vieillard-Baron A (2004) Respiratory changes in
inferior vena cava diameter are helpful in predicting fluid responsiveness in ventilated septic patients. Intensive
Care Med 30:1740–1746
32. Clark JD, Gebhart GF, Gonder JC, Keeling ME, Kohn DF (1997) Special report: the 1996 guide for the care and use