Prediction of Water Quality Variation
Affected by Tributary Inputs in Large Rivers
Using ANN Model
Il Won Seo
1and Se Hun Yun
21Seoul National University, 1 Gwanak-ro, Gwanak-gu, 08826, Seoul, Republic of Korea 2Seoul National University, 1 Gwanak-ro, Gwanak-gu, 08826, Seoul, Republic of Korea
Abstract.
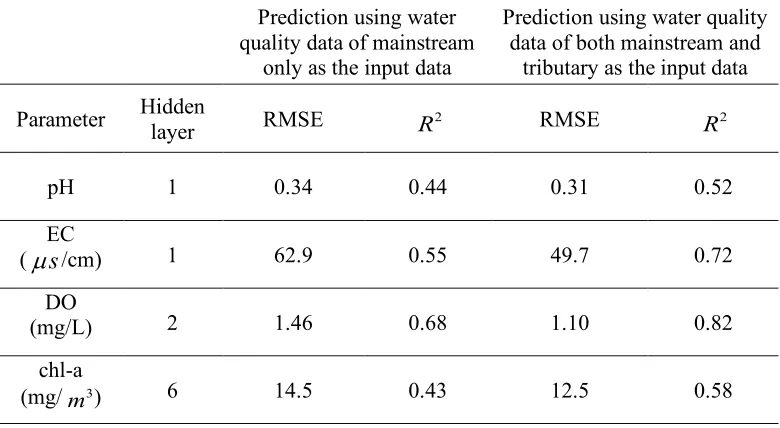
In this study, an enhanced ANN model was developed to analyze the water quality variation at the river confluence by incorporating the resilient propagation algorithm to increase the model accuracy. An ensemble modeling with stratified sampling method was also developed in order to reduce the influence of the input data and model parameters on the prediction of river water quality. The water quality parameters such as pH, electric conductivity (EC), DO and chlorophyll-a, were predicted using proposed ANN model in the large river which is affected by pollutant inputs from the tributary river. The results of model simulation showed that the pollutant input from the tributary affected the water quality of the mainstream. The model prediction using water quality data of the tributary river as the input data in addition to the mainstream data produced better results than the simulation using mainstream data only, especially for EC and DO, value was improved by 30.9% and 20.6%, respectively.
Keywords: Ensemble ANN model, Resilient propagation algorithm, River water quality prediction, Stratified sampling, Tributary pollutant inputs
1
Introduction
Stream confluences are essential elements of river networks that play a major role in the dynamics of fluvial systems including flow structures complicated by secondary currents, mixing of sediments and pollutants. At the confluence of rivers, the pollutants input from the tributary have a great influence on the water quality of the river after confluence. Mixing of
2
R
Volume 3, 2018, Pages 1919–1926
HIC 2018. 13th International Conference on Hydroinformatics
tributary flows may extend many kilometers downstream of confluences (MacKay, 1970; Bouchez et al., 2010). Up-to-date water quality prediction at river confluence rely primarily on the physically-based numerical modelling. However, most numerical models have not been fully validated against field experimental data which require huge time and money to obtain. To substitute the numerical model, the data-based models have been used because it is possible to perform water quality predictions with only accumulated data. Among many data-driven techniques, the artificial neural network (ANN) has been widely used because it is very efficient for the prediction and forecasting of water quantity and quality variables in river systems (Maier and Dandy, 1996).
Even though existing ANN modelling is efficient in water quality prediction, the model accuracy is hampered by unbalanced input data set and inappropriate model parameters such as the initial weight parameter. The model error would be increased when the influence of minority data is not sufficiently reflected in the training stage of ANN modelling (Nguyen et al., 2008). To alleviate the problem of the imbalanced input data set, many researchers have attempted to employ sampling methods in which the input data was classified into certain number of classes and then the data of each class was sampled according to the distribution ratio to avoid the biased sampling in training, validation, and test stages. Regarding errors due to model parameters, the initial weight parameter is major source because there is no fixed optimal value that is universally applicable to the varieties of data structures and training algorithms. In order to overcome this limitation, ensemble techniques have been applied in which a number of simulations were conducted with different values of initial weight parameters and then the average of output results was used as a solution (Khalil et al., 2011, Kim and Seo, 2015).
The aim of this study was to predict the river water quality affected by the tributary inputs in large rivers using the improved ANN model. In this study, the ANN model was enhanced by incorporating the resilient propagation algorithm for the improvement of the model accuracy. The ensemble technique was applied along with stratified sampling method to avoid the biased sampling of input data and the effect of the initial weight parameter on the model prediction. Various simulations with different input data were conducted to investigate the influence of the pollutant input from the tributary on the water quality of the mainstream.
2
Model Development
2.1 ANN Model with Resilient Propagation Algorithm
The concept of ANN was inspired by the biological neural network system of the human brain. The basic structure of an ANN model is usually comprised of three distinctive layers, input layer, hidden layer(s), and output layer. This configuration is also referred to as a multilayer feedforward (MLFF) network and it represents one of the most commonly used neural networks model. Each layer consists of one or more basic element(s) called a neuron. Neurons are fundamental to the operation of a neural network. It is a highly interconnected processor and can exchange messages between each other. Each neuron consists of a weight parameter and an activation function. When the input data is passed to the input layer, it is bound with the weight parameters and is granted a non-linearity by the activation function. Then, these data are fed forward through successive layers including the hidden layer(s), where data are processed. The hidden layer is the essential component of the ANN model that
allows the neural network to learn the relationships between input and output data. Finally, at the output layer, the results of ANN are produced. This process of being transmitted to the next neuron is repeated until it derive a final result.
The most popularly used training method for multilayer feedforward networks is the backpropagation algorithm. The basic idea of the backpropagation learning algorithm is the repeated application of the chain rule to compute the influence of each weight in the network with respect to an arbitrary error-function E as below:
(1)
where is the weight from neuron to neuron , is the output, and is the weighted sum of the inputs of neuron. Once the partial derivative for each weight is known, the aim of minimizing the error-function is achieved by performing a simple gradient descent as
(2)
where h is number of iteration, and is the learning rate. Obviously, the crucial factor in the weight change is the learning rate . If it is set too small, too many steps are needed to reach an optimum solution. On the contrary, it is set too large, oscillation occurs and preventing the error to fall below a certain value. For this reason, the resilient propagation method changes the size of the weight-update directly, without considering the size of the partial derivative. Another reason for adopt resilient propagation method is to compensate for the disadvantage of the sigmoid transfer function. Multi-layer networks typically use sigmoid transfer functions in the hidden layers. These functions compress an infinite input range into a finite output range. Sigmoid functions are characterized by the fact that their slope must approach zero as the input gets large. This causes a problem when using the steepest descent to train a multi-layer network with sigmoid functions, since the gradient can have a very small magnitude even though the weights and biases are far from their optimal values. In resilient propagation method, it clips the logistic activation function a value. That could be reasonably distinguished from the asymptotic boundary value. This results in an always non-zero derivative, preventing the unit of being stuck. Especially in difficult problems, this worked far more stable than adding a small constant value to the derivation of the activation function.
In resilient propagation algorithm, only the sign of the derivative is used to determine the direction of the weight update; the magnitude of the derivative has no effect on the weight update. The size of the weight change is determined by a separate update value. The update value for each weight and bias is increased by a factor whenever the derivative of the performance function with respect to that weight has the same sign for two successive iterations. The update value is decreased by a factor whenever the derivative with respect to weight changes sign from the previous iteration. If the derivative is zero, then the update value remains the same. By doing so, whenever the weights are oscillating, the weight change will be reduced. If the weight continues to change in the same direction for several iterations, then the magnitude of the weight change will be increased.
i i
ij i i ij
s
net
E
E
w
s net
w


=


¶ 

ij
w
j
i
s
inet
i(
1)
( )
( )
ij
E
w h
w h
h
w
h

+ =
-
h
h
2.2 Ensemble Technique and Stratified Sampling
Development of ANN model consists of two parts, one is pre-processing part, and the other is modelling part. Data collecting, data analysing, and selecting input and output data are pre-processing part while selecting number of parameter like hidden layers, hidden neurons, and application of ensemble method are modelling part. As described above, ANN model is data-driven model, so most important thing is the quality of data. Thus, in this study, the stratified sampling method was used for pre-processing method to reduce the sampling error and maintain the characteristics of the data distribution. The stratified sampling is the process of dividing input data into homogeneous subgroups before sampling. Each data of this study were sampled according to the distribution ratio of each parameters have.
The ANN model usually calculate and modify the appropriate weight parameters through an optimization algorithm in the modelling part. However, despite the optimization process, the influence of initial weight parameters has a great influence on the results of the model. Depending on the initial weight parameter, model gives different results for the same inputs data. For this reason, in this study, the ensemble technique has been applied. The basic ANN ensemble with simple averaging method is very simple and several researchers found that this simple method can produce the accurate results as the more complex methods such as bagging and boosting methods. Empirically, the ensemble technique has been applied with considerable success in hydrology and environmental science, as an approach to enhance the skill of forecasts (Krogh and Vedelsby, 1995; Araghinejad et al., 2011). In this study, to the estimate the accuracy of the result, the root-mean-square error (RMSE), and R squared (R ) were used.
3
Model Application
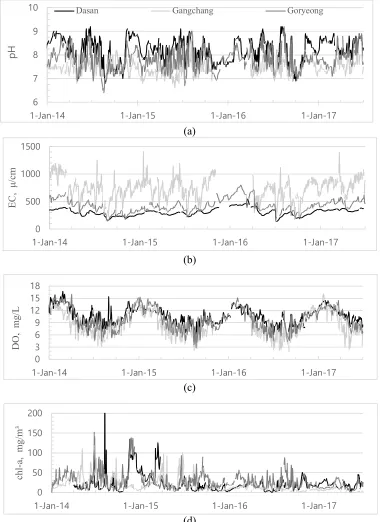
The Nakdong River covers the watershed of about 23,384.21 , and the river length is 506.17 flowing through South-eastern part of the Korean peninsula (Fig. 1). About 13 million people intake this river for drinking water. Table 1 shows the river discharge data and the average value of some water quality parameters of mainstream and tributaries. Figure 2 shows the distribution of water quality parameters in the Nakdong River and Kumho River in the study area. In this study area, as shown in Figure 1, four water quality parameters (pH, EC, DO, and chl-a) collected through the three automatic water quality monitoring stations from January 2012 to December 2016 were used. Two automatic water quality monitoring stations (Dasan for mainstream and Gangchang for tributary) were located upstream of the confluence and one automatic water quality monitoring stations (Goryeong) was located downstream of the confluence.
Among the observed data sets, the data of Goryeong station were used for target data, and the data of Dasan and Gangchang stations were used for input data. Input and target data were classified into training, validation and test data set in which 80% of the total data is training data, 10% is validation data, and 10% is test data. All the data were sampled by the stratified sampling method according to the distribution ratio of each parameters have. All the variables of input data were discretized into time t (day) and t-1. In order to observe the influence of the water quality of the tributary, prediction was performed for two different cases. The first case is the case of using the water quality data of the mainstream only as the input data, and the other case is the case of adding the water quality data of the tributaries as the input data.
2
2
km
km
For the model construction, the single hidden layer was used, and the optimum number of hidden neurons for each parameters was selected according to the validation result. The activation function for the hidden layer was the tangent sigmoid function, and the linear function was used for the output layer. The resilient propagation algorithm was used to train the network with 100 randomly generated initial weight parameter sets to reach the required training goal of 0.001 in 500 epochs. As aforementioned, the simple averaging ensemble modelling technique was applied to reduce the influence of initial weight parameters.
(a)
(b)
(c)
(d)
Figure 1. Study site and automatic water quality monitoring station: (a) study site; (b) Dasan station; (c) Gangchang station; (d) Goryeong station
(a)
(b)
(c)
(d)
Figure 2. Temporal variation of water quality parameters: (a) pH; (b) EC; (c) DO; (d) chl-a
6 7 8 9 10
1-Jan-14 1-Jan-15 1-Jan-16 1-Jan-17
pH
Dasan Gangchang Goryeong
0 500 1000 1500
1-Jan-14 1-Jan-15 1-Jan-16 1-Jan-17
EC
,
µ/c
m
0 3 6 9 12 15 18
1-Jan-14 1-Jan-15 1-Jan-16 1-Jan-17
DO,
m
g/
L
0 50 100 150 200
1-Jan-14 1-Jan-15 1-Jan-16 1-Jan-17
ch
l-a,
m
g/
m
³
4
Simulation Results
The discharge of the tributary is about 20% ~ 30% to the discharge of the mainstream. The amount of water discharge through the tributary is large enough to affect the water quality of the mainstream. At the upstream of the confluence, the averaged pH value of the tributary were lower than that of mainstream while the EC value is higher, the DO is lower and the chl-a is lower thchl-an the mchl-ainstrechl-am respectively.
At the downstream of the confluence, the averaged values of pH, EC, and DO were between the values of the tributary and the mainstream at the upstream of the confluence.
In this study, the water quality parameters at the downstream of the confluence were predicted using the proposed ANN model. The best-fitted prediction results was shown when tested with the optimal number of hidden neurons, which selected through the validation results. As shown in Table 2, the value was increased and the RMSE value was decreased when the water quality data of tributary was added as the input data for all parameters. Especially for EC and DO, value was improved by 30.9% and 20.6%, respectively. This result clearly demonstrated that the prediction of the water quality at the downstream of the river confluence needs to be conducted utilizing the tributary data as well as the mainstream data.
Table 1. Comparison of prediction results using ANN ensemble model
5
Conclusions
In this study, the water quality parameters at the downstream of the river confluence were predicted using the ANN ensemble model with resilient propagation algorithm. The accuracy of prediction results increased when the water quality parameters of the tributary was added as an input data. Using the resilient propagation algorithm, the accurate and robust results were presented, and the single averaged value of predicted results were suggested using the simple
2
R
2
R
Prediction using water quality data of mainstream
only as the input data
Prediction using water quality data of both mainstream and
tributary as the input data
Parameter Hidden layer RMSE RMSE
pH 1 0.34 0.44 0.31 0.52
EC
( /cm) 1 62.9 0.55 49.7 0.72
DO
(mg/L) 2 1.46 0.68 1.10 0.82
chl-a
(mg/ ) 6 14.5 0.43 12.5 0.58
2
R R2
s
µ
3 m
averaging ensemble technique. Therefore, by using the accumulated data from the automatic water quality monitoring station, the artificial neural network model proposed in this study at the complex river systems can replace the physical-based numerical model to predict the water quality.
Acknowledgement
This research was supported by the BK21 PLUS research program of the National Research Foundation of Korea. This research work was conducted at the Institute of Engineering Research and Institute of Construction and Environmental Engineering in Seoul National University, Seoul, Korea.
Reference
[1] Araghinejad, S., Azmi, M., and Kholghi, M. (2011). Application of artificial neural network ensembles in probabilistic hydrological forecasting. Journal of Hydrology, 407 (1-4), 94-104.
[2] Bouchez, J., Lajeunesse, E., Gaillardet, J., France-Lanord, C., Dutra-Maia, P., and Maurice, L. (2010). Turbulent mixing in the Amazon River: The isotopic memory of confluences. Earth and Planetary Science Letters, 290(1-2), 37-43.
[3] Khalil, B., Ouarda, T. B. M. J., and St-Hilaire, A. (2011). Estimation of water quality characteristics at ungauged sites using artificial neural networks and canonical correlation analysis. Journal of Hydrology, 405(3-4), 277-287.
[4] Kim, S. E., & Seo, I. W. (2015). Artificial neural network ensemble modeling with exploratory factor analysis for streamflow forecasting. Journal of Hydroinformatics, 17(4), 614-639.
[5] Krogh, A., and Vedelsby, J. (1995). Neural network ensembles, cross validation, and active learning. In Advances in neural information processing systems (pp. 231-238).
[6] Mackay, J. R. (1970). Lateral mixing of the Liard and Mackenzie rivers downstream from their confluence. Canadian Journal of Earth Sciences, 7(1), 111-124.
[7] Maier, H. R., and Dandy, G. C. (1996). The use of artificial neural networks for the prediction of water quality parameters. Water resources research, 32(4), 1013-1022.
[8] Nguyen, G. H., Bouzerdoum, A., and Phung, S. L. (2008). A supervised learning approach for imbalanced data sets. In Pattern Recognition, 2008. ICPR 2008. 19th International Conference on (pp. 1-4). IEEE.