Fariba Davanian1, Fariborz Faeghi1*, Sohrab Shahzadi2, Zahra Farshifar3
Diffusion Tensor Imaging for Glioma Grading: Analysis of
Fiber Density Index
Introduction: The most common primary tumors of brain are gliomas and tumor grading is essential for designing proper treatment strategies. The gold standard choice to determine grade of glial tumor is biopsy which is an invasive method. The purpose of this study was to investigate
the role of fiber density index (FDi) by means of diffusion tensor imaging (DTI) (as a
non-invasive method) in glial tumor grading.
Methods: A group of 20 patients with histologically confirmed diagnosis of gliomas were
evaluated in this study. We used a 1.5 Tesla MR system (AVANTO; Siemens, Germany) with a standard head coil for scanning. Multidirectional diffusion weighted imaging (measured in 12 noncollinear directions), and T1 weighted nonenhanced were performed for all patients. We
defined two regions of interest (ROIs); 1) White matter fibers near the tumor and 2) Similar fibers
in the contralateral hemisphere.
Results: FDi of the low-grade gliomas was higher than those of high-grade gliomas, which was
significant (P=0.017). FDi ratio (ratio of fiber density in vicinity of the tumor to homologous fiber tracts in the contralateral hemisphere) is higher in low-grade than high-grade tumors, (P=0.05).
In addition, we performed ROC (receiver operating characteristic) curve and the area under
curve (AUC) was 0.813(P=0.013).
Conclusion: Our findings prove significant difference in FDi near by low-grade and high-grade
gliomas. Therefore, FDi values and ratios are helpful in glial tumor grading.
A B S T R A C T
Key Words:
Diffusion tensor imaging, Neoplasm grading, Glioma, Fiber density index
1. Introduction
he most common primary tumors of the central nervous system are gliomas
(Chen, Shi, & Song, 2010; Kang et al., 2015). Glioma arises from the glial cells of the brain (Jin, Zhang, Yang, & Luo,
2015;Min, Niu, Rana, Ji, & Zhang, 2013). Despite im-provement in prognosis for patients with low-grade gli-omas, the prognosis is still poor for high-grade gliomas
(Kayama, Kumabe, Tominaga, & Yoshimoto, 1996; Ma & Song, 2013). In this regard, tumor grading is es-sential for designing proper treatment strategies (Brat & Van Meir, 2004;Lee et al., 2008). The gold standard
T
Article info:
Received: 19 April 2016 First Revision: 05 July 2016
Accepted: 30 August 2016
1. Department of Radiology Technology, School of Allied Medical Sciences, Shahid Beheshti University of Medical Sciences, Tehran, Iran. 2. Department of Neurosurgery, Shohada Tajrish Hospital, Shahid Beheshti University of Medical Sciences, Tehran, Iran.
3. Department of Radiology Technology, School of Paramedical, Shiraz University of Medical Sciences, Shiraz, Iran.
* Corresponding Author: Fariborz Faeghi, PhD
Address: Department of Radiology Technology, School of Allied Medical Sciences, Shahid Beheshti University of Medical Sciences, Tehran, Iran.
Tel: +98 (21) 22711131
E-mail: [email protected]
CrossMark
Citation:Davanian, F., Faeghi, F., Shahzadi, S., & Farshifar, Z. (2017). Diffusion Tensor Imaging for Glioma Grading:
Anal-ysis of Fiber Density Index. Basic and Clinical Neuroscience, 8(1), 13-18. http://dx.crossref.org/10.15412/J.BCN.03080102
:
: http://dx.crossref.org/10.15412/J.BCN.03080102 Use your device to scan
method for glial tumor grading is the biopsy which is an invasive method with its own problems and risks. Biopsy can lead to swelling or bleeding of the brain, infections, seizures, stroke, or coma. Sometimes tests on the sampled tissue are inconclusive and the proce-dure must be repeated. The resulting problems of bi-opsy depends on many variables like lesion properties (location, histology) and preoperative pharmacological therapy (corticosteroids, antiplatelet agents) (Sawin, Hitchon, Follett, & Torner, 1998). Intracranial hemor-rhage is the most common side effect of brain biopsy and is associated with inpatient mortality and hospital disposition (Malone et al., 2015).
Based on recent studies, use of routine magnetic reso-nance imaging (MRI) in detection and assessment of lesions has been improved. However, MRI may under-estimate tumor size and is not a reliable method in tu-mor grading, and that may cause mistake in treatment strategy (Johnson, Hunt, & Drayer, 1989;Watanabe, Tanaka, & Takeda, 1992).
Diffusion tensor imaging (DTI) is an MRI method that maps water molecules diffusion and is a totally noninvasive method. Because of different obstacles
(like fibers and membranes), water molecules cannot
freely diffuse. DTI by the aim of water molecule diffu-sion patterns, reveals the microscopic details about
tis-sue architecture, including its fibers. Furthermore, DTI
has become standard test for white matter disorders,
because of its ability in defining abnormalities in fi -ber architecture (Hagmann et al., 2006). DTI is mainly used for study and treatment of neurological disorders.
Fiber density index (FDi) was introduced by Roberts and colleagues in 2015. They described FDi as
densi-ty of fiber tract in glioblastoma tumors (Roberts, Liu, Kassner, Mori, & Guha, 2005). FDi is a quantitative
description of fiber tracks in each pixel of the region
of interest (ROI). In their study, 0.15 and 0.20 were reported as the best fractional anisotropy threshold to
reconstruct fiber around a glioma. In this study, we
choose a threshold of 0.20. While pathologic sampling, as a gold standard, is an invasive way, we perform pro-spective study to investigate the role of FDi by means of DTI (as a noninvasive method) in grading gliomas.
2. Methods
2.1. Study population
The imaging data of 20 patients (mean age±SD, 45.9±13.6 y), with histologically proven WHO
low-grade (13 patients) and high-low-grade (7 patients) gliomas, were collected. About 45% (9 patients) were female
(age range, 15−68 years; mean age, 48.3 years±15.9) and 55% (11 patients) were male (age range, 26−69
years; mean age, 43.9 years±11.89).
In this study, we considered MRI contraindications (claustrophobia, foreign body) and ethical issues (tak-ing informed consents). After MRI examinations, biop-sies were performed on all patients and according to the pathological result (as a gold standard), low-grade and
high-grade gliomas were classified.
2.2. Magnetic resonance imaging and image analysis
In this study, we used a 1.5 Tesla MR system (AVAN-TO; Siemens, Germany) with a standard head coil for scanning. A diffusion-weighted echo-planar imaging
sequence was performed (repetition time=8600 ms; echo time=107 ms; number of excitations=1). In 12
noncollinear directions, diffusion encoding gradient was performed. Diffusion weighting factors (b value) were
b=1000 s/mm2 and b=0 s/mm2 (no diffusion gradient).
2.2.1. Data processing
Spatial normalization and preprocessing on 20 DTI series and b0 image series were performed by using ExploreDTI (Leemans, Jeurissen, Sijbers, & Jones, 2009). Final processing was performed by the DTIStu-dio version 3.0.3 (Processing Tools and Environment for Diffusion Tensor Imaging–H. Jiang and Mori, Ra-diology Department, Johns Hopkins University, Balti-more, MD, USA) to measure FDi.
The fiber density index (FDi) is a quantitative mea
-sure of fiber tracks in each pixel. We should define the fractional anisotropy (FA) threshold and fiber angle threshold for reconstructing fibers (Mori, 2007). We described FA thresholds of 0.20 and angle of up to 70
degree to reconstruct fibers.
2.2.2. ROI determination
We defined 2 rectangular ROIs (10×10 pixels) for each
patient: 1) The white matter adjacent to the tumor (in
nearest identifiable fiber tracts to the gliomas); 2) The homologous fiber tracts to ROI 1 in the contralateral
hemisphere (Figure 1). In this study, we used fractional
anisotropy map for drawing ROIs to better define the an
2.2.3. Parameters measurement
Two parameters were measured for each patient: 1) FDi values were recorded for ROI 1 and 2; 2) FDi ra-tios: by dividing the measured FDi values in ROI 1 by those in ROI 2.
2.3. Statistical analysis
In this study, we used SPSS version 16.0 (Chicago, IL, USA) to analyze our data. We performed ROC (receiver operating characteristic) curve and used the AUC (area under curve) to evaluate the association be-tween FDi and gliomas grading. Also, after normality assessment we performed the t test and Mann-Whitney test to investigate the correlation between our param-eters and tumors grade.
3. Results
We used Mann-Whitney test to evaluate FDi values. Fiber density in the vicinity (FDit) of the low-grade gliomas (7.59±4.44) tended to be higher than those of the high-grade gliomas (2.87±2.09). We found this
dif-ference significant (P=0.017).
In addition, we used t test for FDi ratios (FDit/n) in high-and low-grade gliomas. As we expected, FDit/n is higher
in low-grade gliomas (0.39±0.21) compared to high-grade
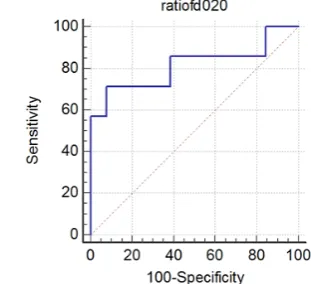
(0.20±0.18) ones (P=0.05). Results of ROC curve are pre -sented in Table 1 and Figure 2. Area under curve is 0.813 which is near 1, and that makes our test reliable.
4. Discussion
Our findings suggest that FDi values and ratios are
higher in low-grade gliomas compared to high-grade ones. MRI basically depends on water molecules, and in this advance imaging method, DTI, we studied water molecule diffusion. Because of different obstacles (like
fibers and membranes), water molecules cannot freely diffuse. In the presence and integrity of fibers (as an ob -stacle) water molecules diffusion pattern becomes more
anisotropic. When fiber density or fiber packing and or -ganizations get damaged and decrease, barriers for water molecules diffusion disappear and diffusion pattern be-come more isotropic (decrease of anisotropic diffusion of water molecules). In this way, DTI by the aim of wa-ter molecule diffusion patwa-terns reveals the microscopic
details about tissue architecture, including its fibers.
Based on that, our findings propose that the fiber tracts in the vicinity of low-grade gliomas are signifi -cantly preserved and well-organized, while peritumoral
Table 1. ROC curve test results on FDit/n in glial tumor grading.
P AUC 95% CI Specificity 95% CI Sensitivity Cutoff-value Parameter
0.013 0.813 64.0-99.8 92.31 29.0-96.3 71.43 0.2 FDit/n
Area Under Curve (AUC) was 0.8. The results were statistically significant (P<0.05).
Figure 1. Determining regions of interest (ROI) in a 43-year-old man with high grade glioma, adjacent to white matter, and
fiber tracts in high-grade gliomas are damaged, disor -ganized, and miss their integrity.
There are few published studies on FDi and gliomas so far. The most important study was done in 2005 by Roberts et al. who employed this parameter. They re-ported the reduction of this index in peritumoral white matter in comparison to the contralateral white matter
(Roberts et al., 2005). We found significant FDi reduc -tion, near high-grade gliomas compared to low-grade
ones, and that would indicate fewer fiber paths travers -ing from the peritumoral ROI. In a similar study, Chen and colleagues suggested that the FDi values in white matter adjacent to the low-grade gliomas are higher than high-grade gliomas. Furthermore, they found that
FDi ratios were significantly different between patients
with high-grade and those with low-grade gliomas
(Chen et al., 2010).
We expect more tumor infiltration and fiber disorga -nization in high-grade tumors. This study suggested that FDi is helpful to differentiate between the peri-tumoral tracts in high-grade gliomas (which are more destroyed) and low-grade gliomas.
In this study, we used FA-map (fractional anisotropy
map), which can define (in a superior way) the ana
-tomic relationship between tumor and adjacent fibers.
It is also more standard than gray scale images (T1, T2) for this purpose. In this way, we better characterized
peritumoral fibers and defined them in the contralateral hemisphere. Thus, our study has significant advantages over other studies. One cannot compare different fiber
tracts with each other due to extensive variations. We employed ratios of FDi to overcome this problem. Our study limitation is the effect of the tumor, which may
impact our findings. In this study, we investigated the
role of FDi in glial tumor grading by means of DTI and found it helpful in glial tumor grading.
Acknowledgements
This study was the result of MSc project (submitted by Fariba Davanian) in Shahid Beheshti University of Medical Sciences.
Conflict of Interest
All authors declared no conflict of interest.
References
Brat, D. J., & Van Meir, E. G. (2004). Vaso-occlusive and pro-thrombotic mechanisms associated with tumor hypoxia, necrosis, and accelerated growth in glioblastoma. Laboratory
Investigation, 84(4), 397-405. doi: 10.1038/labinvest.3700070.
Chen, Y., Shi, Y., & Song, Z. (2010). Differences in the archi-tecture of low-grade and high-grade gliomas evaluated using fiber density index and fractional anisotropy.
Jour-nal of Clinical Neuroscience, 17(7), 824-829. doi: 10.1016/j.
jocn.2009.11.022.
Hagmann, P., Jonasson, L., Maeder, P., Thiran, J. P., Van Wedeen, J., & Meuli, R. (2006). Understanding Diffusion MR Imaging Techniques: From Scalar Diffusion-weighted Imaging to Diffusion Tensor Imaging and Beyond.
Radio-Graphics, 26(1), 205-23. doi: 10.1148/rg.26si065510.
Jin, T., Zhang, Z., Yang, X. F., & Luo, J. S. (2015). S100A4 ex-pression is closely linked to genesis and progression of glioma by regulating proliferation, apoptosis, migration and invasion. Asian Pacific Journal of Cancer Prevention, 16(7), 2883-887. doi: 10.7314/apjcp.2015.16.7.2883
Johnson, P. C., Hunt, S. J., & Drayer, B. P. (1989). Human cer-ebral gliomas: Correlation of postmortem MR imaging and neuropathologic findings. Radiology, 170(1), 211-17. doi: 10.1148/radiology.170.1.2535765.
Kang, X., Chen, R., Zhang, J., Li, G., Dai, P. G., Chen, C., et al. (2015). Expression Profile Analysis of Zinc Transporters (ZIP4, ZIP9, ZIP11, ZnT9) in Gliomas and their Correlation with IDH1 Mutation Status. Asian Pacific Journal of Cancer Prevention, 16(8), 3355-360.
Kayama, T., Kumabe, T., Tominaga, T., & Yoshimoto, T. (1996). Prognostic value of complete response after the ini-tial treatment for malignant astrocytoma. Neurological
Re-search, 18(4), 321-24. doi: 10.1080/01616412.1996.11740429
Lee, H. Y., Na, D. G., Song, I. C., Lee, D. H., Seo, H. S., Kim, J. H., et al. (2008). Diffusion-tensor imaging for glioma grading at 3-T magnetic resonance imaging: Analysis of fractional anisotropy and mean diffusivity. Journal of
Com-puter Assisted Tomography, 32(2), 298-303. doi: 10.1097/
RCT.0b013e318076b44d
Figure 2. ROC curves for fiber density index ratio (FDit/n).
Leemans, A., Jeurissen, B., Sijbers, J., & Jones, D. K. (2009). Ex-ploreDTI: A graphical toolbox for processing, analyzing, and
visu-alizing diffusion MR data. Paper presented at the 17th Annual
Meeting of International Society for Magnetic Resonance in Medicine,Hawaii, USA, 17-24 April 2009.
Ma, L., & Song, Z. J. (2013). Differentiation between low-grade and high-grade glioma using combined diffusion tensor im-aging metrics. Clinical Neurology and Neurosurgery, 115(12), 2489-495. doi: 10.1016/j.clineuro.2013.10.003.
Malone, H., Yang, J., Hershman, D. L., Wright, J. D., Bruce, J. N., & Neugut, A. I. (2015). Complications Following Ste-reotactic Needle Biopsy of Intracranial Tumors. World
Neu-rosurgery, 84(4), 1084-089. doi: 10.1016/j.wneu.2015.05.025.
Min, Z. G., Niu, C., Rana, N., Ji, H. M., & Zhang, M. (2013). Dif-ferentiation of pure vasogenic edema and tumor-infiltrated edema in patients with peritumoral edema by analyzing the relationship of axial and radial diffusivities on 3.0T MRI.
Clinical Neurology and Neurosurgery, 115(8), 1366-370. doi:
10.1016/j.clineuro.2012.12.031.
Mori, S. (2007). New image contrasts from diffusion tensor imaging: Theory, meaning, and usefulness of DTI-based im-age contrast. In S. Mori (Ed.), Introduction to Diffusion Tensor
Imaging (pp. 69-84). Amsterdam: Elsevier Science B. V.
Roberts, T. P., Liu, F., Kassner, A., Mori, S., & Guha, A. (2005). Fiber density index correlates with reduced fractional anisotropy in white matter of patients with glioblastoma.
American Journal of Neuroradiology, 26(9), 2183-186. PMID:
16219820
Sawin, P. D., Hitchon, P. W., Follett, K. A., & Torner, J. C. (1998). Computed imaging-assisted stereotactic brain biop-sy: a risk analysis of 225 consecutive cases. Surgery
Neurol-ogy, 49(6), 640-49. doi: 10.1016/s0090-3019(97)00435-7
Watanabe, M., Tanaka, R., & Takeda, N. (1992). Magnetic reso-nance imaging and histopathology of cerebral gliomas.