ISSN: 2394-2231
http://www.ijctjournal.org
Page 62Cascade-Forward Algorithm to Extract Hidden Rules of Gastric
Cancer Information Based on Ontology
1Ms.Janani A.,
2Mrs. Shoba S.A.
1M.Phil Research Scholar, PG & Research Department of Computer Science &Information Technology Arcot Sri Mahalakshmi Women’s College ,Villapakkam , Tamil Nadu, India
2Head of the Deaprtment, PG & Research Department of Computer Science &Information Technology Arcot Sri Mahalakshmi Women’s College, Villapakkam, Tamil Nadu, India
---
************************
---Abstract:
Cancer is the leading cause of death in economically developed countries and the second leading cause of death in developing countries. Gastric cancers are among the most devastating and incurable forms of cancer and their treatment may be excessively complex and costly. Data mining, a technology that is used to produce analytically useful information, has been employed successfully with medical data. Although the use of traditional data mining techniques such as association rules helps to extract knowledge from large data sets, sometimes the results obtained from a data set are so large that it is a major problem. In fact, one of the disadvantages of this technique is a lot of nonsense and redundant rules due to the lack of attention to the concept and meaning of items or the samples. This paper presents a new method to discover association rules using ontology to solve the expressed problems. This paper reports a data mining based on ontology on a medical database containing clinical data on patients referring to the Imam Reza Hospital at Tabriz. The data set used in this paper is gathered from 490 random visitors to the Imam Reza Hospital at Tabriz, who had been suspicions of having gastric cancer. The proposed data mining algorithm based on ontology makes rules more intuitive, appealing and understandable, eliminates waste and useless rules, and as a minor result, significantly reduces Apriori algorithm running time. The experimental results confirm the efficiency and advantages of this algorithm
Keywords—
cascade forwarding algorithm, back propagation algorithm, cancer detection, mapping and ontology.---
************************
--- I. INTRODUCTIONLarge data sets are idle in database of companies, universities, etc. Using the hidden information in these data bases is based on the efficient management [3]. Data
mining is
looking for hidden relationships in databases. This process is more than just a simpleretrieving data and lets researchers to find new information from data.Cancer is the leading cause of death in economically developed countries and the second leading cause of death in developing countries. Gastric cancer is the fourth-most common cancer and the second leading cause of cancer deaths in the worldwide [12]. according to the latest researches conducted in Iran in 2008, 9.3 % of the common cancer is related to stomach cancer and it is the third most common cancer among men and women in the country A data set including 819 samples (24 positive
and 795 negative samples) and 31 features and three algorithms CN2 Rules and C4.5 and Naive Bayes to diagnose stomach cancer the most important risk stratification factor for esophageal adenocarcinoma, gastric cardiac, and noncardia gastric, with dietary factors (esophageal adenocarcinoma, noncardia gastric), smoking (esophageal adenocarcinoma, gastric cardiac), wine intake (gastric cardiac, noncredit gastric), age (noncredit gastric), and income (noncredit gastric) appearing o modify the risk of these cancer sites[2].
The two clinical factors, Her-1 and gender, can clearly characterize and differentiate these three groups In classifying and clustering somehow these methods derive patterns from the data set. For example, in the clustering, a pattern of similarity is defined and assessed. But the main focus is ondiscovering the hidden factors and influencing factors in this dangerous disease by thehelp ofdiscovering
ISSN: 2394-2231
http://www.ijctjournal.org
Page 63the association rules that no research evidence has been carried out in this regard. Most conducted researches that use discovery of association rules are applied for data collection of other cancers[5][6].
Kirshners et al. used a data set including 819 samples (24 positive and 795 negative samples) and 31 features and three algorithms CN2 Rules and C4.5 and Naive Bayes to diagnose stomach cancer. The results showed that sex and protein HER-1, are important factors in the diagnosis and classification of gastric cancer. Experimental results showed the average sensitivity >50 and 86–100 % at most, at the same time—having classification accuracy and specificity close to 65–70 %. Silvera et al[5]. used classification tree analysis to analyze data from a population-based case–control study (1095 cases, 687 controls) conducted in Connecticut, New Jersey, and Western Washington State. Frequency of reported gastro esophageal reflux disease symptoms was the most important risk stratification factor for esophageal adenocarcinoma, gastric cardia, and noncardia gastric, with dietary factors (esophageal adenocarcinoma, noncardia gastric) [9], smoking (esophageal adenocarcinoma, gastric cardia), wine intake (gastric cardia, noncardia gastric), age (noncardia gastric), and income (noncardia gastric) appearing to modify the risk of these cancer sites.
II. EFFECTIVE WORK 2.1 Background
Data mining is the process of extracting hidden knowledge from data. It can reveal the patterns and relationships among large amount of data in a single or several data sets. Data mining is used in various applications such as crime detection, risk evaluation market analysis, etc [4]. Several industries like banking, insurance, and marketing use data mining to reduce costs, and increase profits. The data mining process uses several techniques from statistics and artificial intelligence in a variety of activities or application areas. The main activities are as follows [2]:
Association: The identification of relationships between items in which the presence of one pattern implies the presence of another pattern; e.g., most patients who receive prescriptions for medication “A” also receive prescriptions for medication “B”.
Classification: Classification involves identifying profiles of classes in terms of their attributes and determining which of these predefined classes a new item belongs to. For example, given particular classes of patients with different medical treatment responses, the classification is used to identify the form of treatment to which a new patient is most likely to respond[5].
Clustering: Clustering is used to identify a set of classes in which particular items are grouped according to their characteristics. Clustering is best used to identify groups of items that are similar. For example, based on a patient data set, clustering can be used to identify subgroups of patients with similar treatment schemas[3][2].
Regression: For a set of items, regression is the analysis of the relationships of dependence between the values of the attributes. A model is automatically produced that can predict attribute values for new items. For example, with a data set for the medical procedures used in a treatment schema, regression is used to build a model that can predict the sequence of procedures in the treatment.
Prediction: For a specific item and a corresponding model, the capacity for prediction is the ability to predict the value of a specific attribute. For example, in a predictive model for treatment schema, prediction is used to determine the next procedure in the sequence of treatment.
Traditional data mining techniques such as association rules helps to extract knowledge from large data sets, sometimes the results obtained from a data set are so large that it is a major problem
.
A new method to discover association rules using ontology to solve the expressed problems. Experiments using the proposed algorithm have given results that are more concise and precise than the results obtained using Traditional data mining techniques. The quantitative comparison was performed according to the number of pruned rules. The qualitative comparison was performed by human evaluation.
Cardiovascular diseases are very common nowadays and are one of the main reasons of death. Being among the major types of these diseases, correct and in time diagnosis of Coronary Artery Disease (CAD) is very important . In this paper, a data set, called Z-Alizadeh Sane, is introduced which utilizes several new and effective features for CAD diagnosis, as well as a number of important and previously known ones. Also, a feature creation method is proposed in order to effectively increase the accuracy. (RoohallahAlizadehsani, JafarHabibi, Mohammad JavadHosseini, HodaMashayekhi, AsmaGhandeharioun, ReihaneBoghrati, BehdadBahadorian, Zahra AlizadehSani)
2.2 Ontology
ISSN: 2394-2231
http://www.ijctjournal.org
Page 64understanding of all concepts, and different ontologies can be built to describe the same domain [3].
Identifying the concepts and relations between concepts is crucial to building effective domain ontology. Although the semantics of the relations can be defined as one builds an ontology, there are some relations with established meanings, such as “is-a”, “part-of” and “attribute-of”. The first relation, is-a, comes from the set theory relation set and subset. The second relation, part-of, brings to bear the concept of composition/decomposition. The parts make the whole.
Fig2.1: Ontology design process
Diseases are divided into eight main categories: genetic disease, syndrome, medical disease, disease of metabolism, disease of cellular proliferation, disease by infectious agent, disease of anatomical entity and disease of mental health.
Fig2.2: Disease ontology
Types of Cancers:
Ontology shows information about cancers including three main classes such as disease of cellular proliferation, cancer and organ system cancer class of
body systems is a subclass of cancer class and cancer class is a subclass of the main classes of cell proliferation diseases.
Fig2.4: Cancer ontology
Gastric cancer
Main concepts on gastric cancer include some main sections such as types of stomach cancers, treatment, risk factor, symptom, clinical stage, and diagnose.
Ontology of the risk factors of gastric cancer
Ontologies of disease, cancer, and gastric cancer were considered for demonstrating current concepts related to the whole domain. Given to the extent and complexity of the ontology of gastric cancer in this study as well as the examined attributes on the risk factors of gastric cancer and the effective factors in the incidence of this disease, otology of the risk factors of gastric cancer which is, in fact, a part of the main ontology of gastric cancer are taken into consideration.
The risk factor class is the main class of this ontology and also one of the main classes of gastric cancer ontology which will be discusses in details because of its significant importance.
ISSN: 2394-2231
http://www.ijctjournal.org
Page 65III PREVIOUSIMPLEMENTATIONS
The use of association rules is a popular technique of mining data; the technique shows the correlation between sets of items in a series of data or transactions. A rule for a given dataset has the form A → B, where A and B are conditions on the values of the features. For each rule, two terms, namely support and confidence, are defined. Support of a rule means the proportion of data which satisfies both the left hand and right hand sides of that rule. Confidence means the probability of finding the right hand side of the rule in those item sets which satisfy the left hand side conditions as shown below:
Confidence (A→B) = Pr (A∪B)/Pr (A) (1)
To obtain rules, firstly conditions on features that have the highest probabilities are derived from the dataset. Then these conditions are split in all possible ways to form smaller conditions A and B. The most popular algorithm for obtaining association rules is Agrawal’s apriori. Considering a fixed confidence value, the setting of the support threshold will determine whether too many association rules are set or important relationships in the data are missed.
3.1 Mapping database to ontology
As mentioned in the previous section, risk factors of gastric cancer are divided into four subclasses including stomach condition, personal feature, systemic condition, and diet food. In fact, four main concepts on risk factors of gastric cancer were introduced. All attributes available in the database mapping to concepts exist in the ontology and risk factors of cancer. The concepts and relationships of the ontologies used in this work can be seen in
Fig3.1: Mapping based ontology
Regarding suggested ontology and the existing knowledge, the created rules get more inclusive removing the difficulties of the previous method.
Fig3.2: Workflow of the proposed algorithm
IV PROPOSED ANALYSIS
4.1 Mapping database to ontology
ISSN: 2394-2231
http://www.ijctjournal.org
Page 66human being. Thus, it requires proper organizing to better understand and use the rules.
2. The second problem of conventional method is producing high numbers of unattractive, meaningless rules.
3. The other weakness of Apriori algorithm is its long running time. If the existing features of database under consideration are in large numbers, running the algorithm requires high cost and time.
The suggested ontology combines domain knowledge, expert knowledge, and user knowledge from data set and association rules query is performed according to anthology manual. The existing knowledge in ontology indicates specific semantic relations among classes and typically features. Semantic relations of ontology notions referred as Meta Rules. Semantic content extracted from anthologies brings more knowledge and information into data mining; further, enhances the quality. Regarding suggested ontology and the existing knowledge, the created rules get more inclusive removing the difficulties of the previous method. A machine learning technique that uses Bayesian inference to obtain parsimonious solutions for regression and classification it has an identical functional form to the support vector machine, but provides probabilistic classification. It is actually equivalent to a Gaussian process model with covariance function:
, = 1 , ,
Where φ is the kernel function (usually Gaussian), and x1,...,xN are the input vectors of the training set.
Multilayer Perceptron (MLP) network is the most widely used neural network classifier. MLPs are universal approximates. MLPs are valuable tools in problems when one has little or no knowledge about the form of the relationship between input vectors and their corresponding outputs.
4.2 Feed-Forward Backpropagation
A Feed-Forward network consists of a series of layers. The first layer has a connection from the network input. Each subsequent layer has a connection from the previous layer. The final layer produces the network’s output. Feed-forward networks can be used for any kind of input to output mapping. Specialized versions of the feed-forward network include fitting (fitnet) and pattern recognition (patternnet) networks. Feed-forward backpropagation network is simply the application of backpropagation procedure into the feed-forward networks such that every time the output vector is presented, it is compared with the desired value and the error is computed. The error value tells us how far the network is from the desired value for a particular input and the backpropagation procedure is to minimize the sum of error for all the training samples.
The error is computed by,
Error = (desired value – actual value)2
The syntax of Feed-Forward Backpropagation takes the
following arguments:
net = feedforwardnet (hidden-Sizes,
training-function)
where,
hidden-sizes – Row vector of one or more hidden
layer sizes (Default = 10)
training-function – Training function (Default =
‘trainlm’)
The functions return a newfeed-forward backpropagation
network.
Fig4.1: Feed-Forward Network
This example shows how to use feedforward neural network to solve a simple problem.
[x,t] = simplefit_dataset;
net = feedforwardnet(10); net = train(net,x,t); view(net)
y = net(x); perf = perform(net,y,t)
4.3 Cascade-Forward Backpropagation
Cascade-Forward networks are similar to feed-forward networks, but include a connection from the input and every previous layer to following layers. As with feed-forward networks, two-or more layer cascade-network can learn any finite input-output relationship arbitrarily well given enough hidden neurons.
The syntax of Cascade-Forward Backpropagation takes the following arguments:
net = cascadeforwardnet (hidden-Sizes, training-function) where,
hidden-sizes – Row vector of one or more hidden layer sizes (Default = 10)
training-function – Training function (Default = ‘trainlm’)
ISSN: 2394-2231
http://www.ijctjournal.org
Page 67 Fig4.2: Cascade-Forward BackpropagationCertain points are noteworthy while developing either a feed-forward or cascade-forward networks as follows:
• The transfer functions can be any differentiable
transfer function such as tansig, logsig or purelin.
• The training function can be any of the
backpropagation training functions such as trainlm, trainbfg, trainrp, traingd, traingdx etc.
• The learning function can be either of the following functions such as learngd or learngdm
Cascade-forward networks are similar to feed-forward networks, but include a connection from the input and every previous layer to following layers. As with feed-forward networks, a two-or more layer cascade-network can learn any finite input-output relationship arbitrarily well given enough hidden neurons.
Here a cascade network is created and trained on a simple fitting problem.
[x,t] = simplefit_dataset;
net = cascadeforwardnet(10); net = train(net,x,t);
view(net)
y = net(x);
perf = perform(net,y,t)
4.4 Perceptron
Perceptrons are simple single-layer binary classifiers, which divide the input space with a linear decision boundary. Perceptrons can learn to solve a narrow range of classification problems. They were one of the first neural networks to reliably solve a given class of problem and their advantage is a simple learning rule.
The syntax of a perceptron takes the following arguments:
Perceptron(hardlimitTF, perceptronLF)
Where,
• hardlimitTF- hard limit Transfer function (Default
= ‘hardlim’)
• perceptronLF- perceptron Learning rule (Default
= ‘learnp’)
The functions return a new perceptron network.
Fig4.3: Perceptron Network
Algorithm: Generate Data Set
Input: Training Data, Testing Data
Output: Decision Value
Method:
Step 1: Load Dataset
Step 2: Classify Features (Attributes) based on class labels
Step 3: Estimate Candidate Support Value While (instances! =null)
Do
Step 4: Support Value=Similarity between each instance in the attributeFind Total Error Value
Step 5: If any instance < 0 Estimate
Decision value = Support Value/Total Error Repeat for all points until it will empty End If
Classification Tree Algorithm
Algorithm: Generate a Classification from the training tuples of data partition D.
Input:
• Data partition D, which is a set of training tuples and their associated class labels;
• Attribute list, the set of can didate attributes;
• Attribute selection method, a procedure to
determine the splitting criterion that “best” Partitions the data tuples into individual classes. These criterions consist of a splitting Attribute and, possibly, either a split point or splitting subset.
Output: A decision tree
Method:
1. Create a node N;
2. If tuples in D are all of the same class, C then 3. Return N as a leaf node labeled with the class C 4. If attribute list is empty then
5. Return N as a leaf node labele 6. d with the majority class in D
7. Apply Attribute selection method (D, attribute list) to find the “best” splitting criterion 8. Label node N with splitting criterion 9. If splitting attribute is discrete-valued and
ISSN: 2394-2231
http://www.ijctjournal.org
Page 6810. Attribute list ← attribute list − splitting attribute 11. For each outcome j of splitting criterion
12. Let Dj be the set of data tuples in D satisfying outcome j
13. If Dj is empty then
14. Attach a leaf labeled with the majority class in D to node N
15. Else attach the node returned by Generate decision tree (Dj, attribute list) to node N 16. End for
17. Return N
Variable name and Definition
S.no Variable name Definition
1 Local Recurrence Yes or No
2 Age at Diagnosis ≤ 35, 35 to 44, 44-55, 55 ≥ years old
3 Age at Menarche ≤ 12 to ≥ 12 years old
4 Age at Menopause ≤ 50 to ≥ 50 years old
5 Side Left, right, Bilateral
6 Tumor size ≤ 2cm to ≥ 5cm years old
7 Type of chemotherapy
Adjuvant or Neo Adjuvant
8 Hormone Therapy Tamoxifen, Raloxifen, Femara, Megance
9 Her2 Negative or Positive
Table: Parameters
V EVALUATION RESULT
The Wisconsin Breast Cancer datasets from the UCI Machine Learning Repository is used to differentiate benign (non-cancerous) from malignant (cancerous) samples. To evaluate the effectiveness of our method, experiments on WDBC is conducted. This database was obtained from the university of Wisconsin hospital, Madison from Dr. William H. Wolberg. This is publicly available dataset in the Internet. Table 1 shows a brief description of the dataset that is being considered.
The dataset for this study are collected from the Wisconsin breast cancer diagnosis database available in the UCI repository. All the data that have been collected are the results of diagnosis made through Biopsy procedures. There are 569 instances and 10 attributes which also contains patient’s ID number as a separate attribute. All the values are encoded with four significant digits. The ten real-valued attributes are as follows:
Data Set No. of attributes
No. of Instances
No. of Classes
Wisconsin Breast Cancer
(WBC)
11 699 2
Wisconsin Diagnosis Breast cancer
(WDBC)
11 699 2
Wisconsin Prognosis Breast Cancer
(WPBC)
11 699 2
5.1 EXPERIMENTAL RESULT
The experiment was carried out in MATLABworkspace (version number –MATLAB 2016a).MATLAB’s Neural Network Toolbox (NNTool) provided various features to carry out the implementation part of the three algorithms chosen as mentioned in the previous sections of this document. The network for feed-forward backpropagationand cascade-forward backpropagation were created by setting the training function TRAINGDX and learning function LEARNGDM. The errors are computed using the Mean Squared Error (MSE) function. The number of neurons and layers in the network are initialized at random and the transfer function used is LOGSIG. For perceptron, network is created using HARDLIM training function and LEARNP learning function. The network is thus created and trained number of times until satisfactory performance is met.
ISSN: 2394-2231
http://www.ijctjournal.org
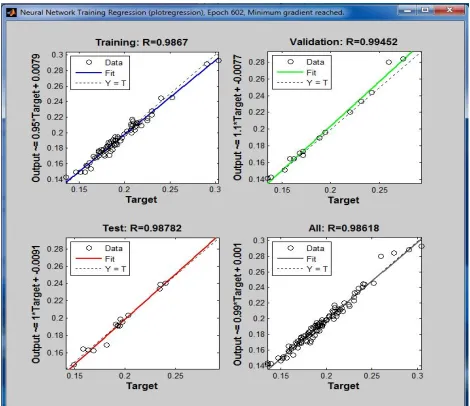
Page 69 Fig .5.1 (b) Regression Plot of Cascade-ForwardBackpropagation
Figure(c) shows the Performance of a perceptron network. The Regression plot displays three divisions of output namely Training, Validation and Testing. The Regression R values measure the correlation between outputs and targets. An R value of 1 means a close relationship and 0 a random relationship.
Fig .5.1 (c) Performance Plot of Perceptron Network
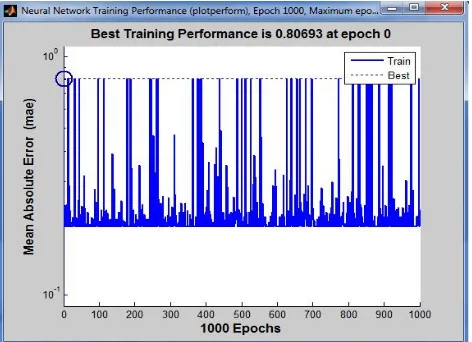
Based on the experimental analysis of the algorithms on the breast cancer diagnosis data, it is shown that the cascade-forward backpropagation algorithm works better than the feed-forward backpropagation and perceptron networks by producing the network output close to its target, supplying the value 0.99 which has a linear close relationship with that of the target data. The performance graph of the cascade-forward backpropagation network is given as follows:
Fig.5.2 Performance graph of Cascade-Forward Backpropagation Network
Clustering is one of the most important unsupervised learning problems in that it deals with finding a structure in a collection of unlabeled data. In other words, clustering is the process of organizing objects intogroups whose members are similar in some way.
VI CONCLUSION
ISSN: 2394-2231
http://www.ijctjournal.org
Page 70Although such esophageal cancers tend to have good prognosis due to early detection, both the diagnostic and therapeutic strategy may be challenging due to the limited available data in this field. Surgical treatment does not seem to eliminate the risk of cancer, as evident upon the present case report.
FUTURE WORK
A large dataset with added complicated attributes and many instances can be selected to enhance the diagnosis process of caustics cancer. Importing a very large dataset may also open paths to issues such as loading time, stability of the data values, prediction timing of the algorithm and so on. Also, experiments can be conducted by using powerful algorithms such as Radial Basis Function networks (RBF) or any hybrid combination of the algorithms that serves both in a supervised and unsupervised way. This challenge can be taken by the future researchers so that if implementedsuccessfully it paves way for a better diagnosis algorithm for caustics cancer.
REFERENCES
1. Agrawal R, Srikant R (1994) Fast algorithms for mining association rules in large databases. In: Proceedings of the 20thinternational conference on very large data bases. VLDB, Santiago, Chile 2. Alizadehsani R, Habibi J, Hosseini MJ (2013) A
data mining approach for diagnosis of coronary artery disease. ComputMethods Programs Biomed 111(1):269–282
3. Bathaie SZ, Mohagheghi MA (2012) Saffron aqueous extract inhibits the chemically-induced gastric cancer progressionin the Wistar albino rat. Iran J Basic Med Sci 16(1):27–38
4. Buitelar P, Cimiano P (2008) Ontology learning and population: bridging the gap between text and knowledge. IOS Press,Amsterdam, p 167 5. Carr JS, Zafar SF, Saba N, Khuri FR (2013) risk
factors for rising incidence of esophageal and gastric cardiaadenocarcinoma.JGastrointest Cancer 44:143–151
6. Chou S, Lee T, Shao Y, Chen IF (2004) Mining the breast cancer pattern using artificial neural networks and multivariateadaptive regression splines. Expert SystAppl 27(1):133–142
7. Eccher C, Scipioni A, Miller A (2013) An ontology of cancer therapies supporting interoperability and data consistency inEPRs. ComputBiol Med 43(7):822–832
8. Ehrig M (2007) Ontology alignment: bridging the semantic gap. Springer, New York, pp 100–
112Etemad K, Goya M, Ramazani R (2012) A report on cancer registries. Ministry of Health Deputy, Cancer for disease control
9. and prevention, Cancer Control Office. 45– 47Euzenat J, Shvaiko P (2007) Ontology matching. Springer, Trento, pp 98–130
10. Ferlay AJ, Shin HR, Bray F (2010) Estimates of worldwide burden of cancer in 2008: GLOBOCAN 2008. J Int Cancer 127(12):2893–2917
11. Goebel M, Gruenwald L (1999) A survey of data mining and knowledge discovery software tools. SIGKDD Explor 1:20–33Gruber TR (1993) A translation approach to portable ontology specification. KnowlAcquis 5(2):199–220
12. Jemal A, Bray F, Center MM, Forman D (2011) Global cancer statistics. CA Cancer J Clin 61:69–90 Kirshners A, Parshutin S, Leja M (2012) Research on application of data mining methods to diagnosing gastric cancer,
13. advances in data mining. In: Perner P (ed.) Applications and theoretical aspects. Lecture Notes in Computer Science, vol 7377. Springer-verlag, Berlin, Heidelberg, pp 24–37
14. Kumar V, Abbas AK, Fausto N (2013) Robbins basic pathology. Saunders, Philadelphia, pp 548– 590