Copyright © 2012 IJECCE, All right reserved
A Survey of Data Mining Techniques for Smart Grid
Systems
Mrs. Gresha Bhatia
Dr. Mrs. Suneeta Sane
Abstract - Electricity generated through steam and hydro– turbines have been serving us since ages. It has reached its limits. Outages, blackouts are becoming inevitable. So, there is a need to develop a system that is able to identify the links right from the source of electricity generation to the consumers that are vulnerable to failures, automatically switch over to other network load if need be , be prepared prior to such a situation and hence take corrective measures to restore the electricity transparently. All this can be done by applying machine learning and data mining algorithms to the existing infrastructure. This leads to development of a system that is smart, intelligent and works transparently towards its goal i.e. preventing power failures.
The aim of this paper is to focus on the existing electricity generation infrastructure, the factors that affect the current system and the need for Smart Grid. The various methods that have been concentrated on are that of machine learning and data mining techniques that can be mapped to these smart grid environments. For each of these techniques namely - data mining, ranking, visualization and testing, we have highlighted the key points of every technique stating their advantages, features of each. In this paper we have also tried to analyze the evaluation framework that would aid in monitoring grid activities depending on the type of data, anticipate and respond to system disturbances proactively based on the method applied to minimize the impact of power failure on consumers and thereby improvise the overall performance of the system.
Keywords - Data mining, Electrical infrastructure, evaluation framework, Smart grid.
I. I
NTRODUCTIONGeneration of electricity and its power grid is a complex task lot of uncertainties at various levels. In today’s environment, the infrastructure is collapsing. There is a shortage of electricity, blackouts and outages are becoming inevitable. The entire infrastructure is crumbling so its efficient, reliable and safe operation and control is becoming a challenge today. To overcome the challenges brought about by this complexity, the power system needs intelligence at all levels, right from electricity generation through transmission to distribution level [1]. Therefore, the traditional way of modelling, controlling and optimization of the power grid needs to be elevated into a smart grid that is capable of rapid adaptation, having dynamic foresight, being fault-tolerant and robust to disturbances and randomness.
This paper describes the various data mining and machine learning techniques that can be applied for providing computational intelligence of prediction of failures at component or equipment level [1]. Other surveys on SG were done in [28, 29, 30, 31, 32]. Hassan and Radman [33] briefly reviewed the basic concepts of smart grid and some technologies that could be used in them. Akyol et al. [28] analyzed how, where, and what
types of wireless communications are used. Brown and Suryanarayanan [30] determined an industry perspective for the smart distribution system and identified those technologies which could be applied in the future research in the smart distribution system. Baumeister [29] presented a review of the work related to smart grid cyber security. Our survey checks out the data mining techniques .This survey is structured as follows. In Section II, we present a background of generation of electricity. In Section III and IV we identify the factors that issues for failure. We then describe the need and give an overview of the smart grid system along with few of its properties in Sections V-VI respectively. We next describe the various data mining and machine learning techniques that can be utilized in a smart environment to make the system resilient in section VII. Section VIII gives an insight into the various data mining, ranking, visualization and testing techniques. Section IX provides an evaluation framework for the various data parameters, the techniques employed and measurement of the improvement in the system performance. Section X, we conclude this survey and present some lessons learned.
II. B
ACKGROUNDGeneration of electricity [3] [5] can be divided into various parts:
1. Generation: Large amount electrical current is generated by applying force of water, steam, or hot gasses on a turbine that spins an electromagnet. This activity is done at the generating station.
2. Transmission: This current and hence the power is ramped up to a high voltage for long distance transmission via feeder cables and power grids to substations closer to the customers
3. Primary Distribution: Power or electricity generated is distributed further at mid-level voltage from substations to local transformers.
4. Secondary Distribution: Electricity is then passed through a number of distribution lines via switches to local low voltage networks to the individual customers.
Fig.1. Electricity Distribution
III. I
SSUEST
HATN
EEDT
OB
EH
ANDLEDThe distribution grid is organized into networks, each composed of a substation, its attached primary feeders,
Copyright © 2012 IJECCE, All right reserved
A Survey of Data Mining Techniques for Smart Grid
Systems
Mrs. Gresha Bhatia
Dr. Mrs. Suneeta Sane
Abstract - Electricity generated through steam and hydro– turbines have been serving us since ages. It has reached its limits. Outages, blackouts are becoming inevitable. So, there is a need to develop a system that is able to identify the links right from the source of electricity generation to the consumers that are vulnerable to failures, automatically switch over to other network load if need be , be prepared prior to such a situation and hence take corrective measures to restore the electricity transparently. All this can be done by applying machine learning and data mining algorithms to the existing infrastructure. This leads to development of a system that is smart, intelligent and works transparently towards its goal i.e. preventing power failures.
The aim of this paper is to focus on the existing electricity generation infrastructure, the factors that affect the current system and the need for Smart Grid. The various methods that have been concentrated on are that of machine learning and data mining techniques that can be mapped to these smart grid environments. For each of these techniques namely - data mining, ranking, visualization and testing, we have highlighted the key points of every technique stating their advantages, features of each. In this paper we have also tried to analyze the evaluation framework that would aid in monitoring grid activities depending on the type of data, anticipate and respond to system disturbances proactively based on the method applied to minimize the impact of power failure on consumers and thereby improvise the overall performance of the system.
Keywords - Data mining, Electrical infrastructure, evaluation framework, Smart grid.
I. I
NTRODUCTIONGeneration of electricity and its power grid is a complex task lot of uncertainties at various levels. In today’s environment, the infrastructure is collapsing. There is a shortage of electricity, blackouts and outages are becoming inevitable. The entire infrastructure is crumbling so its efficient, reliable and safe operation and control is becoming a challenge today. To overcome the challenges brought about by this complexity, the power system needs intelligence at all levels, right from electricity generation through transmission to distribution level [1]. Therefore, the traditional way of modelling, controlling and optimization of the power grid needs to be elevated into a smart grid that is capable of rapid adaptation, having dynamic foresight, being fault-tolerant and robust to disturbances and randomness.
This paper describes the various data mining and machine learning techniques that can be applied for providing computational intelligence of prediction of failures at component or equipment level [1]. Other surveys on SG were done in [28, 29, 30, 31, 32]. Hassan and Radman [33] briefly reviewed the basic concepts of smart grid and some technologies that could be used in them. Akyol et al. [28] analyzed how, where, and what
types of wireless communications are used. Brown and Suryanarayanan [30] determined an industry perspective for the smart distribution system and identified those technologies which could be applied in the future research in the smart distribution system. Baumeister [29] presented a review of the work related to smart grid cyber security. Our survey checks out the data mining techniques .This survey is structured as follows. In Section II, we present a background of generation of electricity. In Section III and IV we identify the factors that issues for failure. We then describe the need and give an overview of the smart grid system along with few of its properties in Sections V-VI respectively. We next describe the various data mining and machine learning techniques that can be utilized in a smart environment to make the system resilient in section VII. Section VIII gives an insight into the various data mining, ranking, visualization and testing techniques. Section IX provides an evaluation framework for the various data parameters, the techniques employed and measurement of the improvement in the system performance. Section X, we conclude this survey and present some lessons learned.
II. B
ACKGROUNDGeneration of electricity [3] [5] can be divided into various parts:
1. Generation: Large amount electrical current is generated by applying force of water, steam, or hot gasses on a turbine that spins an electromagnet. This activity is done at the generating station.
2. Transmission: This current and hence the power is ramped up to a high voltage for long distance transmission via feeder cables and power grids to substations closer to the customers
3. Primary Distribution: Power or electricity generated is distributed further at mid-level voltage from substations to local transformers.
4. Secondary Distribution: Electricity is then passed through a number of distribution lines via switches to local low voltage networks to the individual customers.
Fig.1. Electricity Distribution
III. I
SSUEST
HATN
EEDT
OB
EH
ANDLEDCopyright © 2012 IJECCE, All right reserved and a secondary grid. Failure in any one of them can have
a cascading effect. So, the networks have to be electrically isolated from each other. The feeders (power lines) of the primary grid are critical and have a significant failure rate. Therefore, much of the daily work would require continuous monitoring, maintenance and speedy repair on failure.
IV. R
EASONS FORF
AILUREEvery link in the infrastructure is susceptible to various failures – natural calamity, deliberate sabotage, human errors etc of which equipment or component failure forms a major vulnerable part. [34, 35, 36]
1) Equipments, feeders (line) are susceptible to different types of failures
namely:- Ageing
Power quality events ( spikes ) Overloads ( seasonal variations ) Known weak components At-risk topologies
2) Some feeders may fail multiple times within a short time span (infant mortality) or can last more than a few years.
Fluctuations in survival times can result in very unbalanced dataset.
3) Emergency isolations caused by automatic substation relays.
Other factors that also need to be considered apart from failures
include:- Initial quality
History of exposure to moisture Current load on feeder
Impulse/mechanical stress Data size
Security Loss of electricity generated Blackouts and outages
Interconnection mismatches etc
V. N
EED FORS
MARTG
RIDLooking at the factors that affect the electricity infrastructure there is a need to develop a system that would automatically perform emergency identification, construct models to determine the time between failures (TBF), rank the equipments according to their failure rates, evaluates and tests the system in terms of its performance measures.
This leads to the development of a smart grid system for generation of electricity.
VI. O
VERVIEW OFS
MARTG
RIDS
YSTEMThe traditional system however is a centralized one way communication network leading to failures and blackouts. This leads to the use of smart grids. The smart grid also referred to as Intelligent
Grid/Intelligrid and FutureGrid [1][17] can be said to be a digital upgrade of the existing electricity infrastructure,
providing two way flows of electricity and information. This leads to a distributed network that is intelligent, smart, adopting various strategies for safe, reliable, effective, resilient network. These smart grids themselves have the following properties:
Self-healing capability. Fault-tolerant.
Allow integration of all energy generation Dynamic optimization of grid operation and
resources
Clients can provide timely information
Improves reliability, power quality, security and efficiency of the electricity infrastructure etc In this paper, we surveyed the need for advanced monitoring, forecasting and prediction techniques that could help in developing algorithms which would assist in better resilient system.
VII. M
ODELLING ANDT
ESTINGT
ECHNIQUESE
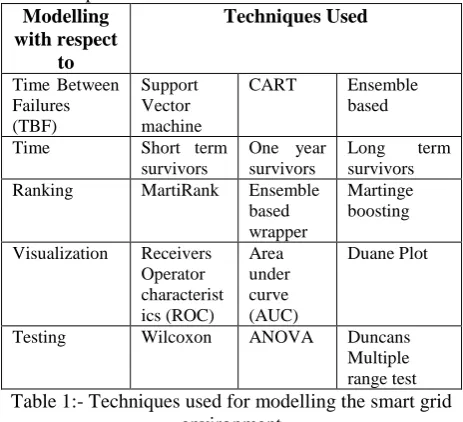
MPLOYEDGanesh K. Venayagamoorthy of [1] describes the potentials and promises of the computational intelligence for smart grid operation and control enable or facilitates intelligent behaviour in the smart grid. Since the smart grid needs to identify failure beforehand to avoid widespread network failure due to cascading and interactive effects, various techniques need to be identified. This paper identifies various data mining, ranking, visualization and testing techniques that can aid in preventive maintenance of the smart grid as shown in the table1 below. This table has been based considering parameters of time, mean time of failure and ranking within components
Modelling with respect
to
Techniques Used
Time Between Failures (TBF)
Support Vector machine
CART Ensemble based Time Short term
survivors
One year survivors
Long term survivors Ranking MartiRank Ensemble
based wrapper
Martinge boosting Visualization Receivers
Operator characterist ics (ROC)
Area under curve (AUC)
Duane Plot
Testing Wilcoxon ANOVA Duncans Multiple range test
Table 1:- Techniques used for modelling the smart grid environment
VIII. C
OMPARISON OFT
HEM
ODELLING ANDT
ESTINGT
ECHNIQUESCopyright © 2012 IJECCE, All right reserved propose an ensemble approach for Feature Ranking,
selecting the relevant features in order to focus the learning search. In [20] the authors the various data mining techniques are represented in brief to show how this can be applied to the grid environment. The linear classifiers and the key parameters of high margin along with the quadratic classifiers are represented in [21].Lior Rokach in [23] gives the idea of ensemble methodology to build a predictive model by integrating multiple models for improving prediction performance. The types of ensembles are further explored in [23] [24]. CART technique is defined in [13]. An integrated view of the same is shown in table 2. This section of the paper is further subdivided into integration of techniques for mining, ranking, visualization and testing respectively into tables for each.
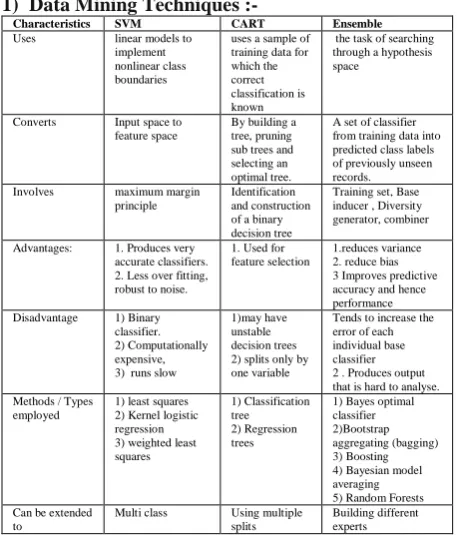
1) Data Mining Techniques
:-Characteristics SVM CART Ensemble
Uses linear models to implement nonlinear class boundaries
uses a sample of training data for which the correct classification is known
the task of searching through a hypothesis space
Converts Input space to feature space
By building a tree, pruning sub trees and selecting an optimal tree.
A set of classifier from training data into predicted class labels of previously unseen records. Involves maximum margin
principle
Identification and construction of a binary decision tree
Training set, Base inducer , Diversity generator, combiner
Advantages: 1. Produces very accurate classifiers. 2. Less over fitting, robust to noise.
1. Used for feature selection
1.reduces variance 2. reduce bias 3 Improves predictive accuracy and hence performance Disadvantage 1) Binary
classifier. 2) Computationally expensive, 3) runs slow
1)may have unstable decision trees 2) splits only by one variable
Tends to increase the error of each individual base classifier 2 . Produces output that is hard to analyse. Methods / Types
employed
1) least squares 2) Kernel logistic regression 3) weighted least squares
1) Classification tree 2) Regression trees
1) Bayes optimal classifier 2)Bootstrap aggregating (bagging) 3) Boosting 4) Bayesian model averaging 5) Random Forests Can be extended
to
Multi class Using multiple splits
Building different experts
Table 2 :- Comparison of the data mining techniques for smart grid system.
2) Ranking
techniques:-In [4] the authors give an overview of the electricity generation followed by the problem statement. An algorithm for MartiRank is discussed further followed by the use of AI techniques. This is then followed by the future work in this direction. [10] gives the fundamentals behind machine learning techniques, information about SVM and MartiRank followed by software testing approach for the problem domain defined. , In [7] the authors give an overview of how feature selection can be a major bottleneck for supervised machine learning An relaxed approach for feature selection i.e. feature ranking with respect to its relevance is elaborated. This is then followed by an experimental setup for the same. In [8] the authors Hoi and discuss about the semi supervised ensemble ranking systems followed by performance
evaluation and comparison methods. Hwanjo Yu and Sungchul Kim [6] elaborate on the two special properties of SVMs that SVMs achieve (1) high generalization by maximizing the margin and (2) support an efficient learning of nonlinear functions by kernel trick.[8] gives an introduction to linear SVM and features of ranking strategies followed by experimental setup. Our survey combines these techniques and represents them in the tabular format as shown in the table 3 below.
Characteri stics
MartiRank SVM Ensemble
Features Adapted to ranking and is a Batch algorithm
developed for classification and extended for regression and preference (or rank) learning
Predictive models that selects and then ranks the relevant features according to their relevance Advantage 1Fast, easy to
implement 2Interpretable 3 Only one tuning parameter
1. High generalization 2.Maximizing the margin 3. Efficient learning of nonlinear functions by Kernel trick
1. Improve the retrieval performance 2. increased accuracy 3. improves interpretability and generalization
Disadvanta ge
1.Only one tuning parameter, 2. making quantitative predictions about the time to failure of each feeder and relevant component in the network.
causal importance is not considered and, thus, they do not enhance our knowledge of the underlying causal relationships between features
learned weights for ranking algorithms are query independent.
Uses Applies the segmentation and the sorting rules from the model to the testing data set to produce the ranking
Global ordering of data
training data to combine the ranking results output from multiple ranking Algorithms.
Types Using experts Ranking vector machine
RankBoost, Ranking SVM, ListNet, AdaRank, MHR-BC, SER, SSER, tree-based ensembles (Random Forest) Strategies /
Algorithms
Provides algorithm with the device failure application in mind
F-score for Feature Ranking, Linear SVM Weight, Change of AUC with/without Removing Each Feature, Change of Accuracy with/without Removing Each Feature
ROGER
Table 3:- Comparison of the ranking techniques employed
3) Visualization
Copyright © 2012 IJECCE, All right reserved the literature and present their own active learning
algorithms to maximize the AUC of the hypothesis and also provides ROC information. Our survey combines the information in a tabular format as represented in the table 4 below.
Characteristics AUC ROC Duane Plot
Measures Classifier accuracy
Skewed class distribution and unequal classification error cost.
Cumulative number of failures vs. time
Calculation of variability done
1) Confidence 2)Standard error of Wilcoxon 3) Cross validation
1)Confusion matrix 2)Contingenc y matrix
1) R2 value 2)Monte Carlo simulation
Highlight Not dependent on decision threshold chosen
2-D depiction of classifier performance
Log-log plot
Useful for Determining sensitivity
Determining relative trade off between benefits and costs
Graphical analysis of reliability growth , parameter estimation, reliability distortion Disadvantage Deals with two
classes
Deals with two classes
It may become awkward to compare visual acuity values,
Table 4:- Comparison of the visualization techniques
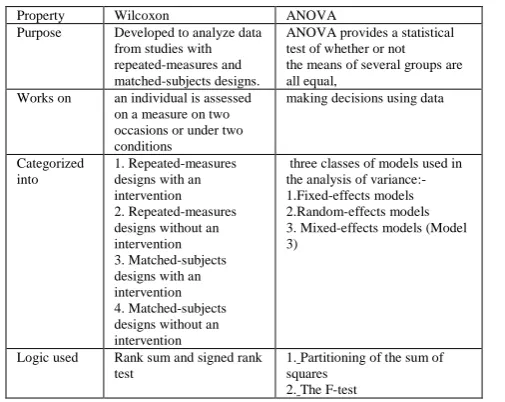
4) Testing techniques
:-Paper [13] gives an overview of Wilcoxon testing, assumptions underlying a Wilcoxon test with an example. Misconceptions namely (1) false statement, (2) true premise, but false conclusion, and (3) true statement irrespective of the test chosen are expressed in [14]. [12] gives us an overview of ANOVA in terms of background, terminology used, assumptions made, its models, logic applied and associated analysis. Table 5 summarizes the testing techniques.
Property Wilcoxon ANOVA
Purpose Developed to analyze data from studies with repeated-measures and matched-subjects designs.
ANOVA provides a statistical test of whether or not the means of several groups are all equal,
Works on an individual is assessed on a measure on two occasions or under two conditions
making decisions using data
Categorized into
1. Repeated-measures designs with an intervention 2. Repeated-measures designs without an intervention 3. Matched-subjects designs with an intervention 4. Matched-subjects designs without an intervention
three classes of models used in the analysis of variance:-1.Fixed-effects models 2.Random-effects models 3. Mixed-effects models (Model 3)
Logic used Rank sum and signed rank test
1. Partitioning of the sum of squares
2. The F-test
Table 5:- Comparison of the testing techniques used
IX. E
VALUATIONF
RAMEWORK[3] gives an overview of the smart grid system, dividing it into protection, infrastructure and management system , comparing it with the traditional systems and identifying the challenges for the new systems. [17] elaborates the fact that the control of electric power systems relies on the availability, quality of sensor measurements and the various techniques used and each of them is subjected to faults caused by broken or bad connections, bad communication, sensor failure, or malfunction of some hardware or software. So the entire system needs to be evaluated and tested automatically, continuously and transparently. This leads to development of the evaluation framework. Our paper represents the evaluation framework considering the input data quality, machine learning and data mining techniques and then identifying the improvements in system performance.
The evaluation framework comprises of:-1) Evaluation of the input data quality
This phase comprises of checking the inputs to the system namely – number of joints, cables, voltage, peak load etc. This can result in accurate feature selection, feature derivation and identify the potentially vulnerable component or equipment.
2) Evaluation of machine learning and data mining techniques
Out of the various techniques discussed i the paper above, the suitable technique is identified and applied to the ranked components, its effect seen on the ROC curve and AUC
3) Evaluation of improvement of the smart power grid. The output thus obtained from the earlier step can be compared with the previous reading to determine the system improvements, fewer outages and longer time between failures through the Duane plot.
X. C
ONCLUSIONThe electric power grid is rapidly growing and demanding new technologies for fault tolerant systems. Advanced intelligent techniques are required to handle the smart grid operation in an efficient and economical manner. Various techniques need to be combined so as to identify the failed component, rectify it automatically and transparently. The entire process can be done by applying the data mining, machine learning, visualization and testing techniques.
R
EFERENCES1) Ganesh K. Venayagamoorthy, Senior Member,IEEE,” Potentials and Promises of Computational Intelligence for Smart Grids”,June 2009
2) Melike Erol-Kantarci and Hussein T. Mouftah School of Information Technology and Engineering, University of Ottawa,” Demand Management and Wireless Sensor Networks in the Smart
Grid”, July
2011http://cdn.intechopen.com/pdfs/17062/InTechDemand_manag ement_and_wireless_sensor_networks_in_the_smart_grid.pdf 3) Felix salfner, Maren lenk, and miroslaw malek humboldt , “A
Copyright © 2012 IJECCE, All right reserved Methods”,Jan2009,http://informatik.huberlin.de/Members/salfner/p
ublications/salfner10survey.pdf
4) Marta Arias, Hila Becker,” Predicting Electricity Distribution Feeder Failures Using Machine Learning Susceptibility Analysis”. 5) Yin-Wen Chang , Chih-Jen Lin, “Feature Ranking Using Linear
SVM , “JMLR: Workshop and Conference Proceedings 3: 53-64
WCCI2008 workshop on
causality“http://jmlr.csail.mit.edu/proceedings/papers/v3/chang08a/ chang08a.pdf
6) http://people.sabanciuniv.edu/berrin/cs512/lectures/11-svmtutorial2.pdf
7) Kees Jong, Jeremie Mary, Antoine Cornu_ejols,Elena Marchiori, and Michele Sebag, “Ensemble Feature Ranking”, http://www.cs.ru.nl/~elenam/pkdd04.pdf
8) Steven C.H. Hoi, Rong Jin , “ Semi-Supervised Ensemble Ranking,
April 2008
http://www.cais.ntu.edu.sg/~chhoi/paper_pdf/AAAI13HOIS.pdf 9) http://www.google.co.in/url?sa=t&rct=j&q=martirank&source=web
&cd=2&sqi=2&ved=0CE8QFjAB&url=http%3A%2F%2Fcarbon.v ideolectures.net%2F2006%2Fpascal%2Flearning06_vilanova%2Fa rias_marta%2Flearning06_arias_pedff_01.ppt&ei=P2_wT_3mE43 LrQer65GDQ&usg=AFQjCNEjSDUXE3Tkizpw2w6on9fZzUamo w
10) Christian Murphy, Gail Kaiser , Marta Arias,“An Approach to Software Testing of Machine Learning Applications”, Feb 2007 http://www.lsi.upc.edu/~marias/papers/seke07.pdf
11) http://en.wikipedia.org/wiki/Predictive analytics 12) http://en.wikipedia.org/wiki/Analysis_of_variance
http://vicos.fri.unilj.si/data/vprsistemi/ROCintro.pdf
13) Shlomo S. Sawilowsky ,Wayne State University,” Misconceptions Leading to Choosing the t Test Over the Wilcoxon Mann-Whitney Test for Shift in Location Parameter” , Journal of Modern Applied Statistical Methods, November, 2005, Vol. 4, No. 2, 598-600 http://education.wayne.edu/jmasm/sawilowsky_misconceptions.pdf 14) Robert , “ EPS 625 – INTERMEDIATE STATISTICS
WILCOXON TEST “ Feb 2008
,http://oak.ucc.nau.edu/rh232/courses/EPS625/Handouts/Nonparam etric/The%20Wilcoxon%20Test.pdf
15) Xi Fang, Student Member, IEEE, Satyajayant Misra, Member, IEEE, Guoliang Xue, Fellow, IEEE,and Dejun Yang, Student
Member, IEEE, “Smart Grid–The New and Improved Power Grid: A Survey” , Oct 2011
http://optimization.asu.edu/~xue/papers/SmartGridSurvey.pdf 16) Leon Wu , Gail Kaiser, Cynthia Rudin, Roger Anderson, “Data
Quality Assurance And Performance Measurement Of Data Mining For Preventive Maintenance Of Power Grid
http://www.dmargineantu.net/kdd4service2011/Slides/LeonWu.pdf 17) Leon Wu , Gail Kaiser, Cynthia Rudin, Roger Anderson, Data
Quality Assurance and Performance Measurement of Data Mining for Preventive Maintenance of Power Grid, August 2011
http://web.mit.edu/rudin/www/WuEtAl11KDDService.pdf 18) David M.J. Tax, “Classifier complexityand SVM’s”, June 2008
http://cic.puj.edu.co/wiki/lib/exe/fetch.php?media=grupos:destino:4 _1_complexity_handouts.pdf
19) S. B. Kotsiantis, Department of Computer Science and TechnologyUniversity of Peloponnese, Greece, “Supervised Machine Learning: A Review of Classification Techniques”, Informatica July 2007
http://www.informatica.si/PDF/31-3/11_Kotsiantis%20%20Supervised%20Machine%20Learning%20 %20A%20Review%20 of...pdf
20) http://www.dtreg.com/index.htm 21) http://www.autonlab.org/tutorials/svm. pdf
22) Jan Luts, Fabian Ojeda, Raf Van de Plas, Bart De Moor, Sabine Van Huffel, Johan A.K. Suykens, “A tutorial on support vector machine-based methods for classification problems in chemometrics” ,elseivers.com , Analytica Chimica Acta 665 (2010) 129–145, April 2010
ftp://ftp.esat.kuleuven.be/pub/sista/jluts/reports/SVMtutorial.pdf 23) Lior Rokach, “Ensemble-based classifiers, Published
Online: 19 November 2009 © Springer Science Business Media B.V. 2009
http://www.ise.bgu.ac.il/faculty/liorr/AI.pdf
24) Johannes Fuernkranz, “ Ensemble Classifiers “ , Jan 2005http://www.ic.unicamp.br/~wainer/cursos/1s2012/mc906/ense mbles.pdf
25) Remco R. Bouckaert, “Efficient AUC Learning Curve Calculation”http://www.cs.waikato.ac.nz/~remco/roc.pdf
26) Harvey Motulsky , “GraphPad Prism Version 4.0 Statistics Guide Statistical analyses for laboratory and clinical researchers “, March 2005
http://www.graphpad.com/manuals/prism4/StatisticsGuide.pdf 27) Matt Culver, Deng Kun, and Stephen Scott, “Active Learning to
Maximize Area Under the ROC Curve”, IEEEProceedings of the Sixth International Conference on Data Mining , September 2006 (ICDM'06) http://www.cse.unl.edu/~sscott/research/papers/icdm06 28) B. Akyol, H. Kirkham, S. Clements, and M. Hadley. A survey of
wireless communications for the electric power system. Prepared for the U.S. Department of Energy, 2010.
29) T. Baumeister. Literature review on smart grid cyber security, Technical Report, http://csdl.ics.hawaii.edu/techreports/10-11/10-11.pdf. 2010.
30) H. E. Brown and S. Suryanarayanan. A survey seeking a definition of a smart distribution system. North American Power
Symposium’09, pages 1–7, 2009.
31) T. M. Chen. Survey of cyber security issues in smart grids. Cyber Security, Situation Management, and Impact Assessment II; and Visual Analytics for Homeland Defense and Security II (part of SPIE DSS 2010), pages 77090D–1–77090D–11, 2010.
32) X. Chen, H. Dinh, and B. Wang. Cascading failures in smart grid benefits of distributed generation. IEEE SmartGridComm’10, pages73–78, 2010.
33) R. Hassan and G. Radman. Survey on smart grid. IEEE SoutheastCon2010, pages 210–213, 2010.
34) S.M.Amin , U.S electrical rid gets less reliable, IEEE Spectrum, page 80 , January 2011
35) H.Becker and M.Arias, Real-time ranking with concept drift using expert advice. In proceedings of the 13th ACM SIGKDD
International conference on Knowledge Discovery and Data mining (KDD), pages 86-94, NewYork, USA, 2007 ACM
36) U.S Canada Power System Outage Task Force Interim Report. Causes for the August 14th blackout in the United States and
Canada, 2003
A
UTHOR’
SP
ROFILEMrs. Gresha S Bhatia
born in 1970,Mumbai She has completed her post graduation M.E ( I.T) from VESIT , chembur , Mumbai , India in September 2004. She is currently the Deputy H.O.D, Computer Engineering department, VESIT, Chembur, Mumbai and has an experience of 16 years in the institute and has a research interest in data mining and forecasting. Mrs .Bhatia is also the branch counsellor for IEEE at VESIT and has a number of papers published in the international conferences and national conferences.
Dr. Sunita Sane
has completed her Ph.D from IIT in 1980 and her post graduation M.S. (Computer Science from Central Michigan University, U.S.A in1992. She is currently the Professor, Head, Computer Technology Department (MCA) and is also the dean , research and development , VJTI , Matunga , Mumbai and has an experience of 14 years in the institute and has a research interest in Mobile Database Systems (MDS), Concurrency Control, Recovery, and Security on Mobile Database Systems, Workflow on the WEB and Mobile Platform, Data Warehousing and Data Mining. Software Engineering. Dr. Sane is also a member of NBA committee for Accreditation Program Committee member for 10th International Conference Mobile Data