R E S E A R C H A R T I C L E
Open Access
Permutation-based variance component test in
generalized linear mixed model with application
to multilocus genetic association study
Ping Zeng
1,2, Yang Zhao
1, Hongliang Li
3, Ting Wang
2and Feng Chen
1*Abstract
Background:In many medical studies the likelihood ratio test (LRT) has been widely applied to examine whether the random effects variance component is zero within the mixed effects models framework; whereas little work about likelihood-ratio based variance component test has been done in the generalized linear mixed models (GLMM), where the response is discrete and the log-likelihood cannot be computed exactly. Before applying the LRT for variance component in GLMM, several difficulties need to be overcome, including the computation of the log-likelihood, the parameter estimation and the derivation of the null distribution for the LRT statistic.
Methods:To overcome these problems, in this paper we make use of the penalized quasi-likelihood algorithm and
calculate the LRT statistic based on the resulting working response and the quasi-likelihood. The permutation procedure is used to obtain the null distribution of the LRT statistic. We evaluate the permutation-based LRT via simulations and compare it with the score-based variance component test and the tests based on the mixture of chi-square distributions. Finally we apply the permutation-based LRT to multilocus association analysis in the case–control study, where the problem can be investigated under the framework of logistic mixed effects model.
Results:The simulations show that the permutation-based LRT can effectively control the type I error rate, while the score test is sometimes slightly conservative and the tests based on mixtures cannot maintain the type I error rate. Our studies also show that the permutation-based LRT has higher power than these existing tests and still maintains a reasonably high power even when the random effects do not follow a normal distribution. The application to GAW17 data also demonstrates that the proposed LRT has a higher probability to identify the association signals than the score test and the tests based on mixtures.
Conclusions:In the present paper the permutation-based LRT was developed for variance component in GLMM. The
LRT outperforms existing tests and has a reasonably higher power under various scenarios; additionally, it is conceptually simple and easy to implement.
Keywords:Likelihood ratio test, Permutation procedure, Variance component, Multilocus association analysis, Working response, Penalized quasi-likelihood algorithm, Generalized linear mixed model, Logistic mixed effects model
* Correspondence:[email protected] 1
Department of Epidemiology and Biostatistics, School of Public Health, Nanjing Medical University, Nanjing 211166, Jiangsu, People’s Republic of China Full list of author information is available at the end of the article
Background
LRT for variance component in LMM
In many medical researches the main interest often lies on the problem of testing whether a random effects vari-ance component is equal to zero within the mixed ef-fects models framework. The variance component test has long been a statistical challenge and received much attention in the literature; see for example, Self and Liang [1], Stram and Lee [2], Liang and Self [3], more re-cently Lindquist, et al. [4], Drikvandi, et al. [5], Nobre, et al. [6], and many others. Beyond the direct interest, some other scientific problems under investigation can be also transformed into this similar issue. For example, to test a parametric null model against a nonparametric alternative in the penalized spline regression, Claeskens [7] first constructed a mixed effects model so that the hypothesis testing was reduced to the problem that whether the variance component of random effects was zero, and then performed a restricted likelihood ratio lack-of-fit test. Analogous transforms and hypothesis testing problems were also studied by Crainiceanu and Ruppert [8-10], Crainiceanu, et al. [11] and Greven, et al. [12].
The variance component test is nonstandard in the sense that under the null the variance component is on the boundary of the parameter space. In this situation it is not easy to obtain the null distribution of the likeli-hood ratio statistic. Under some regularity conditions Self and Liang [1], Stram and Lee [2] and Liang and Self [3] proved that the likelihood ratio statistic followed a 0.50:0.50 mixture of χ20 and χ21, whereχ20 is a point mass at zero and χ2
1 is a chi-square distribution with one de-gree of freedom. Whereas Crainiceanu and Ruppert [8] ar-gued that the assumed conditions in these papers were often not guaranteed in practice, they showed the mixture proportion parameter is actually dependent on specific contexts and the equal-weight mixture can lead to conser-vative type I error control. To obtain the null distribution of the likelihood ratio test (LRT) statistic, Crainiceanu and Ruppert [8] developed a simulation-based algorithm using the spectral representation of the LRT statistic.
Instead of using the equal-weight mixture as done in Self and Liang [1] and Liang and Self [3], Pinheiro and Bates [13] found that a nonequal-weight one may be bet-ter and suggested the 0.65:0.35 mixture for some specific longitudinal datasets. Fitzmaurice, et al. [14] evaluated the 0.50:0.50 and 0.65:0.35 mixtures via simulations and concluded that the appropriate mixture is not straight-forward to derive.
The work aforementioned shows clearly that it is diffi-cult to obtain an analytical expression for the null distribu-tion of the likelihood ratio statistic. On the other hand, when encountering complex hypothesis testing scenarios in practical data analyses, resorting to resampling-based methods is a very natural and effective strategy. Faraway
[15] and Samuh, et al. [16] applied the parametric boot-strap approach for testing the variance component. Lee and Braun [17] and Samuh, et al. [16] used the permuta-tion procedure to resolve this problem. Their results dem-onstrated that the bootstrap and permutation tests can control the type I error rate correctly and are more power-ful compared to the tests that are based on the usual asymptotic mixture.
LRT for variance component in GLMM
At present most of the work concerning the likelihood-ratio based variance component test has been mainly in-vestigated under the context of linear mixed models (LMM), in which the response variable is continuous and the closed-form log-likelihood function is easily ob-tained and calculated [18,19]. However, little literature has been published about LRT of variance component in the generalized linear mixed models (GLMM) frame-work [20,21], where the response variable is discrete, such as the binary or count variable, and the calculation of the log-likelihood function is not straightforward.
The difficulty of performing the likelihood ratio vari-ance component test in GLMM arises in several aspects: (i) unlike in LMM for the continuous data, the closed-form log-likelihood function of GLMM can be no longer yielded except in some extremely limited situations, thus the computation of the likelihood ratio statistic is not easy; (ii) the exact parameter estimation in GLMM is often impossible because of the need of high-dimensional nu-merical integration; (iii) the null distribution of the like-lihood ratio statistic in GLMM is complicated, and similar to the case in LMM it cannot be obtained analytically.
Lee and Braun [17] mentioned in their Discussion Sec-tion that the permutaSec-tion test can be applied to the problem of testing for variance components in GLMM, but did not formally give any further results to date. Fitzmaurice, et al. [14] investigated the permutation vari-ance component test in GLMM to detect the cluster effect in a multilevel binary dataset and showed that the permu-tation test can effectively control the type I error rate and has a higher power compared with the tests based on the asymptotic mixture of chi-square distributions.
A motivating application for the variance component test in GLMM
In this paper we attempt to perform the likelihood ratio variance component test in GLMM via the permutation procedure. To present the permutation-based LRT, we now give an example motivating from genetic statistics concerning multilocus association analyses in case– con-trol studies. One of the main objectives in genetic asso-ciation studies is to identify the causal markers (e.g., single nucleotide polymorphisms, SNPs) that are signifi-cantly related to diseases. Two commonly used methods in genome-wide association studies are respectively sin-gle marker analysis and multiple markers analysis [26]. Compared with the single marker analysis, the multiple markers analysis is generally more powerful since some useful information among markers is taken into account. More specifically, suppose that in multilocus association analysesKSNPs within a functional gene are grouped into an SNP set. The objective is to test whether theseKSNPs are jointly associated with the disease of interest, say y. Here we assume y is a binary variable. If the number of SNPs (i.e.,K) is small, we can perform traditional fixed ef-fects model and test to achieve this aim; however, if the number of SNPs is large, the traditional test such as the Wald test or the score test is typically underpowered for the null due to the large number of degrees of freedom, and the fixed effects model may be subject to some nu-merical issues, e.g., the problem of multicollinearity since the SNPs within a gene may be highly correlated due to the linkage disequilibrium.
As an effective alternative, if the effects of SNPs are as-sumed to be random with a common variance component [27], then the fixed effects model becomes the mixed ef-fects model and the test is converted into the variance component test under the framework of GLMM (i.e., the logistic mixed effects model). And now the numerical problems encountered in the fixed effects model men-tioned above can be avoided because of the use of mixed effects model [27-31].
It should be emphasized that our main objective is fo-cused on the hypothesis testing of variance component in GLMM instead of the parameter estimation. In this paper we attempt to explore the application of LRT in logistic mixed effects model based on the well-developed theories for GLMM.
The organization of this paper is given as follows. The likelihood ratio statistic is constructed by taking full of the working response generated in the estimation process of GLMM. To circumvent the derivation of the analytical expression for the null distribution of the like-lihood ratio statistic, we use the permutation procedure. We implement simulation studies to evaluate the per-formance of the proposed permutation-based LRT in the context of genetic association studies. Finally we apply
the proposed LRT to multilocus association analysis for the binary genetic data.
Methods
Logistic mixed effects model and the variance component test
LetX= [X0,X1,…,Xp] andZ= [Z1,Z2,…,ZK] ben× (p +
1) and n×K matrices for covariates, respectively, where X0= 1 corresponds to the intercept term, n is the total
sample size; and lety= [y1, y2,…, yn]’be an-dimensional
vector for a binary response variable coded as 0 and 1, such as y = 0 for the control and y = 1 for the case in case–control studies. Assume the relationship betweeny,
XandZis characterized via the following logistic model
μ ¼ Eð Þy ;log
ð
1 μ− μÞ
¼ X
p
j ¼ 0
Xjαj þ XK
k ¼ 1
Zkβk
¼ Xα þ Zβ; βk e N 0; τ2
;
ð1Þ
whereα= [α0,α1,…,αp] are considered as fixed effects,
while β= [β1, β2, …, βK] are considered as random
ef-fects following a normal distribution with mean zero and variance componentτ2. Under these settings model (1) becomes the logistic mixed effects model which has been widely studied in the literature [20,21,32,33]. Our aim is to testβs simultaneously to determine the overall significance of variablesZ. Based on these specifications, the test of β= 0 is immediately equivalent to the test of variance componentH0:τ2= 0 in model (1).
Note that model (1) is different from the one consid-ered by Fitzmaurice, et al. [14] and Sinha [25], in which only one random effect was included so that the approx-imated calculation of the log-likelihood function via nu-merical integration was feasible; whereas in model (1) there areKrandom effects with the same variance com-ponent and the calculation of the log-likelihood function via numerical integration is generally not possible [21].
Definition of the likelihood ratio statistic
A lot of algorithms have been developed for estimating GLMM, including approximate approaches and Monte Carlo methods [20,21,34]. Here we use the penalized quasi-likelihood (PQL) algorithm [20,34] since it has the conceptual and computational advantage compared to others and can be implemented via existing software, such as the glmmPQL function in the R package MASS [35].
We build LRT for the null of H0: τ2= 0 in model (1)
distinguish the original response variable y, generated after the convergence of PQL algorithm
Y′ ¼ Xα þ Zβ þ e; β
e N0; τ2; eeNð0; RÞ; ð2Þ
where Ris a n×n diagonal matrix with elements being 1/[μ(1-μ)]. Following Breslow and Clayton [20], the cor-responding quasi log-likelihood up an unrelated con-stant for the working response variableY’is
L τ2 ≈ −1
2 logj j þV Y
′ −Xα^
′
V−1Y′ −Xα^
h i
;
ð3Þ
with V = τ2ZZ′ + R and α^ ¼ X′V−1X−1X′V−1Y′: By carefully inspecting we can easily find that Formula (3) is actually the log-likelihood function of LMM with residual termεand random effectsβifY’is treated as a continuous response variable. Based on the log-likelihood given in (3), the log-likelihood ratio statistic for H0:τ2= 0 can be defined as
T ¼ 2 supτ2 ≥ 0L τ2 − L τ2 ¼ 0
: ð4Þ
Here we have some remarks about the LRT statistic given in (4): (i) we calculateTvia the working response variableY’instead of the original response variabley; (ii) for fair comparisons, the log-likelihood of the null model, i.e., the value of L(τ2= 0), is also calculated ac-cording to the quasi log-likelihood, although the null model with τ2= 0 reduces to the general logistic regression whose log-likelihood can be computed dir-ectly; in fact we find that negative values of the likeli-hood ratio statistic are obtained if the log-likelilikeli-hood of the reduced logistic regression is adopted; more import-antly, we indeed do not see any problems with the use of Formula (4) to compute the likelihood ratio statistic in our simulations; (iii) here we only consider LRT, although the restricted likelihood ratio test [8-10] can be also ap-plied; the difference between the two likelihood ratio tests is generally ignorable as the sample size increases.
Resampling algorithm for the null distribution ofT
To obtain the null distribution of the likelihood ratio statistic T, we now use the permutation procedure [36-38]. The more general resampling algorithm is de-scribed as follows.
Resampling algorithm for the null distribution of T
step1: Calculate the observed value ofTaccording to (4) using the original dataD= [y,X,Z], sayTobs;
step2: Generate a new datasetD*by resampling;
step3: Calculate the new value ofTaccording to (4) usingD*, sayT*;
step4: Repeat the steps 2–3 aboveBtimes, getT*b,
b= 1, 2,…,B;
step5: The resampling-based null distribution ofTcan be approximated byT*b, and the Monte Carlo p value ofTis estimated by the proportion ofT*bequal to or greater thanTobs.
In step 2 of the resampling algorithm, if we randomly permuteyandXas a whole while keepingZfixed, then we are performing the permutation test [14,38]. Here we implicitly assume that no correlation between X and Z exists. If we only generate the new response variable y (sayy*) from the fitted null model (i.e., the fixed effects logistic model with only covariates X) while letting both
X and Z unchanged, then we are performing the para-metric bootstrap test [15,16,25,36,37]. The permutation and bootstrap algorithms are almost the same except the production of the new resampling dataset in the second step. In this paper we only discuss the permutation test since it requires fewer assumptions compared with the parametric bootstrap test.
Usually, the number of replicatesBin the permutation test is set to 1000 ~ 2000 for a relatively large signifi-cance level, say α= 0.05. Whereas some authors [14,16] empirically found that much smaller values of B (e.g., 200 or 500) could also behave satisfactorily.
Simulation study and real application
In this section we implemented simulation studies to evaluate the proposed permutation-based LRT method and then applied it to the real genetic data. The simula-tion data was generated via the following logistic model
log Eð Þy 1 − Eð Þy
¼ −ð1 þ 0:5X1 þ 0:5X2Þ
þ XK
k ¼ 1
Zkβk;
ð5Þ
where X1 is a binary variable with a probability of 0.5
andX2is a standard normal variable, and they are
mutu-ally independent. To correspond to the motivating ex-ample of multilocus association studies described before and to mimic the true genetic data, in this paper we use the additive genetic model so that Z= 0, 1 and 2 repre-sents the count of the minor allele [31].
reference in some cases [8,14], thus it is still consid-ered here. The score variance component tests in mixed effects models have been previously investigated by many authors in a wide range of application areas [22,23,28-31,39]; these score tests share a very similar rationale to each other. In this paper we use the score test originally developed by Lin [22], which was later applied and called sequence kernel association test (SKAT) by Wu, et al. [31] under the context of rare variants association in sequencing data and is imple-mented in the R package SKAT (version 0.91) [40]. All the data analyses are performed within the R (version 2.15.3) statistical environment [41].
The sample size was set to 400, 600, 800 and 1000. The value of B in the permutation-based LRT was 1000. The number of simulations was 2000 for con-trolling the type I error rate and was 1000 for evaluat-ing the statistical power. The estimated type I error rate and power were calculated as the proportion of the p-values less than the given significance level α= 0.05.
Simulation 1
We first evaluated the type I error and power of the pro-posed LRT in the context of multilocus association ana-lyses with different number of SNPs and various random effects variance component. To obtain Z = [Z1, Z2, . . .,
ZK], we first generated G = [G1, G2, . . ., GK] via the
standard normal distribution with pairwise correlation betweenGkand Gk’to be 0.5|k-k’|, and then setZk= 0, 1 and 2 according to whether Gk<−c,−c≤Gk≤corGk> c, where c is the third quartile of the standard normal distribution. We set K= 20, 30 and 40, and β= 0 in model (5) for the type I error simulation and sampledβ from a normal distribution with mean zero and variance τ2
= 0.15 and 0.20 for the power evaluation. The results are given in Tables 1 and 2.
Simulation 2
This simulation is mainly designed to see the influence of non-normally distributed random effects in multilo-cus association studies. Here the variable Z in model (5) was generated via the software COSI [42] based on a co-alescent model for European population. Specifically, we first generated a long region with COSI, from which a continuous subregion was selected so that it contained a reasonable number of SNPs; next this subregion was treated as a gene, whose genotypes were specified toZ, i.e., the SNPs included in this subregion are modeled by variables Z. The average number of SNPs included in the simulation is given in Table 3. Usually, not all of the SNPs (i.e., Z) within a gene are causal [31], thus some of them were assumed to have zero effects; i.e., only m out of KSNPs had an impact on the response
variable y in model (5). Here we setm= 0K, 0.1K, 0.3K and 0.5K. The effectsβwere generated from the uniform distributionU[0.60, 1.10] at random. The results are given in Table 3.
Data analysis
We applied the permutation-based LRT to the well-known Genetic Analysis Workshop 17 (GAW17) mini-exome sequencing data [43], which was con-structed based on the 1000 Genomes Project [44]. The GAW17 data contain a binary response variable calledaffection status (say y here, and y = 1 represent-ing affection and y = 0 representrepresent-ing non-affection) and five covariates including age (X1, a continuous
vari-able), smoking status(X2, an indicator variable
represent-ing smokrepresent-ing or non-smokrepresent-ing), and three continuous variablesQ1, Q2andQ4. The number of individuals is
697. The details of this data were described in Almasy, et al. [43]. We implemented multilocus association analysis for four genes ELAVL4, PRKCB1, PTK2B and SOS2 across all the 200 replicates of the GAW17 data.
The logistic mixed effects model for the GAW17 data is written as
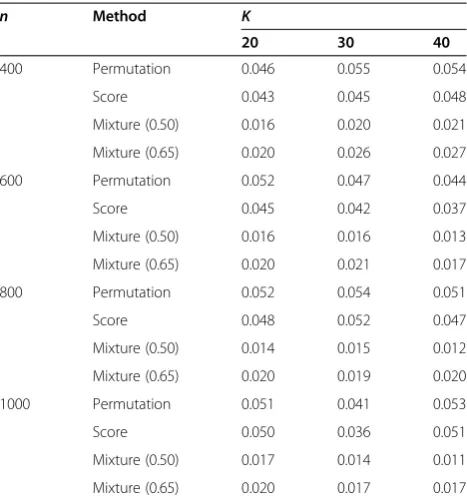
Table 1 Estimated type I error rates for simulation 1 with varying number of random effects
n Method K
20 30 40
400 Permutation 0.046 0.055 0.054
Score 0.043 0.045 0.048
Mixture (0.50) 0.016 0.020 0.021
Mixture (0.65) 0.020 0.026 0.027
600 Permutation 0.052 0.047 0.044
Score 0.045 0.042 0.037
Mixture (0.50) 0.016 0.016 0.013
Mixture (0.65) 0.020 0.021 0.017
800 Permutation 0.052 0.054 0.051
Score 0.048 0.052 0.047
Mixture (0.50) 0.014 0.015 0.012
Mixture (0.65) 0.020 0.019 0.020
1000 Permutation 0.051 0.041 0.053
Score 0.050 0.036 0.051
Mixture (0.50) 0.017 0.014 0.011
Mixture (0.65) 0.020 0.017 0.017
Note:Permutation is the proposed permutation-based LRT, Score is the
log Eð Þy 1 ‐ Eð Þy
¼ α0 þ α1 X1 þ α2 X2 þ α3 Q1 þ α4 Q2
þ α5 Q4 þ XK
k ¼ 1
Zkβk;
βk e Nð0; τ2Þ;
ð6Þ
hereZ is the genotype of the selected gene, andα0-α5
are set to be fixed effects while β are set to be random effects. Our interest is to testH0:τ2= 0 in model (6) to
determine whether a given gene is associated with affec-tion status. Since in this data we know which SNPs are causal, the proportion of p-values less than the given sig-nificance level provides a measurement of the empirical power for these methods. The results are given in Table 4.
To reduce computation time of the permutation-based LRT, the simulations and data analyses were conducted with the high performance computing at the School of Public Health of Nanjing Medical University. More spe-cifically, we use the function %dopar% in the R package doMC (version 1.3.3) [45] with the function register-DoMC having its argument cores = 30 for parallel
execution when implementing the permutation proced-ure. Our experience showed that this parallel execution could substantially reduce the computation compared to the use of the simple R for-loop.
Results
From Table 1 it is observed that the type I error rate of the permutation-based LRT is very close to the nominal significance level 0.05 at various situations. On the other hand, the score test is sometimes slightly conservative, especially when the sample size is relatively small (e.g., 400 and 600); the two tests respectively based on the 0.50:0.50 and 0.65:0.35 mixtures cannot control the type I error rate correctly regardless of the sample size and the number of random effects, and are much more con-servative than the score test.
Table 2 shows that the permutation-based LRT is the most powerful method among these tests and the score test has higher power compared to the tests based on mixtures. Typically, as expected the powers of these tests improve as the sample size increases and the number of random effects becomes larger. In Simulation 1 as the sample size improves, the powers of the LRT and the score test approach each other. Here an interesting
Table 3 Estimated powers for Simulation 2 with different proportion of the causal markers
n Method K Power with variousm
0K 0.1K 0.3K 0.5K
400 Permutation 46 0.052 0.112 0.252 0.402
Score 0.046 0.103 0.241 0.396
Mixture (0.50) 0.042 0.096 0.226 0.371
Mixture (0.65) 0.066 0.130 0.262 0.414
600 Permutation 54 0.053 0.138 0.361 0.583
Score 0.046 0.125 0.345 0.576
Mixture (0.50) 0.046 0.121 0.329 0.550
Mixture (0.65) 0.063 0.153 0.388 0.604
800 Permutation 60 0.049 0.181 0.446 0.707
Score 0.040 0.173 0.425 0.685
Mixture (0.50) 0.039 0.149 0.406 0.669
Mixture (0.65) 0.057 0.192 0.471 0.721
1000 Permutation 65 0.051 0.181 0.528 0.754
Score 0.046 0.178 0.513 0.746
Mixture (0.50) 0.040 0.159 0.492 0.727
Mixture (0.65) 0.057 0.193 0.552 0.773
Note:Permutation is the proposed permutation-based LRT, Score is the
score-based sequence kernel association test given in Wu, et al. [31] that was originally developed in Lin (1997), Mixture (0.50) and Mixture (0.65) respectively correspond to the asymptotic 0.50:0.50 and 0.65:035 mixtures of chi-square distributions. HereKis the number of random effects, i.e., the number of SNPs included in a gene, andmis the number of causal SNPs; whenm= 0 (i.e., corresponding to 0Kin the fourth column), the estimated power is actually the type I error rate.
Table 2 Estimated powers for Simulation 1 with the random effects variance component equal to 0.15 and 0.20 and varying number of random effects
n Method Kwithτ2=0.15 Kwithτ2=0.20
20 30 40 20 30 40
400 Permutation 0.296 0.380 0.433 0.506 0.577 0.704
Score 0.276 0.363 0.402 0.501 0.557 0.689
Mixture (0.50) 0.158 0.235 0.282 0.349 0.441 0.567
Mixture (0.65) 0.187 0.269 0.318 0.393 0.476 0.615
600 Permutation 0.436 0.566 0.630 0.712 0.837 0.878
Score 0.430 0.548 0.604 0.704 0.816 0.868
Mixture (0.50) 0.255 0.382 0.463 0.538 0.686 0.794
Mixture (0.65) 0.292 0.437 0.501 0.589 0.717 0.826
800 Permutation 0.559 0.704 0.777 0.840 0.922 0.951
Score 0.557 0.702 0.771 0.830 0.917 0.948
Mixture (0.50) 0.380 0.526 0.642 0.727 0.851 0.905
Mixture (0.65) 0.427 0.573 0.682 0.765 0.873 0.922
1000 Permutation 0.688 0.792 0.865 0.913 0.950 0.987
Score 0.679 0.787 0.864 0.909 0.949 0.983
Mixture (0.50) 0.517 0.637 0.774 0.828 0.914 0.966
Mixture (0.65) 0.562 0.677 0.801 0.852 0.926 0.970
Note:Permutation is the proposed permutation-based LRT, Score is the
score-based sequence kernel association test given in Wu, et al. [31] that was originally developed in Lin (1997), Mixture (0.50) and Mixture (0.65) respectively correspond to the asymptotic 0.50:0.50 and 0.65:035 mixtures of chi-square distributions. HereKis the number of random effects, i.e., the number of SNPs included in a gene, andτ2
finding in Table 2 is that the magnitude of the random effects variance componentτ2has a greater influence on the statistical power for these tests than the number of random effects (i.e.,K). For example, in Table 2 whenK becomes from 20 to 40 and τ2=0.15, the increasing power for LRT is 0.137; when K= 20 and τ2 increases from 0.15 to 0.20, the corresponding change of power of LRT is 0.210.
In Table 3 for Simulation 2 where the random effects are not normally distributed, as before the permutation test holds the type I error rate effectively while the score test is slightly conservative and the tests based mixtures give incorrect control. For instance, the type I error rate estimated from the 0.50:0.50 mixture is conservative and the type I error rate from the 0.65:0.35 mixture is liberal, and the incorrect control of the two mixtures does not improve with the increasing sample size. The power of the permutation-based LRT is higher than that obtained from the 0.50:0.50 mixture and lower than that obtained from the 0.65:0.35 mixture. But here only the results of the LRT are valid and believable because the two mix-tures cannot correctly control the type I error rate as demonstrated.
In general, as expected the powers of these tests im-prove as the proportion of causal markers increases. In
Table 3 we find that the permutation-based LRT always outperforms the score test even when the sample size is large (e.g., 1000 and 800). In conclusion in this simula-tion we see that the proposed LRT can maintain a rea-sonably higher power than the score test even if the distribution of random effects is not normal.
From Table 4 we can see that the permutation-based LRT has higher chance to detect the causal genes com-pared the other three methods. Here it is somewhat sur-prising that the score test is extremely underpowered and has the lowest probability to identify the associated genes. For example, when the significance level is 0.001 the chance that these four genes are deemed to be statis-tically related to the disease status by the score test is less than 5%; relatively, the LRT has a much larger prob-ability than the score test.
As a reviewer pointed out that, in fact, the GAW17 data are not purely real data but rather 200 replicates, which were simulated independently based on the true genotype-phenotype association model with the same genotypes but different phenotypes. Therefore, it may be limited for evaluating the performance of these tests. Nevertheless, according to the results presented in Table 4, it seems to be reasonable to conclude that the proposed permutation-based LRT has an empirical ad-vantage to identify association signals compared with other competing tests.
Discussion
In this paper we have applied the LRT to GLMM by tak-ing full use of the PQL algorithm and the resulttak-ing working response variable. The main difficulties of using LRT in GLMM are the computation of the log-likelihood function for the alternative model (e.g., the lo-gistic mixed effects model) and the derivation of the null distribution of the likelihood ratio statistic. To avoid the direct computation we use the quasi log-likelihood of the working response, which can be deemed to be linear. By doing this the LRT in GLMM becomes computationally feasible. To obtain the null distribution of LRT we use the permutation procedure which has been extensively employed in practice and has proved to be valid [14,17,38]. In the present paper we only consider the permutation test for the likelihood inference, but extending to other resampling-based methods is straightforward; for ex-ample, the parametric bootstrap method. Still the per-mutation test has an advantage that it requires few model assumptions compared to other resampling-based methods [14,17,38]. Via simulations it has been shown that the permutation-based LRT can effectively control the type I error rate under different situations. Similar to the results demonstrated by others [8,14,17], the usually-used asymptotic mixture distributions such as the 0.50:0.50 and 0.65:0.35 mixtures cannot maintain the
Table 4 Results of the four genes in GAW17 data
Gene Method K m The significance levelα
0.05 0.01 0.001
ELAVL4 Permutation 10 2 0.725 0.630 0.395
Score 0.450 0.240 0.040
Mixture (0.50) 0.640 0.485 0.335
Mixture (0.65) 0.690 0.540 0.360
PTK2B Permutation 18 3 0.600 0.470 0.290
Score 0.085 0.030 0.000
Mixture (0.50) 0.515 0.355 0.245
Mixture (0.65) 0.540 0.405 0.255
PRKCB1 Permutation 20 1 0.550 0.355 0.255
Score 0.095 0.030 0.005
Mixture (0.50) 0.430 0.305 0.220
Mixture (0.65) 0.465 0.315 0.225 SOS2 Permutation 9 2 0.545 0.400 0.235
Score 0.160 0.030 0.005
Mixture (0.50) 0.420 0.285 0.165
Mixture (0.65) 0.450 0.325 0.185
Note:Permutation is the proposed permutation-based LRT, Score is the
type I error rate correctly at the nominal significance level. The simulations show that the score test can con-trol the type I error rate but is sometimes conservative, especially for small sample sizes; the similar result has also been observed by Wu, et al. [31] and Li, et al. [46] under the context of multilocus association studies.
Our studies have shown that the permutation-based LRT has higher power than the score test and the tests based on mixtures under a wide range of scenarios and it still maintains a reasonably high power even when the random effects do not follow a normal distribution. The LRT has the advantage that it is conceptually simple and easy to implement, but the permutation-based LRT is computationally intensive. However, as Lee and Braun [17] pointed out that the computation burden can be re-duced significantly via parallel computing; additionally, some approximation methods suggested in linear mixed effects models may be applied [8,12]. In contrast, the tests based on mixtures are relatively rapid since they do not require resampling, and the score test is the most computationally efficient since it only needs to fit the null model and its null distribution can be obtained analytically [22-24]. Another advantage of the score test is that its statistic is calculated much more straightfor-ward [22-24].
The computation time for the permutation-based LRT depends on the sample size, the number of random ef-fects and the number of replicatesBin the permutation algorithm. Although having been performed the parallel computation, we still find that the permutation-based LRT is much slower than other methods, especially than the score test. For example, in Simulation 1 when the sample size is 400 and B= 1000 in the permutation-based LRT, running one simulation requires respectively 975 s, 702 s and 1217 s ifK= 20, 30 and 40; whereas the score test only needs about 16 s, 23 s and 30 s if running ten simulations. All the times are obtained via the use of the function %dopar% as mentioned before.
Besides the increasing computational burden of the permutation-based LRT, another disadvantage is that the LRT may be numerically unstable to fit the alternative model when the sample size is limited and the number of the random effects is large. The third shortcoming of the LRT is that its validity and efficiency rely largely on the PQL algorithm, which had been already proved to be seriously biased downward [20,22,47,48]. Although no negative effect on the type I error controlling is observed in our simulations, certainly it can result in power re-duction due to the biased estimation. Therefore, designing more efficient and faster algorithms for the proposed LRT is necessary in the future, and developing likelihood-ratio based variance component tests in GLMM with the bias-corrected PQL estimation is another interest-ing problem.
Finally, we note in Table 4 for GAW17 data analysis that the overall power for these methods compared in this paper is very low. For example, if we set the signifi-cance level at 0.001, none of these methods has an em-pirical power greater than 0.50. The reasons may be that: (i) the effects of the markers are very weak; (ii) the non-causal SNPs included in the gene lead to the reduc-tion of power; that is, not all the random effects have nonzero coefficients; (iii) the sample size is relatively small for identifying the association signal; (iv) in the GAW17 data most of the SNPs are rare variants, i.e., their minor allele frequencies are very low and typically less than 0.01 [43], which are known to have an ex-tremely limited power to be detected [31,49]. These re-sults also suggest that developing more powerful methods for the low-frequency variants in case–control sequence data is an urgent demand [31,50-52].
Conclusions
In the present paper the permutation-based LRT was de-veloped for variance component in GLMM. Via simula-tions and real application it has been demonstrated that the developed LRT method outperforms the existing tests and has a reasonably high power under various sce-narios; additionally it is conceptually simple and easy to implement.
Abbreviations
LRT:Likelihood ratio test; GLMM: Generalized linear mixed model; LMM: Linear mixed model; GWAS: Genome-wide association study; PQL: Penalized quasi-likelihood; GAW17: Genetic analysis workshop 17; SNP: Single nucleotide polymorphism.
Competing interests
The authors declare that they have no competing interests.
Authors’contributions
PZ and FC conceived and conducted the study, and PZ drafted the manuscript. YZ and TW participated in the design and data generation. PZ and HL conducted the simulation and interpretation of the analyses. All the authors read and approved the final manuscript.
Acknowledgements
Author details
1
Department of Epidemiology and Biostatistics, School of Public Health, Nanjing Medical University, Nanjing 211166, Jiangsu, People’s Republic of China. 2
Department of Epidemiology and Biostatistics, Center of Medical Statistics and Data Analysis, School of Public Health, Xuzhou Medical College, Xuzhou 221004Jiangsu, People’s Republic of China.3Center for Disease Control and Prevention of Pudong New Area, Pudong New Area, Shanghai 200136, People’s Republic of China.
Received: 4 December 2014 Accepted: 7 April 2015
References
1. Self SG, Liang KY. Asymptotic properties of maximum likelihood estimators and likelihood ratio tests under nonstandard conditions. J Roy Stat Soc B. 1987;82(398):605–10.
2. Stram DO, Lee JW. Variance components testing in the longitudinal mixed effects model. Biometrics. 1994;50(4):1171–7.
3. Liang KY, Self SG. On the asymptotic behaviour of the pseudolikelihood ratio test statistic. J Roy Stat Soc B. 1996;58(4):785–96.
4. Lindquist MA, Spicer J, Asllani I, Wager TD. Estimating and testing variance components in a multi-level GLM. Neuroimage. 2012;59(1):490–501. 5. Drikvandi R, Verbeke G, Khodadadi A, Partovi Nia V. Testing multiple variance components in linear mixed-effects models. Biostatistics. 2013;14(1):144–59.
6. Nobre J, Singer J, Sen P. U-tests for variance components in linear mixed models. TEST. 2013;22(4):580–605.
7. Claeskens G. Restricted likelihood ratio lack-of-fit tests using mixed spline models. J Roy Stat Soc B. 2004;66(4):909–26.
8. Crainiceanu CM, Ruppert D. Likelihood ratio tests in linear mixed models with one variance component. J Roy Stat Soc B. 2004;66(1):165–85. 9. Crainiceanu CM, Ruppert D. Restricted likelihood ratio tests in
nonparametric longitudinal models. Stat Sinica. 2004;14(3):713–30. 10. Crainiceanu CM, Ruppert D. Likelihood ratio tests for goodness-of-fit of a
nonlinear regression model. J Multivariate Anal. 2004;91(1):35–52. 11. Crainiceanu C, Ruppert D, Claeskens G, Wand MP. Exact likelihood ratio tests
for penalised splines. Biometrika. 2005;92(1):91–103.
12. Greven S, Crainiceanu CM, Küchenhoff H, Peters A. Restricted likelihood ratio testing for zero variance components in linear mixed models. J Comput Graph Stat. 2008;17(4):870–91.
13. Pinheiro JC, Bates D. Mixed-effects models in S and S-PLUS. 2nd ed. New York: Springer; 2009.
14. Fitzmaurice GM, Lipsitz SR, Ibrahim JG. A note on permutation tests for variance components in multilevel generalized linear mixed models. Biometrics. 2007;63(3):942–6.
15. Faraway JJ. Extending the linear model with R: generalized linear, mixed effects and nonparametric regression models. New York: Chapman & Hall/ CRC; 2005.
16. Samuh MH, Grilli L, Rampichini C, Salmaso L, Lunardon N. The use of permutation tests for variance components in linear mixed models. Commun Stat-Theor M. 2012;41(16–17):3020–9.
17. Lee OE, Braun TM. Permutation tests for random effects in linear mixed models. Biometrics. 2012;68(2):486–93.
18. Verbeke G, Molenberghs G. Linear mixed models for longitudinal data. New York: Springer; 2009.
19. Laird NM, Ware JH. Random-effects models for longitudinal data. Biometrics. 1982;38(4):963–74.
20. Breslow N, Clayton D. Approximate inference in generalized linear mixed models. J Am Stat Assoc. 1993;88(421):9–25.
21. Diggle P, Heagerty P, Liang KY, Zeger S. Analysis of longitudinal data. 2nd ed. New York: Oxford University Press; 2002.
22. Lin X. Variance component testing in generalised linear models with random effects. Biometrika. 1997;84(2):309–26.
23. Zhang D, Lin X. Hypothesis testing in semiparametric additive mixed models. Biostatistics. 2003;4(1):57–74.
24. Lin X, Zhang D. Inference in generalized additive mixed models by using smoothing splines. J Roy Stat Soc B. 1999;61(2):381–400.
25. Sinha SK. Bootstrap tests for variance components in generalized linear mixed models. Can J Stat. 2009;37(2):219–34.
26. Balding D. A tutorial on statistical methods for population association studies. Nat Rev Genet. 2006;7(10):781–91.
27. Zeng P, Zhao Y, Liu J, Liu L, Zhang L, Wang T, et al. Likelihood ratio tests in rare variant detection for continuous phenotypes. Ann Hum Genet. 2014;78(5):320–32.
28. Tzeng J, Zhang D. Haplotype-based association analysis via variance-components score test. Am J Hum Genet. 2007;81(5):927–38.
29. Kwee L, Liu D, Lin X, Ghosh D, Epstein M. A powerful and flexible multilocus association test for quantitative traits. Am J Hum Genet. 2008;82(2):386–97. 30. Wu MC, Kraft P, Epstein MP, Taylor DM, Chanock SJ, Hunter DJ, et al.
Powerful SNP-set analysis for case–control genome-wide association studies. Am J Hum Genet. 2010;86(6):929–42.
31. Wu MC, Lee S, Cai T, Li Y, Boehnke M, Lin X. Rare-variant association testing for sequencing data with the sequence kernel association test. Am J Hum Genet. 2011;89(1):82–93.
32. Molenberghs G, Verbeke G. Models for discrete longitudinal data. New York: Springer; 2005.
33. Fitzmaurice GM, Laird NM, Ware JH. Applied longitudinal analysis. New York: John Wiley & Sons; 2004.
34. Wolfinger R, O’Connell M. Generalized linear mixed models a pseudo-likelihood approach. J Stat Comput Sim. 1993;48(3–4):233–43.
35. Venables WN, Ripley BD. Modern applied statistics with S. 4th ed. New York: Springer; 2002.
36. Davison AC, Hinkley DV. Bootstrap methods and their application. Cambridge: Cambridge University Press; 1997.
37. Efron B, Tibshirani R. An introduction to the bootstrap. New York: Chapman & Hall/CRC; 1993.
38. Good P. Permutation, parametric, and bootstrap tests of hypotheses. 3rd ed. New York: Springer; 2005.
39. Goeman JJ, van de Geer SA, de Kort F, van Houwelingen HC. A global test for groups of genes: testing association with a clinical outcome. Bioinformatics. 2004;20(1):93–9.
40. Lee S, Miropolsky L, Wu M. SKAT: SNP-set (Sequence) kernel association test. R package version 0.91. 2013. URL http://CRAN.R-project.org/package=SKAT. 41. R Core Team. R: a language and environment for statistical computing.
Vienna, Austria: R Foundation for Statistical Computing; 2013. URL http:// www.R-project.org/.
42. Schaffner SF, Foo C, Gabriel S, Reich D, Daly MJ, Altshuler D. Calibrating a coalescent simulation of human genome sequence variation. Genome Res. 2005;15(11):1576–83.
43. Almasy L, Dyer T, Peralta J, Kent J, Charlesworth J, Curran J, et al. Genetic analysis workshop 17 mini-exome simulation. BMC Proc. 2011;5 Suppl 9:S2. 44. The 1000 Genomes Project Consortium. A map of human genome variation
from population-scale sequencing. Nature. 2010;467(7319):1061–73. 45. Revolution Analytics. doMC: Foreach parallel adaptor for the multicore
package. R package version 1.3.3. 2014. URL http://CRAN.R-project.org/ package=doMC.
46. Li M, He Z, Zhang M, Zhan X, Wei C, Elston RC, et al. A generalized genetic random field method for the genetic association analysis of sequencing data. Genet Epidemiol. 2014;38(3):242–53.
47. Breslow NE, Lin X. Bias correction in generalised linear mixed models with a single component of dispersion. Biometrika. 1995;82(1):81–91.
48. Lin X, Breslow NE. Bias correction in generalized linear mixed models with multiple components of dispersion. J Am Stat Assoc. 1996;91(435):1007–16. 49. Bansal V, Libiger O, Torkamani A, Schork NJ. Statistical analysis strategies for association studies involving rare variants. Nat Rev Genet. 2010;11(11):773–85. 50. Lee S, Abecasis Gonçalo R, Boehnke M, Lin X. Rare-variant association
analysis: study designs and statistical tests. Am J Hum Genet. 2014;95(1):5–23. 51. Moutsianas L, Morris AP. Methodology for the analysis of rare genetic
variation in genome-wide association and re-sequencing studies of complex human traits. Brief Funct Genomics. 2014. doi: 10.1093/bfgp/elu012. 52. Derkach A, Lawless JF, Sun L. Pooled association tests for rare genetic