http://www.sciencepublishinggroup.com/j/ajpa doi: 10.11648/j.ajpa.20180604.13
ISSN: 2330-4286 (Print); ISSN: 2330-4308 (Online)
In vivo
Micro-Tomographic Visualization of Capillary
Angio-Dynamics Around Upper Dermis Under Mechanical
Stimulus Using Low Coherence Interferometer “Optical
Coherence Doppler Velocigraphy”
Daisuke Furukawa
1, *, Souichi Saeki
1, Takafumi Ito
2, Yoshiaki Nishino
21
Mechanical & Physical Engineering, Graduate School of Engineering, Osaka City University, Osaka, Japan
2
Takaoka Toko Co. LTD., Shizuoka, Japan
Email address:
*
Corresponding author
To cite this article:
Daisuke Furukawa, Souichi Saeki, Takafumi Ito, Yoshiaki Nishino. in vivo Micro-Tomographic Visualization of Capillary Angio-Dynamics Around Upper Dermis Under Mechanical Stimulus Using Low Coherence Interferometer “Optical Coherence Doppler Velocigraphy”. American Journal of Physics and Applications. Vol. 6, No. 4, 2018, pp. 89-96. doi: 10.11648/j.ajpa.20180604.13
Received: July 26, 2018; Accepted: August 9, 2018; Published: September 10, 2018
Abstract:
The skin aging process, e.g. wrinkles and sagging, caused by not only aging but also ultraviolet irradiation, could be related to the depression of metabolic function. Therefore, an in vivo quantitative measurement of capillary blood flow velocity governing skin metabolism functionally, i.e. microcirculation, is crucial to clarify the skin aging and to create skincare products. The purpose of this study is to visualize the tomographic velocity of red blood cell in capillaries just below human epidermal skin using Optical Coherence Doppler Velocigraphy, namely OCDV. This was constructed on a low coherence interferometer, which could provide tomographic distribution of flow-modulated Doppler frequency by developing OCDV algorithm of Hilbert transform and adjacent autocorrelation. In order to validate OCDV system, this was in vivo applied to human forearm skin under respective mechanically stimulated conditions of control and avascularization. As a result, a cross-sectional imaging of blood flow velocity was found to display not only morphological OCT images but also networks of capillary vasculature inside dermal tissue. It was confirmed that blood flow velocity further decreased in upper dermis under avascularization than control condition. Additionally, OCDV could provide a velocity map of blood flow having sensitivity to mechanical stimulus, so has strong efficacy to diagnose “Capillary Angio-Dynamics” of skin tissue. In conclusions, OCDV system could be quite useful for a micro-tomographic imaging of blood flow velocity of capillaries inside skin.Keywords:
Optical Coherence Tomography (OCT), Optical Coherence Doppler Venography (OCDV), Microcirculation, Blood Flow Velocity Measurement, Hilbert Transform, Adjacent Auto-Correlation,Flow-Modulated Doppler Frequency, Mechanical Stimulus
1. Introduction
The skin aging process, e.g. wrinkles and sagging [1], caused by not only aging but also ultraviolet irradiation [2], could be related to the metabolic function undermining in skin tissue [3]. The microcirculation system determines skin metabolism, which is consists of the capillary networks, i.e. the smallest blood vessels in the body, as well as lymphatic networks. The capillary vasculature distributes around the depth of about 100 to 200 µm from skin surface, where
Recently, Optical Coherence tomography (OCT) [5, 6] has been developed to visualize in vivo morphological distribution tomographically and non-invasively in the micrometer resolution. So far, Doppler OCT [7] also has been developed subsequently, which can analyze and visualize Doppler frequency modulated by blood flow embedded in the interference signals. However, this has not yet evaluated exhaustively the dermatological relationship between skin mechanics and capillary blood flow velocity inside human skin. Especially, in the vicinity of the upper layer of the dermis, i.e. subepidermal layer, temporal and spatial change of the blood flow velocity as well as the interstitial fluid flow, corresponding to various stimuli, has not been evaluated completely in terms of quantitative
angio-dynamics and biomechanics.
In this study, Optical Coherence Doppler Velocigraphy (OCDV) has been constructed with a single-pass Rapid Scanning Optical Delay line (RSOD) [8]. This system can detect the depth-profile of flow-modulated phase change in axial-scanned interference signals by the collaboration of Hilbert transform [9] and adjacent autocorrelation [10]. OCDV can offer tomographic distribution of flow-modulated Doppler frequency with the micrometer resolution. OCDV was in vivo applied to human forearm skin under respective mechanically stimulated conditions of control and avascularization, so as to validate the present system. Furthermore, temporal and spatial changes in capillary blood flow velocity by mechanical stimulus were evaluated quantitatively.
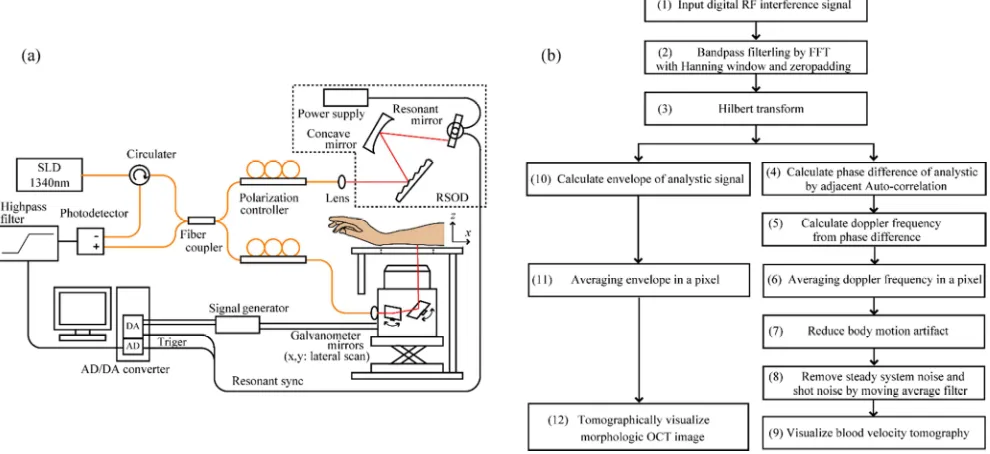
Figure 1. The schematic view (a) and the proposed OCDV algorithm (b) of Optical Coherence Doppler Velocigraphy (OCDV) system with single-pass Rapid Scanning Optical Delay line (RSOD).
2. Optical Coherence Doppler
Velocigraphy
2.1. Optical Coherence Tomography
Optical Coherence Tomography (OCT) can
tomographically visualize tissue morphology with the spatial resolution of 1 to 10 µm by detecting low coherent interference signals of backscattered light from the inside of tissue [11]. Figure 1 (a) shows an example schematic apparatus of Time-Domain OCT system. This is based on the Michelson interferometer with the rapid scanning optical delay line (RSOD) in the reference arm [8]. Light emitted from the low coherence light source is split by a fiber coupler into the reference arm and the object arm, respectively. The respective lights, reflected by the resonant mirror and the backscattered light from the inside of sample, are meet again at the coupler. Low coherent interference signals are generated and detected by the photodetector (PD), only when the difference of optical path length ∆l between the reference
arm lr and the object arm lo, i.e. optical path delay, is less
than the coherence length lc. Axial scanning interference
signals to the depth direction can be obtained by scanning the reference mirror i.e. changing optical path length. The intensity of interference signal Id (z) is a convolution integral
of the coherence function G(z) and distribution of reflection coefficient R(z) inside sample tissue, as shown by the following equation (1) [11, 12].
⨂ cos 2 , (1)
where z is an optical axial coordinate to the depth direction, v is the speed of scanning the optical path delay by a reference mirror, and Iinc is the irradiation intensity distribution to
sample. fRSOD and fd show Doppler frequency modulated by
the scanning motion of a reference mirror and the flow in an objective sample, respectively [8, 12]. The depth resolution ∆z is defined by coherence length lc, which is given
theoretically by the center wavelength λc and wavelength
band width ∆λ of light source as lc = (2ln2/π) (λc 2
if the spectrum of light source has a Gaussian profile [11, 12].
In the reference arm, while a depth-scanner is necessary in Time-Domain OCT, the rapid scanning optical delay line (RSOD) as shown by Figure 1 (a), can separate the optical path length spectrally for each wavelength using a diffracting grating, and focus respective wavelengths on difference positions of reference mirror. In other words, RSOD can maintain the same phase for each wavelength and change the optical path delay by scanning mirror. One of modulated frequency fRSOD is generated by the rotation of scanning
mirror and can also operate as a carrier frequency. In the object arm, a two-axis galvanometer is mounted, and a 3-dimensional tomographic image can be obtained by 2-dimensionally scanning to the horizontal direction of x and y for the beam axis z. The horizontally spatial resolution ∆x and ∆y, corresponding to en face xy plane, is defined by the beam spot diameter ∆Ω as ∆Ω = (4λc/π) (lf /d) = 2∆x [11]. lf
and d are the focal length of the objective lens and the collimate diameter of incident beam to the objective lens, respectively. The imaging depth of field (DOF) is shown as DOF = π∆Ω2/2λc [11].
2.2. OCDV Technique
This paper presents the tomographic detection system of the flow-modulated Doppler frequency fd from RF
interference signals, namely Optical Coherence Doppler Velocigraphy (OCDV). The “velocigraphy” is a coined term combining “velocity” and “tomography” such as “velocimetry”. Figure 1 (b) shows the present algorithm of OCDV technique for detecting Doppler modulation amount. In the following literature, RF interference signal in the depth z direction is described as a function of time Id (t) due to the
continuous acquisition. Short time FFT, used typically in the time-frequency analysis, has the time-frequency trade-off unfortunately, so that the depth-resolution should be deteriorated under the rapid scanning condition [13]. In the present technique, as shown by Figure 1 (b) (1) ~ (3), Hilbert transform is introduced to make it possible to detect the instantaneous frequency continuously [9, 13]. Firstly, the frequency spectrum (f) is calculated by Fast Fourier transform of the acquired RF interference signal Id (t). As
shown by equation (2), Hilbert transform can provide the frequency spectrum (f) phase-shifted by 90 degrees.
−sgn , sgn = # 10 > 0= 0
−1 < 0 (2)
Inverse Fourier transform can drive ((t) and (̂(t) from the mutually orthogonal spectra, i.e. ( f ) and ( f ), hereby the analytic signal Γ(t) = ((t) + i(̂(t) is calculated. Hence, the instantaneous amplitude A(t) = +( , + (̂- , , the instantaneous phase ϕ(t) = arctan1(̂ , /( , 3 and instantaneous frequency fd (t) = (1/2π) (dϕ(t)/dt) can be
derived theoretically from the analytic signal Γ(t). Especially, when RF interference signal has a carrier frequency, ϕ(t) and fd (t) can be detected instantaneously with higher accuracy by
a phase detection method, such as adjacent auto-correlation as the described later. Therefore, flow-modulated Doppler frequency fd (z) can be determined continuously at arbitrary
depth z position. Hilbert transform has no trade-off between the resolution of time and frequency, despite high axial scanning rate, so it can maintain higher accuracy, higher frequency resolution and higher spatial resolution regarding tomographic detection of fd (z) [13]. As shown by Figure 1
(a), in the high frequency band of carrier frequency modulated by the scanning mirror, Hilbert transform is performed so that signal to noise ratio (S/N) can be enhanced to reduce low frequency noise.
The micro flow inside sample tissue modulates the signal frequency, i.e. flow-modulated Doppler frequency fd, then
generates the phase difference between adjacent lines of axial scanning interference signal [10]. Figure 1 (b) (4) ~ (5) shows that fd can be calculated from the detection of phase
change by adjacent auto-correlation (AAC). This technique is applied to adjacent axial lines of interference signal and can derive a change in phase during time interval ∆t at the corresponding depth position. Actually, the respective adjacent analytic signals Γj+1 and Γj, which are obtained by
horizontal scanning in the horizontal x or y direction, can be shown as equation (3).
Γ456 , = (456 , + 7(̂456 ,
= (4 , + ∆9 + 7(̂456 , + ∆9
≈ ; , exp 7 ?2 1 + , 3 , + Δ9 A, (3)
where j is the scanning line number in the horizontal x or y direction. ∆T and A(t) represent the acquisition interval between j and j+1, the intensity of backscattered light, respectively. As evident from the above equation, the phase change ϕd (t) between Γj and Γj+1 is identified as fd (t) ∆T. So,
the depth profile of flow-modulated phase change ϕd (t) can
be obtained by applying AAC to Γj (t) and Γj+1 (t). Especially when flow condition is steady during ∆T, flow-modulated frequency fd (t) can be given by ϕd(t) divided by ∆T. As
shown in the equation (4), the averaged phase change, applying AAC to N pairs of adjacent scanning lines, is used to enhance the detection accuracy of fd (t). The resonant
mirror, which is a sinusoidal scanner, is implemented in the present system shown by Figure 1 (a), so that flow-modulated frequency fd (t) and phase ϕ(t) by the scanning
mirror can be also changed continuously with the depth position scanning. However, the sinusoidal phase change by resonant mirror is periodical so as to keep a constant profile every line, so AAC can employ the depth scanning of flow-modulated phase change ϕ(z) effectively. Finally, the depth profile of flow velocity vd (t), that is, the modulation source,
can be formulated using flow-modulated Doppler frequency fd (t) obtained by AAC, as shown in the equation (5). nt and θ
indicate the average refractive index of sample tissue and the angle of flow direction to the optical axis, i.e. capillary orientation, respectively. The refractive index of human epidermal and dermal skin tissue was given approximately as nt = 1.41 at the wavelength band of 1300nm. It is well-known
complicated in sub-epidermal regions [14], but it tends hypothetically to orientate in the perpendicular direction to the skin surface [3], so the capillary orientation is assumed to be θ = 0 degree in this analysis.
2 , = ∆B6 arctan CDE ∑LHMJGHIJGH∗
NO ∑LHMJGHIJGH∗ P (4)
Q , =RST UV
- WXYZ[ (5)
The pixel averaging processing is performed in Figure 1 (b) (6) to make tomographic images based on the depth z axis resolution. Undesirable artifacts due to body motion typically occur during measurement to deteriorate the detection SN ratio of blood flow velocity. Skin surface motion is assumed to coincide with epidermal motion because epidermis is directly below horny layer and harder tissue than dermis. In the proposed algorithm shown by Figure 1 (b) (7), the body motion artifacts are removed line by line, by means of subtracting the depth-averaged detection frequency around the epidermis region to 150 µm from surface after the removal of motion artifacts shown in Figure 1 (b) (8), the system noise and shot noise, which are generated by the object and reference driving and so on, are removed by a moving average filter, Finally, as shown by Figure 1 (b) (9) and (12), the blood velocity tomography vd(x, z, t),
transformed flow-modulated Doppler frequency fd(t) by the
equation (5), can be displayed on the monitor and recorded in sequence. Additionally, typical tomography of morphological distribution can be also visualized simultaneously using the instantaneous amplitude A(t), which is calculated by the envelope of analytic signal as shown by Figure 1 (b) (10).
3. Material and Methods
3.1. Experimental Instrumentation
Figure 1 shows the schematic of Optical Coherence Doppler Velocigraphy (OCDV), based on a fiber-typed Michelson interferometer with the rapid scanning optical delay line (RSOD) in the reference arm. The SLD (Thorlabs, SL2000C), which had the center wavelength λc = 1340 nm
and the full width at half maximum (FWHM) ∆λ = 100 nm, was used as a broadband light source. So, the depth resolution was given theoretically as ∆z = 7.5 µm. RSOD was mounted in the reference arm, which was consisted of a diffraction grating (SHIMADZU, 150-1200-250, N=150/mm), a concave mirror (Thorlabs, CM254-100-G01) and a resonant mirror (Cambridge Technology, CRS 4kHz). The collimated reference beam by the collimator lens (Thorlabs, F280APC-C, diameter 3.4 mm) was diffracted by the grating, then the diffracted light was condensed by the concave mirror and was focused on the different positions of
resonant scanner for respective wavelengths. Consequently, the optical path scanner RSOD is implemented with keeping the same phase for each wavelength. Thus, RSOD can employ the flow-modulated phase change detection as well as to achieve the high-speed axial scan (A-scan) even in Time-Domain OCT. Furthermore, this also has independently controllable capacities of the group-delay dispersion [8] by the grating-concave mirror setup. The rotating angle of the scanning mirror was set to be ± 0.7 degrees, thereby the depth scanning range was calibrated to be 1100 µm in the air. In the object arm, two-axial galvanometer (Thorlabs, GVS102, GCM102) mirrors were mounted, and the collimated light by the collimator (F240APC-C, Thorlabs) passed through a telecentric objective lens (Thorlabs, LSM03), and then was irradiated onto the target sample. The spatial resolution of x and y direction and the depth of field are given theoretically as 29.1 µm and 1128 µm, respectively. The RF interference signal, generated from the light coming back from reference and object arms, was received by a photo-detector (Thorlabs, PDB450C-AC). After detecting the RF interference signal, it was recorded through an analog filter (NF CORPRATION, 3625) by high speed A/D converter (AVAL DATA, APX-510) having a 16-bit digitizer and 10 MHz sampling frequency. Experimentally, it has been found that the Doppler modulated light by the resonant mirror constitutes the carrier frequency in the approximately 120 kHz ~ 3.3 MHz band. Hence, the analog filter was used as a 100 kHz high-pass filter.
Figure 2. An example of tomographic image obtained by OCDV under the control condition; (a) Morphological OCT image, (b) Tomographic Distribution of instantaneous blood flow velocity overlapped by OCT image.
Figure 3. An example of tomographic image obtained by OCDV under the avascularization condition; (a) Morphological OCT image, (b) Tomographic distribution of instantaneous blood flow velocity overlapped by OCT image.
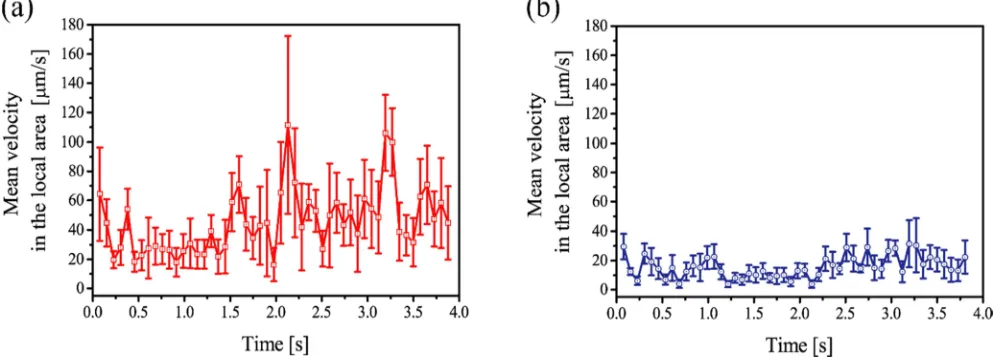
Figure 4. An example of time course of blood flow velocity in the local area; (a) control condition (\, ) = (1140 µm, 655 µm), (b) avascularization condition (\ , ) = (525 µm, 700 µm).
3.2. Experiment and Test Subject
In order to validate OCDV system, this was in vivo applied to human forearm skin of 5 male Japanese subjects aged 21 ~ 48 years, under the normal condition, i.e. control, and
measurement location was set to be the anterior region of forearm at position of 6 cm from the elbow to wrist side. The normal condition was measured, then the cuff pressure (A&D, UA-704) was set to 100 mmHg and measurement was carried out 5 minutes after avascularization. In this experiment, the correspondence to tomographic distribution of skin morphology and capillary networks was investigated from tomographic results obtained by OCDV. Especially, the temporal and spatial change in capillary blood flow velocity was evaluated qualitatively and quantitatively under the mechanically stimulated conditions from tomographic and time course data of the blood flow velocity in the capillaries. The study protocol was approved by the ethics committees in Osaka City University (Permit number: 17-04).
4. Results and Discussion
4.1. OCT and OCDV Images
Figure 2 (a) and (b) shows the obtained OCT image of morphological forearm skin under the control condition, and the tomographic distribution of the instantaneous velocity plotted during the period of 3 frames with OCT image overlapped, respectively. The epidermis can be observed around z = 200 to 300 µm as relatively low intensity, while the dermis distributed below the epidermis can be identified as high intensity due to collagen tissue [15]. The capillary
blood vessels in sub-epidermal region are running to the papillary layer in the perpendicular direction to the skin surface [3, 15]. Nevertheless, such an orientation of capillaries can never be observed in the OCT morphologic distribution due to the spatial resolution limit. On the other hand, as shown in Figure 2 (b), the instantaneous velocity distribution can reveal that the blood flow velocity distributes in agreement with relatively lower intensity regions in relatively deeper dermis, where it is detected around (x, z) = (250 µm, 700 µm) and (900 µm, 600 µm), as shown in Figure 2 (a). Actually, the averaged contrast of intensity ratio at Doppler-detected regions was degraded by about 40%, however the low intensity does not necessarily show vasculature, including different organs such as lymph vessels and hair follicles. As the above-mentioned, OCDV similarly provided OCT tomographic image and instantaneous velocity tomography under the avascularization condition, as shown by Figs 3 (a) and (b), respectively. Both morphological distributions have little difference in terms of the low intensity distribution estimated as capillary networks. However, comparing blood flow velocity tomographies obtained by OCDV between Figure 3 (b) and Figure 2 (b), it can be seen that the instantaneous blood flow velocity decreases remarkably. In summary, OCDV system was clarified to have diagnostic sensitivity to mechanical stimulus with respect to instantaneous blood flow velocity.
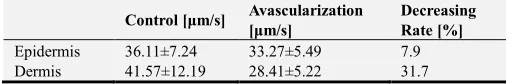
Table 1. Temporal and spatial averaged blood flow velocity in epidermis and dermis, respectively.
Control [µm/s] Avascularization [µm/s]
Decreasing Rate [%]
Epidermis 36.11±7.24 33.27±5.49 7.9
Dermis 41.57±12.19 28.41±5.22 31.7
4.2. Capillary Vasculature and Blood Flow Velocity
Figures 4 (a) and (b) shows the time course of the local blood flow velocity in the 3 × 3 area around (xc, zc) = (1140
µm, 655 µm) and (xc, zc) = (525 µm, 700 µm), where higher
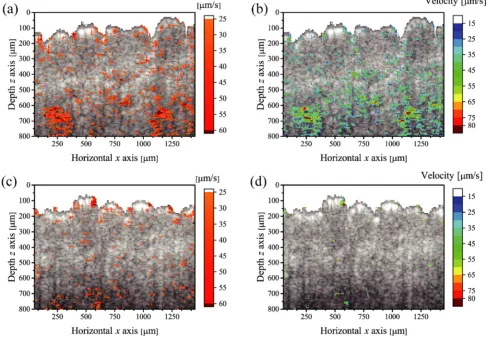
averaged velocity was measured in Figure 2 (c) and Figure 3 (c), respectively. The blood velocity is found to vary intermittently under the control condition, which designates that the irregular movement and pulsation of red blood cells and capillaries should induce the intermittent detection of Doppler modulation. In contrast, the blood flow velocity under avascularization condition keeps relatively constant at lower velocity. Evaluating time-dependency on blood flow velocity, the temporal standard deviation filter is expected to diagnose the capillary networks tomographically. Figures 5 (a) and (b) show the capillary networks when the threshold is set optimally to be 25 µm/s. The tomographic map applying the standard deviation filter agrees qualitatively with relatively lower intensity distribution in the morphological OCT images, so OCDV can visualize the capillary networks under the control condition. There appears frequently to be discontinuous networks, which is attributed to 3-dimensional orientation of capillaries naturally having complicated dermal vasculature [3], as well as irregular movement of red blood cells. While, the avascularization condition makes it difficult to visualize the thinner vascular networks due to mechanical stress. Recently, the assessment of dermal vasculature has been proposed as a temporal irregularity map by applying auto-correlation to OCT images [16]. Typically, this can provide en face image of capillary networks from 3-dimensional OCT. OCDV system also has the same potential using 3-dimensional data, but additionally has strong advantage of visualizing capillary blood flow velocity. Taking account of the threshold of standard deviation filter, the time-averaged velocity distribution during about 3 seconds of 40 frames were calculated as Figs 5 (b) and (d) under the respective conditions of control and avascularization, respectively. Under avascularization condition, blood velocity hardly appears to tomographic OCDV image, on the contrary it is clearly found that the higher and lower velocity is visualized like stretching to the surface around the upper dermis and the sub-epidermal region, respectively. In general, the vascular plexuses well developed horizontally in the epidermal plane, i.e. sub-papillary plexuses, are interconnected by vertically oriented vessels to the papillary layer [3, 14, 17]. There actually appears, as shown in Fig 5 (b), to observe the lower and higher blood flow velocity around sub-papillary layer and deeper reticular dermis, respectively. Therefore, the visualization of capillary vasculature, e.g. sub-papillary
plexuses, is necessary to display en face sectional images using 3-dimensional OCDV. An example of the local averaged velocity around (xc, zc) = (1140 µm, 650 µm) was
detected to be 100.2 µm/s. The maximum blood velocity was calculated similarly from time-averaged velocity distribution, resulting in 132.63 µm/s and 66.11 µm/s under respective conditions of control and avascularization. The maximum blood velocity under avascularization condition was further decreased 50.2 % by mechanical stimulus. It should be noted that the typical velocity order of red blood cell in nailfold capillaries is about 500 ~ 1000 µm/s, which has been measured by a capillaroscope [18]. Capillary blood velocity in sub-epidermal region, obtained by OCDV, had almost the same order as that in nailfold although it was relatively smaller. Dermal skin has more complicated 3-dimensional vasculature than the nailfold has nearly straight vascular [3]. As apparent from the equation (5), the detected velocity is a function of capillary orientation θ, of which spatial variation can further reduce the detection value, resulting in the more valid order. There are an extremely lower number of experimental research about blood flow velocity below general skin tissue, but it was actually reported that the blood flow velocity in dermal capillaries is estimated to be less than 500 µm/s [19]. Therefore, the proposed OCDV system can in vivo diagnose the capillary blood velocity tomographically. Table 1 shows the blood velocity averaged in the extracted capillary networks, separately calculated in the epidermis and dermis. The change in velocity of blood or interstitial flow was not as much as 7.9 % in epidermal region but had significantly 31.7 % decrease in the dermal region. Therefore, the mechanical response of capillary blood flow was thought to be diagnosed tomographically and quantitatively as a 2-dimensional flow velocity imaging. As discussed so far, it is quite difficult to measure blood flow velocity quantitatively due to 3-dimensional capillary network and intermittently irregular movement of red blood cells as well as physiological skin conditions. Provided that the tomographic distribution of capillary orientation to optical axis θ(x, y, z) should be calculated precisely from the 3-dimensional dermal vasculature, the detection accuracy of blood velocity will be able to be further enhanced under the consideration of capillary structures. It is, therefore, considered that the proposed OCDV system can display potentially temporal and spatial change of capillary networks and blood flow velocity tomographically, non-invasively and quantitatively in the micrometer resolution, so has strong efficacy to diagnose “Capillary Angio-Dynamics” of skin tissue especially by mechanical stimuli. Therefore, OCDV can contribute additionally to the assessment of capillary vascular function, e.g. Flow-Mediated Dilatation (FMD), pharmaceutical efficacy of percutaneous absorption and transplant engraftment of regenerated tissue.
5. Conclusion
Velocigraphy (OCDV), which can detect depth-profile of flow-modulated phase change in axial-scanned interference signals by the collaboration of Hilbert transform and adjacent auto-correlation. In order to validate OCDV system, this was in vivo applied to human forearm skin under respective mechanically stimulated conditions of control and avascularization. Temporal and spatial changes in capillary blood flow velocity were evaluated under each condition. As a result, it was confirmed that OCDV can offer networks of capillary vasculature and the blood flow velocity just below the epidermis as well as the morphological structures, as a cross-sectional tomographic imaging with the micrometer resolution. It was found that blood velocity further decreased in upper dermis under avascularization by mechanical stimulus, so that OCDV could visualize the intermittent movement of red blood cell in capillaries, namely “Capillary Angio-Dynamics”. In conclusions, OCDV system could be quite effective for evaluating microcirculation characteristics as a micro-tomographic imaging of blood flow velocity of capillary vessels inside skin.
References
[1] Ganceviciene, R., et al., Skin anti-aging strategies, Dermato-Endocrinology, Vol. 4, Issue 3, (2012), pp. 308-319.
[2] Adachi, H., et al., Increase of stratifin triggered by ultraviolet irradiation is possibly related to premature aging of human skin, Experimental Dermatology, Vol. 23, (2014), pp. 32-36. [3] Shimizu, H., Shimizu’s textbook of dermatology, Hokkaido
University Press, (2007), Chapter 1, Chapter 17.
[4] Berardesca, E., et al., Non Invasive Diagnostic Techniques in Clinical Dermatology, Springer, (2014), pp. 311-328.
[5] Fujimoto, J., et al., The Development, Commercialization, and Impact of Optical Coherence Tomography, Investigative ophthalmology & Visual Science, Vol. 57, No. 9, (2016), pp. 1-13.
[6] Zhang Q., et al., Wide-field imaging of retinal vasculature using optical coherence tomography-based microangiography provided by motion tracking, Journal of Biomedical Optics, Vol. 20(6), (2015), 066008.
[7] Vivek J Srinivasan, et al., Micro-heterogeneity of flow in a
mouse model of chronic cerebral hypoperfusion revealed by longitudinal Doppler optical coherence tomography and angiography, Journal of Cerebral Blood Flow & Metabolism, Vol. 35, (2015), pp. 1552-1560.
[8] Tearney, G. J., et al., High-speed phase- and group-delay scanning with a grating-based phase control delay line, Optics Letters, Vol. 22, Issue 23, (1997), pp. 1811-1813.
[9] King, F. W., Hilbert transforms, Cambridge University Press, Cambridge, (2009).
[10] Kasai, C., et al., Real-time two-dimensional blood flow imaging using an autocorrelation technique, IEEE Trans. Sonics and Ultrasonics, Vol. 32, No. 3, (1985), pp. 458-464. [11] Bouma, B., Handbook of Optical Coherence Tomography,
Academic Press, New York, (2006).
[12] Schmitt, J. M., Optical Coherence Tomography (OCT): A Review, IEEE Journal on Selected Topics in Quantum Electronics, Vol. 5, No. 4 (1999), pp. 1134-1142.
[13] Furukawa, D., et al., Accuracy Evaluation on Tomographic Micro-visualization of Flow Velocity using High Frequency Modulated Low Coherence Interferometer, Journal of JSEM, Vol. 17, No. 1, (2017), pp. 52-56, (in Japanese).
[14] Irwin M. Braveman et al, Correlation of laser doppler wave patterns with underlying microvascular anatomy, Journal of Investigative Dermatology Vol. 95(3), (1990), pp. 283-286. [15] Welzel, J., et al., Optical coherence tomography of the human
skin, Journal of the American Academy of Dermatology, Vol. 37, (1997), pp. 958-963.
[16] Enfield, J., et al., In vivo imaging of the microcirculation of the volar forearm using correlation mapping optical coherence tomography (cmOCT). Biomedical Optics Express, Vol. 2, No. 5, (2011), pp. 1184-1193.
[17] Imanishi, M., et al., Three-dimensional venous anatomy of the dermis observed using stereography, Journal of Anatomy. Vol. 212, No. 5, (2008), pp. 669-673.
[18] Watanabe, M., et al., High speed digital video capillaroscopy nailfold capillary shape analysis and red blood cell velocity measurement, Journal of Biomechanical Science and Engineering, Vol. 2, No. 2, (2007), pp. 81-92.