Published online March 18, 2015 (http://www.sciencepublishinggroup.com/j/ejpm) doi: 10.11648/j.ejpm.s.2015030201.17
ISSN: 2330-8222 (Print); ISSN: 2330-8230 (Online)
Functional Amblyopia; A Blinding Disease in a Normal Eye
Saman Wimalasundera
Department of Community Medicine, &In-Charge, Ophthalmologist, Community Ophthalmology Center, Faculty of Medicine, University of Ruhuna, Galle, Sri Lanka.
Email address:
To cite this article:
SamanWimalasundera. Functional Amblyopia; A Blinding Disease in a Normal Eye. European Journal of Preventive Medicine. Special Issue: New Frontiers of Public Health from the Pearl of Indian Ocean, Sri Lanka. Vol. 3, No. 2-1, 2015, pp. 36-46.
doi: 10.11648/j.ejpm.s.2015030201.17
Abstract:
Amblyopia is reduction of vision with the proper optical correction either in one or both eyes.. The diagnosis of Amblyopia requires both the demonstration of visual acuity loss and the absence of an organic cause. A visual defect screening program was conducted on children aged 3-14 years of Bope-Poddala health unit area of the city of Galle Sri Lanka. Children aged 5-14 years were examined at each respective school. Children aged 3-5 years were examined at the pre schools .Children not attending to pre schools were examined in the community. All possitives and difficult to handle cases with a 10% of normal were referred to the ophthalmology clinic for secondary screening, investigation and diagnosis. Cases of diagnosed Amblyopia were called after one year for re-assessment. A total of 6685 school children and 934 preschool children were enrolled for this study. After exclusion, 5649 children were screened.Out of the total of 5649 children who were screened 439 (7.8%) were found to have eye diseases with or without visual defects giving a prevalence of 78/1000 children. Of those with such diseases, 88.8% had visual defects. The prevalence of visual defect was 6.9% (69/1000 children). Of the children with visual defects 90.0% (351) were due to refractive errors. The prevalence of refractive errors was 6.2% (62/1000 children).The analysis of the prevalence of different types of refractive errors showed that the prevalence of myopic astigmatism was 52.3%, Simple myopia was 24.6%, simple hypermetropia was 12.5%. Myopic astigmatism was the commonest type of refractive error in unilateral or bilateral involvement. The second commonest was simple myopia. It was found that out of 223 children with bilateral refractive errors 11.6% had unilateral Amblyopia and 17.5% had bilateral Amblyopia giving a total of 29.1%. Of all children with unilateral refractive errors 39.8% had Amblyopia. The development of Amblyopia among unilateral refractive errors was higher than bilateral refractive errors (p<0.05).The total prevalence of refractive Amblyopia was 2.1% of the population. Of them 1.4% had unilateral Amblyopia and 0.7% had bilateral Amblyopia. This difference was statistically significant. (P<0.05) Highest prevalence was observed in the age group of six and seven years (3.4% and 3.0%.). Distribution of Amblyopia among males and females were almost equal. The total prevalence of Amblyopia among children was 2.3%. Refractive Amblyopia calculated was 2.1% that consisted of 1.9% of Anisometropic Amblyopia.The strabismic Amblyopia was 0.2%. Deprivation Amblyopia was 0.2%. There were no Amblyopes found in the group of strabismic Amblyopia without refractive errors.Keywords:
Refractive Errors, Amblyopia Simple Myopia, Myopic Astigmatism, Strabismus, Screening1. Introduction
Children in their early childhood have many different needs for their proper growth and development physically mentally and socially. Health, education, environment, social aspects, nutrition, water supply and sanitation and enforcement of laws to protect children are some of thoseneeds.Proper physical and mental growth of children requires good “vision” in their eyes. Visual development is one of the most important aspects that can affect adversely all
diagnosis of Amblyopia is confirmed when a complete ophthalmological examination reveals reduced visual acuity that cannot be explained by an organic abnormality. Amblyopia was first defined by Gunter Von Noorden as; Unilateral or bilateral decrease of visual acuity caused by “form deprivation”, “abnormal binocular interaction” or by both for which no organic cause can be detected by physical examination of the eye and which in appropriate cases is reversible by therapeutic means[2] However in the presence of an extra neural organic cause such as unilateral or bilateral congenital cataract, Amblyopia can still be inferred because It is known that in such cases Amblyopia will persist even after Amblyopeagenic factor has been eliminated.
1.1. Socio Economic Impact of Amblyopia
Children with severe amblyopia are at risk of significant disability if their normal eye is lost due to any reason in later life.[3] Many services (police, Army, Railway and Aviation) as well as some other occupations require normal vision for recruitments. Therefore amblyopes are deprived of applying for such occupationsInability obtain driving license in future life.The amounts of visual loss in amblyopia vary from minimal loss to grossly defective. The degree of visual defect is largely determined by the age of onset; younger the child when normal seeing is interfered, more profound will be the visual loss.
1.2. Etiology of Amblyopia
Amblyopia is considered to be due to a number of conditions that take place in early childhood namely Anisometropic, Strabismic, and Stimulus deprivation types.[4]
1.3. Deprivation Amblyopia
Loss of formed visual stimulation. May be due to congenital cataract, Ptosis or corneal or media opacification.
1.4. StrabismicAmblyopia
Unilateral visual loss resulting from continued development of the preferred or dominant eye and suppression of the deviating eye.
1.5. Refractive Amblyopia
Reduced vision from bilaterally large or asymmetric (anisometropia) refractive errors.
The conditions which cause amblyopia usually allow normal visual development in one eye at the expense of the fellow amblyopic eye (unilateral amblyopia). However bilateral amblyopia also may occur in the eyes with bilateral uncorrected ametropia or bilateral congenital cataract [5].The ultimate severity of amblyopia however depends upon the age of onset and the duration of its cause. The severity of Amblyopia is considered to be high when stimulus deprivation is present before the age of six year[6]Amblyopia due to anisometropia may improve on spectacle treatment
(correction of refractive error) up to the age of about 12 years[7]. The successful treatments of amblyopia depend upon the early detection and correction mainly. Regular assessment and follow up is mandatory throughout the childhood [8].
1.6. Diagnosis ofAmblyopia
Vision in children three year and above can be successfully tested with visual acuity tests based on Snellens chart with pictures or Characters suitable for that particular age group
[8].Amblyopia is usually asymptomatic. Therefore it should be a target for screening programs in children. The diagnosis of Amblyopia requires both the demonstration of visual acuity loss and the absence of an organic cause[2]. In most of the studies world wide two lines or more reduction in visual measurement using Snellens chart (<6/12) in an otherwise normal eye is considered as the cut-off point for the diagnosis of Amblyopia. It is usually expressed as a defect of visual acuity. Because of crowding phenomenon, full line visual acuity is the only accurate and reliable method (reproducible) for determining vision in functional amblyopia.The differentiation of organic Amblyopia from functional Amblyopia is important and can be done using neutral density filters which reduces the visual acuity in organic Amblyopia if the density increases. Functional Amblyopia can be confirmed by using the crowding phenomenon i.e. reduction of visual acuity caused by contour interactions with adjacent letters when simultaneously presents.[9]Although crowding is a physiological effects,studies have shown that it is exaggerated in Amblyopia[10].Apart from visual acuity, contrast sensitivity can also be used as a diagnostic criteria[11].
1.7. Pathophysiology
to observe the visual changes in Sri Lankan children, a study was carried out. This study was carried out in Bope-Poddala health unit area of Galle which is the field training and research area attached to the department of community medicine.
1.8. Aims
To find the burden of Amblyopia and the causative factors in the vulnerable age group of 3-14 years in Sri Lankan children and their type of treatment compliance.
2. Method of the Study
2.1. Design
Prevalence of Amblyopia is about 1-4% in the studies done in developed countries[14] . The accuracy of case detection is therefore very important. Hence a two stage screening procedure was designed. The individuals who were selected at first screening were subjected to second stage screening prior to the confirmatory procedure of 3rd stage complete ophthalmological examination. Ten percent of normals were again subjected to screening to find the reliability of the screening test.
2.2. Target Group
Children aged 3-14 years of Bope-Poddala health unit area of the city of Galle Sri Lanka. Considering service and ethical reasons it was decided to incorporate all children of 3-14 years of the area in to the study.
2.3. Screening Procedure
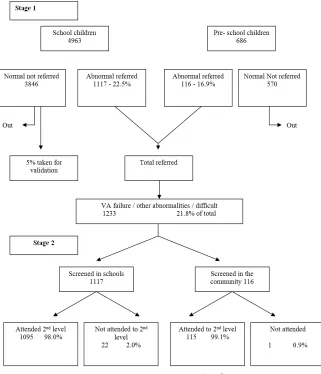
Children aged 5-14 years (Up to year 9 in schools) were examined at each respective school after giving prior notice to improve attendance Children aged 3-5 years (attending pre schools) were examined at the pre schools. Children aged 3-5 years not attending to pre schools were examined in the community with the help of the health department staff at special screening centers.All selected cases and difficult to handle cases with a 10% of normal cases were referred to the central ophthalmology clinic at the faculty of medicine for secondary screening, investigation and diagnosis.Fig.1
2.4. Training for the Field Staff
A specially designed training program on how to screen for visual defects was conducted as a two day workshop for project personnel. (Public health nursing sisters, family health workers and research assistants –medical staff attached to the department of community medicine as demonstrators) At the beginning and at the end of the work shop an evaluation was carried out to find the adequacy of knowledge and skills required for screening
2.5. Second Stage Screening and 3rdStage Examination
At the second stage, visual acuity was re-checked by the investigator (ophthalmologist) in the central clinic. Which is properly designed and maintained with optimum conditions.Selected cases were subjected to slit lamp examination (Examination of external eye, upper tarsal plate, and anterior segment) direct ophthalmoscopy(optic disc and posterior segment in all selected children) and indirect ophthalmoscopy (depending on the condition)[15], refraction test (with cycloplegia in younger children), post mydriatic test after 2 weeks. Those who were wearing spectacles were re-examined to find the correction and suitability of spectacles worn. Spectacles corrections were prescribed to all children with the need.Fig.2. Only the researcher examined all referred cases and performed refraction tests to reduce the personnel bias. Children who were in need of surgery were referred to Teaching hospital, Karapitiya
2.6. Diagnosis of Amblyopia and Follow Up
Corrected visual acuity of 6/12 or less in the absence of any other apparent abnormalities were considered as having Amblyopia status. Confirmation was done subjecting them to single optosype Snellens chart where they should show an increase in visual acuity levecompred to the normal testing with Snellenschartl. Parents / guardians were informed regarding their condition and advised to obtain the spectacle correction without delay in the cases of refractive a Ablyopia. Amblyopes were advised to wear the correction regularly and performed occlusion therapy at least one hour to two hours per day.
Cases of diagnosed Amblyopia were called after one year for re-assessment. There vision was re-checked with and without corrections. Refraction was performed on them again to assess the state of Refraction and Amblyopia after one year of correction and occlusion therapy.
3. Results and Discussion
Atotal of 6685 school children and 934 preschool children were enrolled for this study. After exclusion 5649 children were screened.(Fig1)
Fig.1. Type of analysis: Screening for visual defects and other abnormalities
*Obtained from schools; **Obtained from family health workers
Eye diseases identified were categorized mainly in to two groups
Group 1Refractive errors (Amblyopia and Strabismus included)
Group 2Non refractive type eye diseases (other eye diseases)
Group 2 diseases were further categorized and the conditions with visual defects and the conditions without visual defects.
Six sub groups were found under the group 2 eye diseases namelyCongenital eye diseases, Infections, Nutritional problems, Allergic conditions ,Traumatic conditions and Others (Vague conditions)
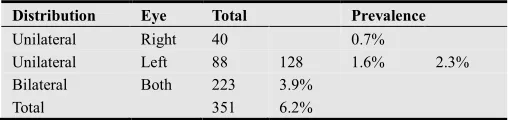
Out of the total of 5649 children who were screened 439 (7.8%) were found to have eye diseases with or without visual defects giving a prevalence of 78/1000 children. Of those with such diseases, 390 (88.8%) had visual defects. Therefore the prevalence of visual defect found was 6.9% (69/1000 children). Of the children with visual defects 90.0% (351) were due to refractive errors as a single disease entity. The prevalence of refractive errors found was 6.2% (62/1000 children). Group 2 eye diseases with visual acuity defects were only 0.6% and refractive errors caused by group 2 diseases was 0.1%. Table 3. The table 4 shows the distribution of refractive errors as bilateral or unilateral.The prevalence of bilateral and unilateral refractive errors was 3.9% and 2.3% respectively. Out, of the unilateral errors 68.8% were found having the left eye involvement.The analysis of the prevalence of different types of refractive errors among the children with refractive errors shows that the prevalence of myopic astigmatism was 52.3%, Simple myopia was 24.6%, simple hypermetropia was 12.5% among the total refractive errors of 6.2% in the population. Tables 6 and 7 describes the existence of different combinations of refractive errors in bilateral involvement. Myopic astigmatism was the commonest type of refractive errors in unilateral or bilateral involvement. The second commonest was simple myopia.Bilateral refractive errors in similar types found was myopic astigmatism in 40.3%,simple myopia in 29.3% and simple hypermetropia in 18.2%.Hypermetropic astigmatism in simple and compound forms were 4.4%and 4.9%.
The analysis of the existance of Amblyopia was done according to the classification mentioned in the method. It was found that out of 223 children with bilateral refractive errors 11.6% had unilateral Amblyopia and 17.5% had bilateral Amblyopia giving a total of 29.1% Amblyopia among all Refractive Errors.Of all 128 children with unilateral refractive errors 39.8% had amblyopia. (Table 8) This difference was statistically significan. The development of Amblyopia among unilateral refractive errors was higher than bilateral refractive errors ( p<0.05).
The table 9 shows the occurenceofAmblyopia among different age groups and sex. Since all the cases of strabismus found in the survey had refractive errors there was a difficulty in differentiating strabismic Amblyopia from refractive Amblyopia.Therefore they all were included under refractive
Amblyopia group.It was assumed that refractive error in the strbismus cases was the underlying cause for the strbismus.
The total prevalence of refractive Amblyopia was 2.1% of the population. Of them 1.4% had unilateral Amblyopia and 0.7% had bilateral Amblyopia. This difference was statistically significant. (P<0.05) Highest prevalence was observed in the age group of six and seven years (3.4% and 3.0%.). Distribution of Amblyopia among males and females were almost equal in both bilateral and unilateral involvement.
To find the type of refractive error which is more vulnerable to cause amblyopia if not treted in time the analysis is performed as shown in table 10. The highest percentage of Amblyopia had occurred in the refractive errors groups of compound hypermetropic astigmatism (uncorrected) 100.0%, Mixed astigmatism 59.1%, and Compound myopic astigmatism 48.9%. Although the commonest type of refractive error found was myopic astigmatism it had had given rise only to 29.5% Amblyopia
Further analysis is performed to differentiate the other types of Amblyopiasuch as strabismic and stimulus deprivation types. Table 11 shows the presence of strabismus among Amblyopes.Out of all 116 amblyopes 33.6% had strabismus. All of them had initial refractive errors.The table 12 showed what type of strabismus existed in amblyopes. Of all strabismus case nearly-2/3 had divergent type (64.1%.)
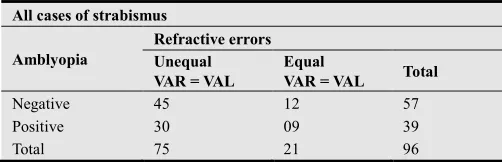
Since it was difficult to differentiate Anisometropic Amblyopia and Strabismic Amblyopia due to the fact that all strabismus cases had refractive errors. An attempt was made to find out such cases by controlling the variable “refractive error (Table13).If Amblyopia developed instrabismic cases in the presence of refractive error that were equal in both eyes and in such situations it was assumed that the Amblyopeagenic factor was mainly the strabismus.
Some cases of deprivation Amblyopia were detected among the group of “Other eye diseases”.It was due to the presence of conjenitalcataract,Traumatic cataract, conjenitalptosis,and corneal scars.
The prevalence of deprivation Amblyopia was 2/1000 children (0.2%). Table 14.
The total prevalence of Amblyopia include all types of Amblyopia together, The total prevalence of Amblyopia among children was 2.3%. Refractive Amblyopia calculated was 2.1% that consisted of 1.9% of Anisometropic Amblyopia. Strabismic Amblyopia (again with refractive errors) was 0.2% and Deprivation Amblyopia was 0.2%. There were noAmblyopes found with Strabismic Amblyopia without refractive errors in this study.Table15
4.Results of Follow-Up After One Year
amblyopic eyes. (Watching a television for one to two hours per day only with amblyopic eye wearing the correction)
The treatment compliance was checked and categorized as follows
Wearing spectacles and doing occlusion therapy regularly.
Use of correction irregularly occlusion therapy not performed
Complete defaulters
Under 3 compliance regimens the progress was measured and categorized as better, worse and same (Tables 16, 17, 18).Out of 90 children with diagnosed Amblyopia who attended for follow up 57.8% had used spectacles and 42.2% were complete defaulters. Of 57.8% who used spectacles 37.8% had performed occlusion therapy as instructed. In the follow up it was found that, of those who did occlusion therapy 23.5% in their right eyes and 35.3% in left eyes showed and improvement in their visual acuity without correction compared to their initial visual acuity level. Visual acuity remained same in 61.8% of right eyes and 50.0% of left eyes. (category “same” included the eyes with normal vision also).Of the 38 non users 34.2% in the right eyes and 28.9% in the left eyes showed further deterioration of vision. It was same in 60.5%.
The table 18 shows what had happened to those Amblyopes who performed occlusion therapy after one year and the state of their corrected visual acity with spectacles. the Of all children who improved a majority. (71.4% of right eyes and 81.3% of left eyes) had used spectacles and performed occlusion therapy regularly out of children who showed further deterioration of vision. Majority were either complete
defaulters (64.0% of right eyes and 58.3% of left eyes) or irregular users (28.0% of right eyes and 20.8% of left eyes).
The table 19 and 20 shows what has happened to the disease condition Amblyopia after the treatment At the laps of one year 20.0% showed improvement in their visual acuity level reducing their Amblyopia status. It remained same in 32.2% and deteriorated in 26.1%.12 children out of 90, achieved the non amblyopic status after one year. It was 13.3% of children who attended for follow up and 35.3% of children who did occlusion therapy.
This study highlights the importance of detecting refractive errors and Amblyopia in children and correcting them in time to enhance their development.There is relatively a poor track records for treatment outcomes for Amblyopes. It has not created a proper concern by the Ophthalmic community in Sri Lanka yet.Since there is a critical period for Amblyopia and poor patient compliance, poor results usually take place. Patients drops out of treatment often because patching treatment is not a desired thing for the patients and parents as well.New trends should be developed to regularize the procedure s follows, regular screening, proper follow up, maintaining records and use of new technology.
It was found at the first stage screening that 1117 school children and 116 pre school children were having abnormalities or found difficult in screening. They were refereed to the second stage. The attendance for the second stage was well above 95%. Fig.2. A sample of 10% normal were refereed for further screening to the main center to find the reliability of results.Of the total population 1233 (21.8%) were referred to stage 2 screening and of them only 1.9% failed to attend (controls not included)
Table 1. Demographic detailsAge / sex distribution
Age/sex
Total
Age 3-4 4-5 5-6 5-6 6-7 7-8 8-9 9-10 10-11 11-12 12-13 13-14
Male 118 143 45 298 328 300 338 303 284 286 294 216 294552.1%
Female 102 221 57 220 314 255 273 261 277 279 251 194 270447.9%
Total 220 364 102 518 634 555 611 564 561 565 545 416 5649100%
The ssreened population in different age grous and sex are shown above.
Table 2. Ethnic distribution
Ethnisity Pre-schoolers Schoolers Total
Sinhala 589 85.9% 4286 86.4% 4875 56.3%
Muslim 14.0% 656 13.2% 752 13.3%
Tamil 961 0.1% 21 0.4% 22 0.4%
Table 3. Distribution of eye diseases
Disease category Visual defect Total PrevalenceN = 5649
+ % - %
Group 1 Refractive errors 351 100% - 351 6.2%
Group 2
Congenital disease 22 66.6% 11 33.3% 33 0.58
Infections 9 75.0% 03 25.0% 12 0.21%
Nutritional - 14 100% 14 0.25%
Allergic - 02 100% 02 0.04%
Trauma 08 80.0% 02 20.0% 10 0.17%
Others - 17 100% 17 0.3%
Sub total 88
Out of the total of 5649 children who were screened 439 (7.8%) were found to have eye diseases with or without visual defects giving a prevalence of 78/1000 children. Of those with such diseases, 390 (88.8%) had visual defects. Therefore the prevalence of visual defect found was 6.9% (69/1000 children). Of the children with visual defects 90.0% (351) were due to refractive errors (as a single disease entity). The prevalence of refractive errors found was 6.2% (62/1000 children). Group 2 eye diseases with visual acuity defects were only 0.6% and refractive errors caused by group 2 diseases was 0.1% (4).
Table 4. Distribution of refractive errors
Distribution Eye Total Prevalence
Unilateral Right 40 0.7%
Unilateral Left 88 128 1.6% 2.3%
Bilateral Both 223 3.9%
Total 351 6.2%
The prevalence of bilateral and unilateral refractive errors was 3.9% and 2.3% respectively. Out, of the unilateral errors 68.8% were found having the left eye involvement.
Table 5. Different types of refractive errorsUnilateral refractive error
Types of refractive errors
Involvement
Total
Right eye Left eye
No. % No. % No %
Simple myopia(SM0 8 20.5 23 25.8 31 24.6
Simple hypermetropia(SH) 9 23.5 07 7.9 16 12.5
Myopic astigmatism (MA) 16 41.0 51 57.3 67 52.3
Hypermetropic astigmatism(HA) 02 5.1 01 1.1 03 2.3
Compound myopic astigmatism(CMA) - - 02 2.2 02 1.6
Compound hypermetropic astigmatism(CHA) 02 5.1 01 1.1 03 2.3
Mixed astigmatism(MIX) 02 5.1 04 4.5 06 4.6
Total 39 100.0 89 100.0 128 100.0
The analysis of the prevalence of refractive errors shows that the prevalence of myopic astigmatism was 52.3%, Simple myopia was 24.6%, simple hypermetropia was 12.5% among a total prevalence of refractive errors of 6.2% in the population.
Table 6. Bilateral refractive errors- Similar combinations
Right eye Left eye Total
SM SH MA HA CMA CHA MIX
SM 53
SH 33
MA 73
HA 08
CMA 09
CHA
MIX 05
Total 53 33 73 08 09 05 182
% 29.3 18.2 40.3 4.4 4.9 2.8
Bilateral refractive errors in similar types found was myopic astigmatism in 40.3%,simple myopia in 29.3% and simple hypermetropia in 18.2%.Hypermetropic astigmatism in simple and compound forms were 4.4%and 4.9%.
Table 7. Bilateral refractive errors – Different combinations
Right eye Left eye Total
SM SH MA HA CMA CHA MIX
SM 0 1 7 0 3 0 0 11
SH 2 0 4 0 0 1 1 8
MA 6 0 0 1 2 0 1 10
HA 0 0 1 0 0 0 0 1
CMA 4 0 4 0 0 0 0 8
CHA 0 0 0 0 0 0 0 0
MIX 1 0 2 1 0 0 0 4
Myopic astigmatism was the commonest type of refractive errors in unilateral or bilateral involvement. The second commonest was simple myopia
Table 8. Occurrence of Amblyopia due to refractive errors
Involvement of refractive errors
Amblyopia
Unilateral Bilateral Total
No. % No. % No. %
Bilateraln=223 26 11.6 39 17.5 65 29.1
Unilateraln=128 51 39.8 - - 51 39.8
Total n=351 77 21.9 39 11.1 116 33.0
Out of 223 children with bilateral refractive errors 11.6% had unilateral Amblyopia and 17.5% had bilateral Amblyopia giving a total of 29.1% Amblyopia among all Refractive Errors.Of all 128 children with unilateral refractive errors 39.8% had amblyopia.
This difference was statistically significant difference. The development of Amblyopia among unilateral refractive errors was higher than bilateral refractive errors (SED p<0.05)
Table 9. Prevalence of Refractive Amblyopia by age and sex
Age (up to)Age n=
Unilateral Bilateral
Total Prevalence
Male Female Male Female Yearly Group
4 (220) 2 2 0 0 4 1.8%
5 (364) 2 2 1 2 7 1.9% 2.7%
6 (620) 8 7 4 2 21 3.4%
7 (634) 4 9 3 3 19 3.0%
8 (555) 4 3 2 1 10 1.8% 1.9%
9 (611) 3 2 1 1 7 1.1%
10 (564) 3 1 2 2 8 1.4%
11 (561) 2 4 2 1 9 1.6%
12 (565) 2 3 3 3 11 1.9% 1.9%
13 (545) 6 4 2 4 16 2.9%
14 (410) 1 3 0 0 4 1.0%
Total (n=5649)
37 2945
40 2704
20 2945
19 2704
116
Prevalence 1.5 1.4%
0.7% 0.7%
0.7% 2.1%
Since all the cases of strabismus found in the survey had refractive errors there was a difficulty in differentiating Strabismic Amblyopia from refractive Amblyopia.
Therefore they all were included under refractive Amblyopia group.
The total prevalence of refractive Amblyopia was 2.1%. Of them 1.4% had unilateral amblyopia and 0.7% had bilateral Amblyopia. This difference was statistically significant. (P<0.05) Highest prevalence was observed in the age group of six and seven years (3.4% and 3.0%)
Distribution of Amblyopia among males and females were almost equal in both bilateral and unilateral involvement.
Table 10. Occurrence of Amblyopia in each category of Refractive Errors
Refractive error type
Total number of eyes
Number of
amblyopic eyes Proportion
MA 241 71 29.5%
SM 161 29 18.0%
SH 91 18 19.8%
HA 22 04 18.1%
CMA 33 16 48.9%
CHA 04 04 100.0%
MIX 22 13 59.1%
Total 574 155 27.0%
The highest percentage of Amblyopia has occurred in the refractive errors groups of compound hypermetropic astigmatism (uncorrected) 100.0%, Mixed astigmatism 59.1%, and Compound myopic astigmatism 48.9%. Myopic astigmatism has given rise only to 29.5% Amblyopia.
Table 11. Amblyopia and the presence of Strabismus
Amblyopes
Strabismus No. %
Positive 39 33.6
Negative 77 66.4
Total 116 100.0
Further analysis is performed to differentiate the other types of Amblyopia such as strabismic and stimulus deprivation types. Table 11 shows the presence of strabismus among Amblyopes.Out of all 116 amblyopes 33.6% had strabismus. All of them had initial refractive errors.
Table 12. Type of strabismus in amblyopia
Types of squints
No. of amblyopes Total
Right eye Left eye No. %
Convergent 6 8 14 35.9
Divergent 8 17 25 64.1
Total 14 25 39 100.0
The table 12 showed what type of strabismus existed in amblyopes. the Of all strabismus case nearly -2/3 had divergent type (64.1%)
Table 13. Differentiation of StrabismicAamblyopia
All cases of strabismus
Amblyopia
Refractive errors Unequal VAR = VAL
Equal
VAR = VAL Total
Negative 45 12 57
Positive 30 09 39
Total 75 21 96
It was difficult to differentiate AnisometropicAamblyopia and Strabismic Amblyopia due to the fact that all strabismus cases had refractive errors. An attempt was made to find out such cases by controlling the variable “refractive error”.
were equal in both eyes and in such situations in the presence of strabismus it was assumed that the Amblyopeagenic factor was mainly the strabismus.
Among 116 refractive Amblyopia there were 9 cases with co-existing strabismic Amblyopia giving a prevalence of 0.2%.
Table 14. Deprivation Aamblyopia
Diagnosis Age of the
children/years Frequency
Prevalence n=5649
Congenital
cataract 6/13/& 6 03
Traumatic
cataract 6/11/4/& 3 04
Ptosis 10/& 14 02
Corneal scar 6 1
Total 10 0.2%
Some cases of deprivation amblyopia were detected among the group of “Other eye diseases”.It was due to the presence of conjenitalcataract,Traumatic cataract, conjenitalptosis,and corneal scars.
The prevalence of deprivation Amblyopia was 2/1000 children (0.2%)
Table 15. The total prevalence of Amblyopia
Type of amblyopia No. Prevalence
Refractive Anisometropic 107 1.9%
Strabismic 09 0.2%
Deprivation 10 0.2%
Total 126 2.3%
The total prevalence of Amblyopia include all types of Aamblyopia together, The total prevalence of Amblyopia among children was 2.3%. Refractive Amblyopia calculated was 2.1% that consisted of 1.9% of Anisometropic Amblyopia. Strabismic Amblyopia (again with refractive errors) was 0.2% and Deprivation Amblyopia was 0.2%. There were none with Strabismic Amblyopia without refractive errors.
Table16. Results of the follow up study after 1 year Attendance for follow up
Attendance No. %
Attended 90 77.6
Non attended 26 22.4
Total 116 100
The follow up for the Amblyopic subjects were performed at every three months interval untill the completion of one year Only 77.6% of amblyopes attended for follow up. The treatment regime recommended was to wear the spectacle correction and to perform occlusion therapy for the amblyopic eyes. (Watching a television for one to two hours per day only with amblyopic eye wearing the correction)
The treatment compliance was checked and categorized as follows
Wearing spectacles and doing occlusion therapy regularly.
Use of correction irregularly occlusion therapy not performed
Complete defaulters
Under 3 compliance regimens the progress was measured and categorized as better, worse and same.
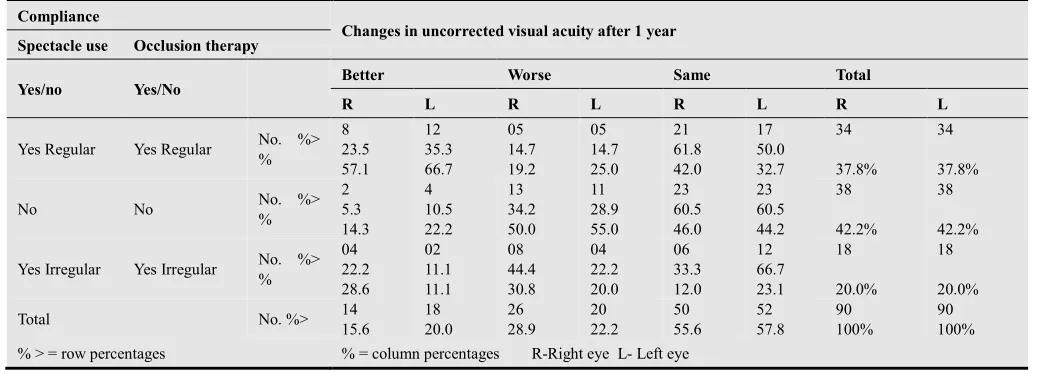
Table 17. Treatment compliance and uncorrected visual acuity after one year.
Compliance
Changes in uncorrected visual acuity after 1 year
Spectacle use Occlusion therapy
Yes/no Yes/No Better Worse Same Total
R L R L R L R L
Yes Regular Yes Regular No. %>
% 8 23.5 57.1 12 35.3 66.7 05 14.7 19.2 05 14.7 25.0 21 61.8 42.0 17 50.0 32.7 34 37.8% 34 37.8%
No No No. %>
% 2 5.3 14.3 4 10.5 22.2 13 34.2 50.0 11 28.9 55.0 23 60.5 46.0 23 60.5 44.2 38 42.2% 38 42.2%
Yes Irregular Yes Irregular No. %> % 04 22.2 28.6 02 11.1 11.1 08 44.4 30.8 04 22.2 20.0 06 33.3 12.0 12 66.7 23.1 18 20.0% 18 20.0%
Total No. %> 14
15.6 18 20.0 26 28.9 20 22.2 50 55.6 52 57.8 90 100% 90 100%
% > = row percentages % = column percentages R-Right eye L- Left eye
Out of 90 children with diagnosed Amblyopia who attended for follow up 57.8% had used spectacles and 42.2% were complete defaulters. Of 57.8% who used spectacles 37.8% had performed occlusion therapy as instructed. In the follow up it was found that, of those who did occlusion therapy 23.5% in their right eyes and 35.3% in left eyes showed and improvement in their visual acuity without correction compared to their initial visual acuity level. Visual
acuity remained same in 61.8% of right eyes and 50.0% of left eyes. (category “same” included the eyes with normal vision also)
Of the 38 non users 34.2% in the right eyes and 28.9% in the left eyes showed further deterioration of vision. It was same in 60.5%.
acuity or deteriorated vision. Improvement of vision was same only in 22.2% of right eyes and 11.1% of left eyes.
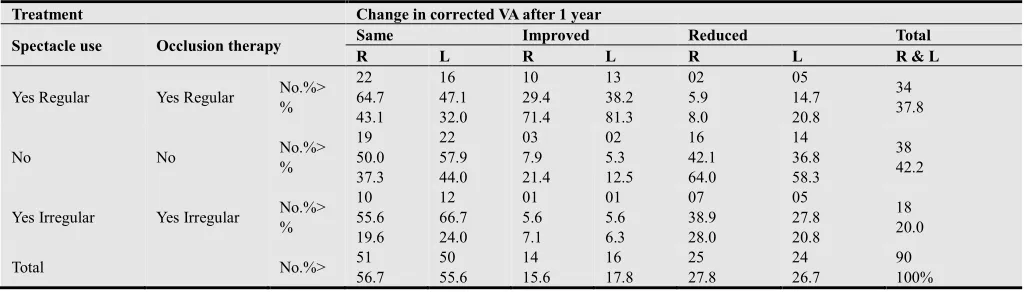
Table 18. Treatment and corrected visual acuity after one year
Treatment Change in corrected VA after 1 year
Spectacle use Occlusion therapy Same Improved Reduced Total
R L R L R L R & L
Yes Regular Yes Regular No.%>
% 22 64.7 43.1 16 47.1 32.0 10 29.4 71.4 13 38.2 81.3 02 5.9 8.0 05 14.7 20.8 34 37.8
No No No.%>
% 19 50.0 37.3 22 57.9 44.0 03 7.9 21.4 02 5.3 12.5 16 42.1 64.0 14 36.8 58.3 38 42.2
Yes Irregular Yes Irregular No.%>
% 10 55.6 19.6 12 66.7 24.0 01 5.6 7.1 01 5.6 6.3 07 38.9 28.0 05 27.8 20.8 18 20.0
Total No.%> 51
56.7 50 55.6 14 15.6 16 17.8 25 27.8 24 26.7 90 100%
% > = row percentages; % = column percentagesR-Right eye; L-Left eye
The table 18 shows what had happened to those Amblyopes who performed occlusion therapy after one year and the state of their corrected visual acity with spectacles. the Of all children who improved a majority. (71.4% of right eyes and 81.3% of left eyes) had used spectacles and
performed occlusion therapy regularly out of children who showed further deterioration of vision. Majority were either complete defaulters (64.0% of right eyes and 58.3% of left eyes) or irregular users (28.0% of right eyes and 20.8% of left eyes)
Table 19. State of Amblyopia after one yearDegree of Amblyopia after one year
Amblyopia Right eye Left eye Total no. of eyes
No. % No. % no. %
Improved 15 16.7 21 23.3 36 20.0
Same 28 31.1 30 33.3 58 32.2
Worse 23 25.6 24 26.7 47 26.1
No amblyopia initially 24 26.7 15 16.7 39 21.7
Total 90 90 180
The table 19 and 20 shows what has happened to the disease condition Amblyopia after the treatment At the laps of one year 20.0% showed improvement in their visual acuity level reducing the Amblyopia status. It remained same in 32.2% and deteriorated in 26.1%
Table 20. Improvement beyond 6/12 level to become non Amblyopic after one year
VA after correction Unilateral Bilateral Totaln=90
One eye Both eye
Beyond 6/12 10 02 00 1213.3%
12 children out of 90, achieved the non amblyopic status after one year. It was 13.3% of children who attended for follow up and 35.3% of children who did occlusion therapy will out of follow up cases.
This study highlights the importance of detecting refractive errors and Amblyopia in children and correcting them in time to enhance their development.
References
[1] Steven, E., Rubin, M.D., Leonard, B. & Nelson, M.B. (August 1993)Amblyopia diagnosis and management Pediatric ophthalmology, Vo1. 40, No.4, 727:35.
[2] Eugene, M., Helveston and Forest, D., (1984) Elvis pediatric ophthalmology practice- 2nd Edition, pg.77.
[3] Tommila, V., Tarakkanen, A.,(1981) incidence of loss of vision
in the healthy eye in amblyopia; British journal of ophthalmology, 65:575.
[4] * Jampolsky, A., Flom, B.C., Weymonth, FW and moses, LE, (1955) unequal correct visual acuity related to anisometropia, Arch ophthalmol 59; 893-905.
* Philips CI; Strabismus anisometropia and amblyopia; Brit. J. of ophthalmol. (1969) 43: 449-60.
* Von Noordeen GK.; Classification of amblyopia, American J. Ophthalmol (1967), 63:238-44.
[5] Werner, D.B. and Scott, W.E. (1985) Amblyopia case reports, bilateral Ametropic – Hypermetropic amblyopia J. Paediophthalmol. And Strabismus 22:203-5.
* Von Noorden, G.K. and Manmenee A.E. (1968) Clinical observations on stimulus deprivation amblyopia (Amblyopia ex anopsia) Am. J. Ophthalmol, 65:220-24.
[7] Jastrzebski, G.B., Hoyt, C.S.andMarg, E. (1984) Stimulus deprivation amblyopia in children: Sensitivity, plasticity, and elasticity (SPE) Arch. Ophthalmol. 102:1030-4.
[8] Doran, R.M.L. (1986) Assessment of vision in Amblyopia. Trans ophthalmol SOC. UK. 105.699-704.
[9] Flom, M.C., Weymouth, F.W. and Kahneman, D. (1963) Visual resolution and contour interaction. J. optometric. SOC. America; 53:1026-32.
[10] Atkinson, J., Pimm-Smith, E., Erans, C., Harding, G., and Braddick, O. (1986) Visual crowding in young children. Doc. Ophthal.Proc. 45: 201-3.
* Hilton, A.F. and Stanley, J.C. (1972) Pitfalls in testing children’s vision by the cheridangardiner single optotype method. Br. J. ophthalmol 56: 135-9.
[11] Bradley, A., Freeman, R.D. (1981) : Contrast sensitivity in anisometropic amblyopia. Incest ophthalmol Vis Sci, 21: 467-476.
* Campbell, F.W.: (1983) Why do we measure contrast sensitivity? Behav Brain Res 10: 87-97,
* Ingram RM, Walker C, Wilson JM, et al: (1986) Predictions of amblyopia and squint by means of refractions at age 1 year. Br J Ophthalmol 70: 12-15,
[12] Atkinson, J. and braddck, O. (1979) Assessment of vision in infants: Applications to Amblyopia. Trans ophthalmol SOC UK 99: 338-343.
* Atkinson, J. and Braddick O. (1983) Visual screening and photorefraction – The relation of refractive errors to strabismus and amblyopia. Behav Brain Res 10: 71-80. * Flynn, J. T. (1967) Spatial summation in amblyopia. Arch ophthalmol 78: 470-474.
[13] Marilya, A. Moller, M.A. (December 1983) The visually handicapped child. Paediatric clinics of North America, Vol. 30, No. 6, 1185-1193.
[14] Von Noorden, G.K., (1990) Examination of patients III, in bionocular vision ocular mortality. ed. 4 st. Louis, CV Mosby P 208.