Original Research Article
Forecasting road traffic accident deaths in India using seasonal
autoregressive integrated moving average model
Manikandan M.
1, Vishnu Prasad R.
2, Amit Kumar Mishra
1*,
Rajesh Kumar Konduru
1, Newtonraj A.
1INTRODUCTION
Road traffic accidents (RTA) are major public health problem to which inadequate attention has been usually paid. Road traffic accidents are leading cause of death among young people and death among those aged 15-29 years. According to World Health Organization (WHO) report more than 1.25 million people died and 50 million people were injured from RTAs every year.1 WHO report 2015 showed 90% of these deaths occurred in low and
middle income countries. If urgent action does not taken to prevent RTAs, road traffic injuries could be the seventh leading causes of deaths by the year 2030.2 In India, more than 1.2 million people die every year as a result of road traffic accidents. Among them 48% people were between 15 to 44 years. Males are more likely to be involved than females in road traffic accidents and 73% of all road traffic deaths occur among males. Approximately, 20-50 million people suffered from non-fatal injuries, many of them ultimately ends in disability.
ABSTRACT
Background: As per World Health Organization (WHO) report 1.24 million people die each year as a result of road traffic accidents (RTA) globally. A vast majority of 20-50 million people suffer from non-fatal injuries, many of them ultimately end in disability. Forecasting RTA deaths could help in planning the intervention at the right time in an effective way.
Methods: An attempt was made to forecast the RTA deaths in India with seasonal auto regressive integrated moving average (SARIMA) model. ARIMA model is one of the common methods which are used for forecasting variables as the method is very easy and requires only long time series data. The method of selection of appropriate ARIMA model has been explained in detail. Month wise RTA deaths for previous years data was collected from Govt. of India website. Data for 12 years (2001 to 2012) was extracted and appropriate ARIMA model was selected. Using the validated ARIMA model the RTA deaths are forecasted for 8 years (2013-2020).
Results: The appropriate SARIMA (1,0,0) (2,1,0) 12 model was selected based on minimal AIC and BIC values. The forecasted RTA deaths show increasing trend overtime.
Conclusions: There is an increasing trend in the forecasted numbers of road traffic accidental deaths and it also shows seasonality of RTA deaths with more number of accidents during the month of April and May in every years. It is recommended that the policy makers and transport authority should pay more attention to road traffic accidents and plan some effective intervention to reduce the burden of RTA deaths.
Keywords: Univariate time series, SARIMA, AIC, BIC, RTA, Forecasting
1
Department ofCommunity Medicine, Pondicherry Institute of Medical Sciences, Puducherry, India
2
Department of Health, Government of India, New Delhi, India
Received: 05 June 2018
Revised: 12 July 2018
Accepted: 13 July 2018
*Correspondence:
Dr. Amit Kumar Mishra, E-mail: [email protected]
Copyright: © the author(s), publisher and licensee Medip Academy. This is an open-access article distributed under the terms of the Creative Commons Attribution Non-Commercial License, which permits unrestricted non-commercial use, distribution, and reproduction in any medium, provided the original work is properly cited.
National Crime Records Bureau 2015 report showed, 53 cases of road accidents took place for every one hour, among them 17 persons were died. A total of 464674 cases of road traffic accidents were occurred 482289
persons were injured and 148707 were died.3
Urbanisation and industrialization in India has resulted in an increase in the number of motor vehicles usage. Increase in the number of vehicles on the road drastically elevated the RTAs and associated fatalities & disabilities among the RTAs victims. With the use of statistical methods & models it is possible to predict the future occurrence of road traffic accidental deaths with the available data. One of the most commonly used method to predict or forecast the future events based on the available data is time series analysis.4
Forecasting road traffic deaths are useful to monitor the effectiveness of various road safety policies that are implemented to minimize the occurrence of accidents.5 There is a need to forecast and understand the trend of road traffic accidents. Predictive models are very useful for identifying various related factors of road traffic accidental deaths.6,7 One of the most effective methods of forecasting future events is time series analysis.8 Autoregressive Integrated Moving Average (ARIMA) model is mostly commonly used predictive model for aggregated time series data and it was proposed by Box and Jenkins in 1976.9 The objective of the current study is to forecast Road Traffic Accidental Deaths in India with step by step explanation of autoregressive integrated moving average (ARIMA) model.
METHODS
To forecast the RTA deaths secondary analysis of the available data of India from reliable source was planned. The monthly RTA deaths data was available in Open Government Data (OGD) platform, Government of India.10 Data regarding RTA deaths from January 2001 to December 2012 (144 months) were obtained from the Open Government Data (OGD) platform, Government of India for the forecasting of RTA deaths.
A time series data is defined as a set of observations or events arranged in a chronological order, i.e., a sequence of observations or events usually ordered in time.11 The time series is used to draw patterns of changes in statistical data over regular intervals of time.12 In the current study the seasonal auto regressive integrated moving average (ARIMA) models was used to forecast the RTA deaths which was proposed by Box and Jenkins
in 1976.11 The ARIMA model consists of two
components in representing the behaviour of the observed time series data. In one component the current observation depends on its previous values which are explained by the autoregressive (AR) component of “p” order, whereas the second component, moving average (MA) component of “q” order, is used to describe a time series process as a linear function of current and previous random errors.13 In case seasonal components are
included in the model, then it is called as the seasonal auto regressive integrated moving average (SARIMA) model. A general form of SARIMA model is given as follows, t s Q q t D d s P
p(B) (B )(1B) (1B) Z (B) (B )a
Where, B =the backward shift operator, d and D are non-seasonal and non-seasonal order of differences respectively, and usually abbreviated as SARIMA (p,d,q) (P,D,Q) where (p,d,q) represents the model parameter for non-seasonal part and (P,D,Q) represents the model parameters for seasonal part. When there is no seasonal effect, a SARIMA model automatically reduces to pure ARIMA (p,d,q) and when the time series dataset is stationary a pure ARIMA reduces to ARMA (p,q). In the current study secondary data analysis was done for the time series data of road traffic accidents deaths in India from January 2001 to December 2012 with the seasonal component S=12, because the data was available month wise, 12 observation per year. Forecasting the event using time series model consists of three steps, model identification, parameter estimation and model validation.
In the first step, that is model identification the available data has to be checked for stationarity, in the current study the stationarity was checked by using auto correlation function (ACF) and Partial Auto Correlation Function (PACF). The ACF & PACF of RTA deaths showed that the time series data does not follow stationarity, to make it stationary we took the difference of historical time series data (d, D) into consideration. In the second step of Parameter estimation, taking different permutation and combination of (p, P, q, Q) with the difference of order (d, D) had taken earlier, the value of akaike information criterion (AIC) and bayesian information criterion (BIC) for different suggested models were estimated. As the criteria for the best model is lowest value of AIC &BIC, the appropriate model for the available data was selected as SARIMA (1,0,0) (2,1,0). Diagnostics checking or model validation is the last step in SARIMA/ ARIMA model analysis, the model adequacy was examined by residual Auto Correlation Function and Partial Auto Correlation Function. The forecast accuracy of the model was evaluated using Mean Absolute Percentage Error (MAPE) as follows.
n t t t t y y y n MAPE 1 ^ 1Where yt is the observed number of deaths;
^
t
y is the forecasted number of deaths at time point t.
RESULTS
Table 1 and Figure 1 show the month wise number of RTA deaths and the trend of RTA deaths in India (January 2001- December 2012) respectively.
In the current study, we developed a univariate time series seasonal autoregressive integrated moving average
model for predicting road traffic accident deaths in India from January 2013 to December 2020 by using the available data on RTA deaths. As per the data there was overall increase in number of deaths in December 2012 (>40%) as compared to January 2001 but the increase in RTA deaths was not uniform. The deaths were less in few specific months as compared other months in the same year.
Table 1: Month wise number of RTA deaths in India (January 2001- December 2012).
Years months
RTA deaths
Years months
RTA deaths
Years months
RTA deaths
Years months
RTA deaths
Years months
RTA deaths
Years months
RTA deaths
Jan-01 28799 Jan-03 29942 Jan-05 37619 Jan-07 38700 Jan-09 37647 Jan-11 40915
Feb-01 28465 Feb-03 27969 Feb-05 35843 Feb-07 35900 Feb-09 36472 Feb-11 38750
Mar-01 30048 Mar-03 28947 Mar-05 38346 Mar-07 38231 Mar-09 38453 Mar-11 41849
Apr-01 29806 Apr-03 28590 Apr-05 37062 Apr-07 40198 Apr-09 37650 Apr-11 38590
May-01 31956 May-03 32258 May-05 42022 May-07 41706 May-09 41519 May-11 44534
Jun-01 28565 Jun-03 30358 Jun-05 35060 Jun-07 37356 Jun-09 38984 Jun-11 40758
Jul-01 27132 Jul-03 29075 Jul-05 31221 Jul-07 35013 Jul-09 35352 Jul-11 38191
Aug-01 27527 Aug-03 29294 Aug-05 30961 Aug-07 35256 Aug-09 36343 Aug-11 36542
Sep-01 27641 Sep-03 29224 Sep-05 30211 Sep-07 34811 Sep-09 36196 Sep-11 36637
Oct-01 28103 Oct-03 30848 Oct-05 31829 Oct-07 36893 Oct-09 37398 Oct-11 38206
Nov-01 28412 Nov-03 30177 Nov-05 31746 Nov-07 36790 Nov-09 37013 Nov-11 38589
Dec-01 29262 Dec-03 31166 Dec-05 32477 Dec-07 37381 Dec-09 38256 Dec-11 39523
Jan-02 29022 Jan-04 32557 Jan-06 35731 Jan-08 38213 Jan-10 39067 Jan-12 41103
Feb-02 27895 Feb-04 32101 Feb-06 33517 Feb-08 36502 Feb-10 37482 Feb-12 39712
Mar-02 29872 Mar-04 32998 Mar-06 36693 Mar-08 38883 Mar-10 40447 Mar-12 40642
Apr-02 30486 Apr-04 32302 Apr-06 36138 Apr-08 40491 Apr-10 39612 Apr-12 41127
May-02 33585 May-04 33801 May-06 39555 May-08 40507 May-10 42546 May-12 41892
Jun-02 30561 Jun-04 31958 Jun-06 35500 Jun-08 36555 Jun-10 39846 Jun-12 40091
Jul-02 28936 Jul-04 30427 Jul-06 33352 Jul-08 35257 Jul-10 36779 Jul-12 38181
Aug-02 28579 Aug-04 30225 Aug-06 33345 Aug-08 35521 Aug-10 35901 Aug-12 37402
Sep-02 28350 Sep-04 31320 Sep-06 33503 Sep-08 34812 Sep-10 35553 Sep-12 36066
Oct-02 29371 Oct-04 31634 Oct-06 35033 Oct-08 36919 Oct-10 37486 Oct-12 38166
Nov-02 29139 Nov-04 32060 Nov-06 34391 Nov-08 35340 Nov-10 38469 Nov-12 38555
Dec-02 30198 Dec-04 33140 Dec-06 36668 Dec-08 36468 Dec-10 38569 Dec-12 40479
As we have earlier mentioned that SARIMA model consisted of three steps such as model identification, parameter estimation, diagnostic checking or model validation of the time series data, the current study was gone through the three steps.
Model identification: Figure 1 shows the time distribution of RTA death cases, more number of accidents deaths occurred during the month of April & May of every year (2001-2012). Stationarity was also checked by ACF and PACF of RTA deaths which showed that the data was not stationary and also irregularly increase in the number of accident deaths with a particular season of a year (seasonality). Stationarity means the historical time series data vary over time only around a constant mean and constant variance. Hence for the available data was not fit for SARIMA model as it is applicable only the time series data which is stationary. To stabilize the mean and variance of monthly road traffic deaths, first order of difference of historical time series data was considered. Here, first order difference was enough to reach the stationarity, only for seasonality (d=0, D=1).
Parameter estimation: After making the data stationary and confirming the value of difference of order for non-seasonality and non-seasonality (d=0, D=1), different models were suggested by permutation and combination of different values of (p, P, q, Q) and the value of Akaike Information Criterion (AIC) and Bayesian Information Criterion (BIC) were estimated. As the criteria for the
best model to fit for the available data is the model with lowest AIC (2246.13) &BIC (2260.55) the best model fit for the current data was selected as SARIMA (1,0,0) (2,1,0)12 (Table 2).
Table 2: Proposed SARIMA models with AIC and BIC values.
Models AIC BIC
SARIMA (0,0,1) (0,1,1) 2273.29 2284.82
SARIMA (0,0,1) (1,1,1) 2265.92 2280.33
SARIMA (1,0,0) (1,1,0) 2249.03 2262.56
SARIMA (1,0,0) (2,1,0) 2246.13 2260.55
SARIMA(1,0,1) (2,0,1) 2452.04 2472.83
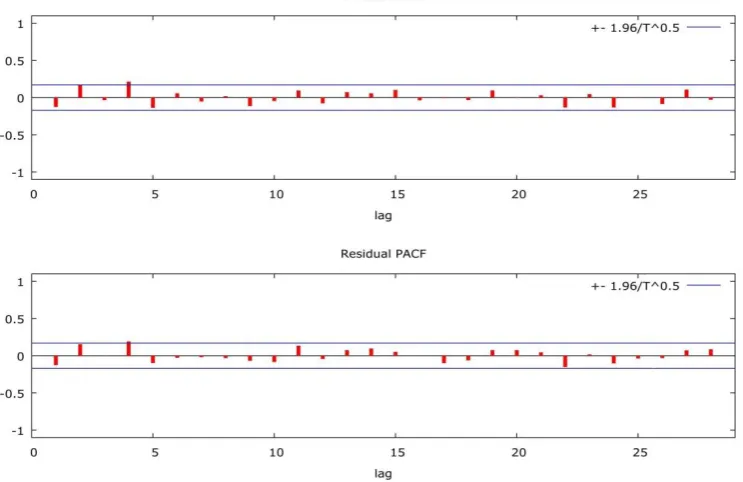
Diagnostic checking or model validation: The ACF and PACF of residual of SARIMA (1, 0, 0) (2,1,0)12 model is
presented in Figure 2. It showed residual of ACF and PACF are nearly zero, this indicates that the residuals did not vary from zero mean and variance. Adequacy of the SARIMA (1, 0, 0) (2,1,0)12 was good and the model was
appropriate to forecast the RTA deaths based on available data. Based on the selected SARIMA (1, 0, 0) (2,1,0)12
model the number of road traffic accident deaths has been forecasted up to the year 2020. The performance of the forecasting was examined by Mean Absolute Percentage Error (MAPE) which is an indicator for the accuracy of the forecast by considering the real deaths and forecasted deaths in the sample period. The MAPE estimated for the current model developed and used was 2.293 which was minimal and acceptable.
Figure 2: Residual ACF and PACF of RTA deaths.
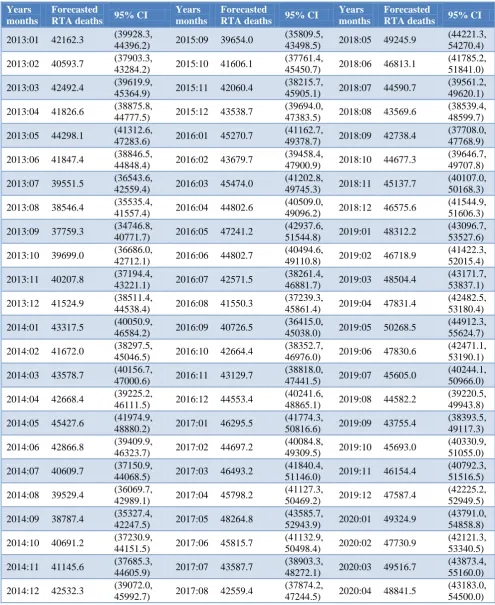
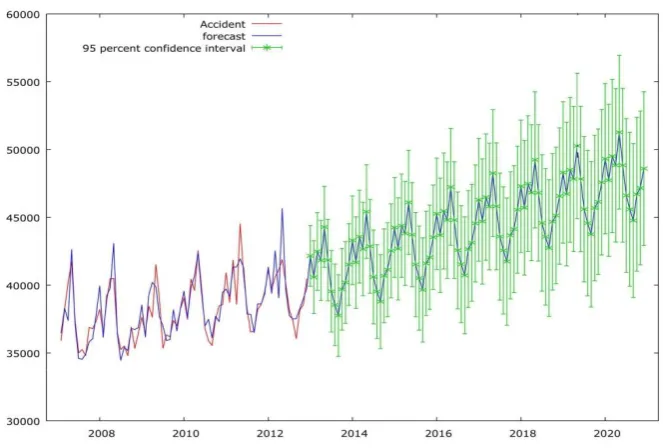
The forecasted RTA deaths [Table 3, Figure 3] shows a gradual increase in number of deaths with seasonality of deaths. Figure 3 shows the forecasted RTA deaths in
overlapping with the actual value in the sample period with a negligible difference. There will be a 20% increase in number of deaths in December 2020 as compared to December 2012. The confidence interval for 2020 is very
large as the forecasted deaths are in months and the forecasting period is for 8 years (2013-2020) still it could give an idea on the burden of road traffic accident deaths in India.
Table 3: Post sample forecasted RTA deaths with 95% confidence intervals.
Years months
Forecasted
RTA deaths 95% CI
Years months
Forecasted
RTA deaths 95% CI
Years months
Forecasted
RTA deaths 95% CI
2013:01 42162.3 (39928.3,
44396.2) 2015:09 39654.0
(35809.5,
43498.5) 2018:05 49245.9
(44221.3, 54270.4)
2013:02 40593.7 (37903.3,
43284.2) 2015:10 41606.1
(37761.4,
45450.7) 2018:06 46813.1
(41785.2, 51841.0)
2013:03 42492.4 (39619.9,
45364.9) 2015:11 42060.4
(38215.7,
45905.1) 2018:07 44590.7
(39561.2, 49620.1)
2013:04 41826.6 (38875.8,
44777.5) 2015:12 43538.7
(39694.0,
47383.5) 2018:08 43569.6
(38539.4, 48599.7)
2013:05 44298.1 (41312.6,
47283.6) 2016:01 45270.7
(41162.7,
49378.7) 2018:09 42738.4
(37708.0, 47768.9)
2013:06 41847.4 (38846.5,
44848.4) 2016:02 43679.7
(39458.4,
47900.9) 2018:10 44677.3
(39646.7, 49707.8)
2013:07 39551.5 (36543.6,
42559.4) 2016:03 45474.0
(41202.8,
49745.3) 2018:11 45137.7
(40107.0, 50168.3)
2013:08 38546.4 (35535.4,
41557.4) 2016:04 44802.6
(40509.0,
49096.2) 2018:12 46575.6
(41544.9, 51606.3)
2013:09 37759.3 (34746.8,
40771.7) 2016:05 47241.2
(42937.6,
51544.8) 2019:01 48312.2
(43096.7, 53527.6)
2013:10 39699.0 (36686.0,
42712.1) 2016:06 44802.7
(40494.6,
49110.8) 2019:02 46718.9
(41422.3, 52015.4)
2013:11 40207.8 (37194.4,
43221.1) 2016:07 42571.5
(38261.4,
46881.7) 2019:03 48504.4
(43171.7, 53837.1)
2013:12 41524.9 (38511.4,
44538.4) 2016:08 41550.3
(37239.3,
45861.4) 2019:04 47831.4
(42482.5, 53180.4)
2014:01 43317.5 (40050.9,
46584.2) 2016:09 40726.5
(36415.0,
45038.0) 2019:05 50268.5
(44912.3, 55624.7)
2014:02 41672.0 (38297.5,
45046.5) 2016:10 42664.4
(38352.7,
46976.0) 2019:06 47830.6
(42471.1, 53190.1)
2014:03 43578.7 (40156.7,
47000.6) 2016:11 43129.7
(38818.0,
47441.5) 2019:07 45605.0
(40244.1, 50966.0)
2014:04 42668.4 (39225.2,
46111.5) 2016:12 44553.4
(40241.6,
48865.1) 2019:08 44582.2
(39220.5, 49943.8)
2014:05 45427.6 (41974.9,
48880.2) 2017:01 46295.5
(41774.3,
50816.6) 2019:09 43755.4
(38393.5, 49117.3)
2014:06 42866.8 (39409.9,
46323.7) 2017:02 44697.2
(40084.8,
49309.5) 2019:10 45693.0
(40330.9, 51055.0)
2014:07 40609.7 (37150.9,
44068.5) 2017:03 46493.2
(41840.4,
51146.0) 2019:11 46154.4
(40792.3, 51516.5)
2014:08 39529.4 (36069.7,
42989.1) 2017:04 45798.2
(41127.3,
50469.2) 2019:12 47587.4
(42225.2, 52949.5)
2014:09 38787.4 (35327.4,
42247.5) 2017:05 48264.8
(43585.7,
52943.9) 2020:01 49324.9
(43791.0, 54858.8)
2014:10 40691.2 (37230.9,
44151.5) 2017:06 45815.7
(41132.9,
50498.4) 2020:02 47730.9
(42121.3, 53340.5)
2014:11 41145.6 (37685.3,
44605.9) 2017:07 43587.7
(38903.3,
48272.1) 2020:03 49516.7
(43873.4, 55160.0)
2014:12 42532.3 (39072.0,
45992.7) 2017:08 42559.4
(37874.2,
47244.5) 2020:04 48841.5
(43183.0, 54500.0)
Years months
Forecasted
RTA deaths 95% CI
Years months
Forecasted
RTA deaths 95% CI
Years months
Forecasted
RTA deaths 95% CI
2015:01 44255.6 (40579.0,
47932.2) 2017:09 41740.2
(37054.7,
46425.7) 2020:05 51281.2
(45615.9, 56946.5)
2015:02 42680.1 (38910.1,
46450.0) 2017:10 43674.6
(38989.0,
48360.3) 2020:06 48842.3
(43173.9, 54510.7)
2015:03 44387.7 (40576.5,
48199.0) 2017:11 44135.1
(39449.4,
48820.8) 2020:07 46617.0
(40947.3, 52286.7)
2015:04 43818.2 (39988.5,
47647.9) 2017:12 45564.5
(40878.8,
50250.3) 2020:08 45593.5
(39923.1, 51263.8)
2015:05 46105.3 (42267.3,
49943.3) 2018:01 47300.4
(42422.1,
52178.7) 2020:09 44767.2
(39096.5, 50437.8)
2015:06 43724.5 (39882.8,
47566.2) 2018:02 45708.4
(40745.8,
50671.1) 2020:10 46704.4
(41033.7, 52375.2)
2015:07 41528.1 (37684.7,
45371.5) 2018:03 47486.2
(42486.1,
52486.4) 2020:11 47165.4
(41494.6, 52836.2)
2015:08 40526.8 (36682.6,
44370.9) 2018:04 46822.3
(41805.3,
51839.2) 2020:12 48598.9
(42928.0, 54269.7)
Figure 3: Forecasted RTA deaths in sample and post-sample period.
DISCUSSION
The available data on RTA deaths shows that RTA is a major public health problem in India which is avoidable to some extent. The trend of RTA deaths in India has a seasonal pattern. The number of deaths are high in the months of April & May every year. If the expected number of deaths in a month is known then the concerned authority can plan the intervention accordingly and it will also help for preparedness. The forecasting of number of cases/events is possible by many statistical methods including SARIMA model. In the current study, SARIMA model has been used and secondary data analysis was done of the available data as per the required steps in SARIMA. The forecasting can be done for two
CONCLUSION
In the current study, SARIMA was developed to predict the road traffic accident deaths and the appropriate SARIMA (1,0,0) (2,1,0)12 model was selected based on
the minimal Akaike Information Criteria and Bayesian Information Criteria (BIC) values. The forecasted road traffic accident deaths showed an increasing trend of RTA deaths in upcoming months/years. Also, the results reveal that more number of accidents deaths occurred during the month of April and May of every year (2001-2012). This study showed the increase burden of RTA deaths in future and recommends the policy makers and transport authority to pay more attention on preventive measures for road traffic accidents so that the burden can be reduced and more lives can be saved.
Funding: No funding sources Conflict of interest: None declared Ethical approval: Not obtained
REFERENCES
1. World Health Organization. Global Status report on road safety. Geneva: WHO; 2015.
2. World Health Organization. World Health Statistics 2017. Geneva: WHO; 2017.
3. National Crime Records Bureau Report: Accidental
Deaths and Suicide in India, 2014. New Delhi; Government of India.
4. Shumway RH. Applied Statistical Time Series
Analysis. In: Englewood Cliffs, NJ: Prentice-Hall; 1988.
5. Goel R. Modelling of road traffic fatalities in India. Accident Analysis and Prevention. 2018;112:105– 15.
6. Shahrokh YC, Fatemeh RT, Reza M, Alireza R. A Time Series Model for Assessing the Trend and Forecasting the Road Traffic Accident Mortality. Arch Trauma Res. 2016;5(3):36570.
7. Dalbir S, Satinder P. Singh, Kumaran M, Sonu Goel. Epidemiology of road traffic accident deaths in children in Chandigarh zone of North West India. Egyptian J Forensic Sci. 2016;6:255–60.
8. Mutang K. Time Series Analysis of Road Traffic
Accidents in Zimbabwe. Int J Statistics
Applications. 2015;5(4):141-9.
9. Box GEP, Jenkins G. Time Series Analysis,
Forecasting and Control. San Francisco, CA: Holden Day; 1970.
10. Open Government Data (OG). Available at:
https://data.gov.in/catalog/stateut-wise-details-road-accident-deaths-mode-transport. Accessed on 2 February 2018.
11. Zhang GP. Time series forecasting using a hybrid
ARIMA and neural network model.
Neurocomputing. 2003;50:159-75.
12. Zhang X, Pang Y, Mengjing C, Lorann S,Huiyun X.
Forecasting mortality of road traffic injuries in China using seasonal autoregressive integrated
moving average model. Annals Epidemiol.
2015;25(2):101-6.
13. Razzaghi A, Bahrampour A, Baneshi MR, Zolala F.
Assessment of trend and seasonality in road accident Data: An Iranian case study. Int J Heal Policy Manag. 2013;1(1):51-5.
Cite this article as: Manikandan M, Vishnu PR,
Mishra AK, Konduru RK, Newtonraj A.Forecasting