A Case Study Improvement of a Testing Process by Combining Lean
Management, Industrial Engineering and Automation Methods
Simon Withers
1, Jose Arturo Garza-Reyes
2,*, Vikas Kumar
3, Luis Rocha-Lona
41Turbo Power Services, Bardon, UK.
2Centre for Supply Chain Improvement, The University of Derby, Derby, UK. 3Dublin City University Business School, Dublin City University, Dublin, ROI. 4
Business School, National Polytechnic Institute of Mexico, Mexico City, Mexico. Received 04 April 2013; received in revised form 25 April 2013; accepted 26 May 2013
Abstract
Increasingly competitive market environments have forced not only large manufacturing, but also small-and-medium size enterprises (SME) to look for means to improve their operations in order to increase competitive strength. This paper presents an adaptation and adoption by a UK SME engineering service organisation, of lean management, industrial engineering, and automation metods developed within larger organisations. This SME sought to improve the overall performance of one of its core testing processes. An exploratory analysis, based on the lean management concept of “value added” and work measurement technique “time study”, was developed and carried out in order to understand the current performance of a testing process for gas turbine fuel flow dividers. A design for the automation of some operations of the testing process was followed as an approach to reduce non-value added activities, and improve the overall efficiency of the testing process. The overall testing time was reduced from 12.41 to 7.93 hours (36.09 percent) while the man hours and non-value added time were also reduced from 23.91 to 12.94 hours (45.87 percent) and from 11.08 to 6.69 (39.67 percent) hours respectively. This resulted in an increase in process efficiency in terms of man hours from 51.91 to 61.28 percent. The contribution of this paper resides in presenting a case study that can be used as a guiding reference for managers and engineers to undertake improvement projects, in their organisations, similar to the one presented in this paper.
Keywords: lean management, industrial engineering, automation technology, value added, process efficiency
1.
Introduction
Garza-Reyes et al. [1] comment that fiercely competitive markets and environment have forced, in particular, manufacturing organisations to constantly seek improvements for their operation. Arguably, this is not only the case for manufacturing but also for engineering service organisations. Turbo Power Services (TPS), part of the Osborne Engineering (OEL) Group, is an engineering service and overhaul facility based in Bardon, Leicestershire, UK. It provides an overhaul and repair service for industrial gas turbine fuel system components as fitted to turbines used in power stations, and also to generate power to oil and gas pumping stations, refineries, and offshore oil rigs. As a strategy to remain internationally competitive and increase its operational capacity, TPS is continually looking for methods to improve its overall operational efficiency. Johnston et al. [2], for example, suggest that failing to improve operational efficiency, at least as fast as competitors, will result in a service which falls short of customer expectations.
Flow dividers are one of the key products repaired by and tested at TPS. Although natural gas is the primary fuel burnt by gas turbines to produce power, many of them have a secondary back up fuel system. Gas turbines can also run on distillate fuel not dissimilar to diesel. To facilitate this, gas turbines have a liquid fuel system. This liquid fuel system is also employed where gas is unavailable. Flow dividers (shown in Fig. 1) are one of the components within this system with the role of dividing the fuel supply from the main fuel pump into equal divisions for distribution to the burner nozzles as shown in Fig. 2.
Fig. 1 Flow divider Fig. 2 Flow divider function schematic
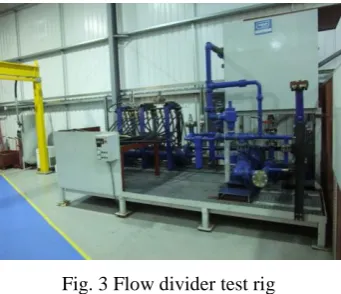
Particularly, the testing process of flow dividers is of strategic importance for TPS. This test consists of simulating the flow dividers function within a gas turbine fuel system. In this case, calibration fluid simulating fuel oil is pumped into the flow dividers as it would be in service. The flow rate discharged from each flow divider port is measured under three sets of conditions. The first set of data is collected when the flow dividers are tested under normal service conditions. The second condition simulates excessive flow through one gas turbine burner to test the flow dividers ability to control this flow. Finally, the third condition simulates an extreme service situation of a restricted burner flow. This is tested at an “extreme” elevated pressure that would not normally occur, but it is still important to evaluate whether the flow divider fails in an unexpected situation. Each set of data is collected at low fuel flow conditions simulating the gas turbine start schedule, and then at a high fuel flow rate simulating full power running of the turbine. The fuel flow distribution between discharge ports must lie within specification for the flow divider to “pass” the test.
Fig. 3 Flow divider test rig
In line with a parallel TPS objective to upgrade all of its test rigs and improving the quality of data captured, this project also aimed at demonstrating where the automation of the testing process operations would lead to the reduction of waste and increased efficiency. To achieve this, a time study was performed through direct observations and time measurement, with the objective of determining the standard times of all the operations that comprise the flow dividers testing process and define their contribution in terms of some performance factors, namely: (1) value added/non-value added, (2) process efficiency in terms of man hours required to run the testing process, and (3) overall testing time (i.e. lead time). Once the time study was completed, these performance factors were used as a benchmark to determine the success of the improvement project. Finally, a design for the automation of some operations of the flow dividers testing process was produced as an approach to reduce non-value added time, man hours and overall testing time, thus improving the testing process efficiency.
2.
Literature
Review
Two key areas of study in operations management were identified as essential to achieve the objectives of this project, lean management (LM) and industrial engineering (IE). LM and IE are recognised as efficient methods of improvement. In particular, LM is a systematic approach that focuses on waste reduction through continual improvement, and the removal of non-value added activities [3]. Due to its strong focus on waste elimination, lean management helps organisations to become more competitive in the market by increasing efficiency and customer satisfaction, decreasing costs and inefficiencies in processes [4], as well as reducing inventories, cycle times and lead times [5, 6, 7]. Although there is evidence that some of the lean principles and tools have been around for a long time since before the industrial revolution, Toyota Motor Corporation has been credited with the development of this approach, which was initially known under the name of “Toyota Production System” [8]. Later, the term “lean manufacturing” was popularised in the Western world by the book The Machine that Changed the World written by Womack et al. [9]. According to Garza-Reyes et al. [10], “nowadays the terms Toyota production system, lean production, lean manufacturing and lean management are interchangeably used by authors and practitioners”. In the case of this paper and the study presented, the term lean management has been adopted when referring to this approach.
On the other hand, industrial engineering aims for similar improvements as lean management but through more traditional methods which include motion and time studies, and scientific management [11]. In this context, IE is concerned with the design, improvement, and installation of integrated systems of men, materials, and equipment [12]. IE was born with the industrial revolution and the work of who now is known as the “father of industrial engineering and scientific management”, Frederick W. Taylor. From Taylor’s work two separate, but they are related, fields of study emerged, method engineering and work measurement [3]. Method engineering is that aspect of industrial engineering related to the planning and definitions of more effective working practices and approaches [13], whereas work measurement is concerned with the time taken to perform a job [3]. In terms of this improvement project, concepts and principles of both method engineering and work measurement were employed. In particular, IE methods were selected as the primary data collection tool as they have a broad range of application [14]. IE uses a scientific approach to identify and solve problems. It collects factual information regarding the problem, analyses the problem, prepares alternative solutions taken into account all the internal and external constraints, and selects the best solution for implementation. Specific IE tools relevant to this project included: analysis sheets, flow process charts, established shop-operating burdens, and man power availability charts.
[16]. Rodgers [13] states that the first stage of methods engineering is not the collection of processes and times, but argues that there is a more important stage that must be carried out before a time study is conducted. The product worked upon, the equipment used, and the working method must all be standardised in order to ensure that a standard time can be determined [13]. Presgrave [17] supports this argument by stating that until methods have been standardised, standard times are meaningless.
In line with these arguments, recording and arranging each process operation was undertaken to create a reference datum. It was noted that as the flow dividers testing process had not been subjected to any previous analysis or improvement initiative, the operations were not standardised. Through the course of this project, Mead’s [16] video method of data capture enabled the main researcher to capture an “exact” record of the working patterns and motions performed. However, the authors argue, through first hand experience, that although this method is reliable, it still had the disadvantage of being time consuming, taking many hours to manually transfer the captured data into a useful form such as a process chart. One lean tool utilised in this project was value stream mapping (VSM). VMS is the process of identifying and charting the flows of information, processes, and physical goods with the objective of improving visualisation of material and information flows, facilitating the identification and elimination of waste through the prioritisation of continuous improvement activities [18]. VSM is primarily used on a complex large scale to analyse from the point of order, to the point of delivery [19]. By combining it with the more traditional IE method of operational analysis using a process chart, this project developed a simplified method of analysis which is more suitable to analysing a single process within a smaller organisation. The process was captured and mapped on a process chart and the lean method of identifying waste through a value added analysis [18] was applied. Within the lean management context, waste is considered as any activity which consumes resources but does not add value to the product or service. As process activity times are known, the non-value added time can be expressed as a percentage of the total lead time. Non-value added activities can be further categorised into those adding no value to the product but that are necessary in order to enable a value adding activity, and those which are avoidable and can be removed from the process. Non-value added activities according to lean management include: (1) unnecessary motion, (2) excess inventory, (3) waiting, (4) quality defects, (5) over processing/incorrect processing, (6) unnecessary transport, (7) over production, and (8) unused staff creativity [20, 21]. This projected worked towards removing, or at least reducing these types of activities from the flow divider testing process operations.
Finally, another discipline, associated with large manufacturing plants, which interacts with LM and IE as a potential solution to lead time and waste reduction as well as providing a method for adopting lean principles is automation. In this context, wasteful operations can be reduced or removed from processes through the application of automation. According to Wolovich [22], automation aims to replace a manual process, or make a new process possible, through the use of a system of technology functioning according to a mathematical model. Standardisation, leading to higher quality, is common within automation, where machines follow programmed sequences without deviating from the standard process path. Quality checks, visual displays, and maintenance indicators can all be “built-in”. All of these characteristics can be found within IE and LM theories. Additionally, improved productivity, enhanced product quality, and improvement in the status of workers [23], are all common goals of LM, IE and automation.
3.
Investigation and Analysis of Current Flow Testing Process Performance and Automation
3.1. Investigation of Current Process
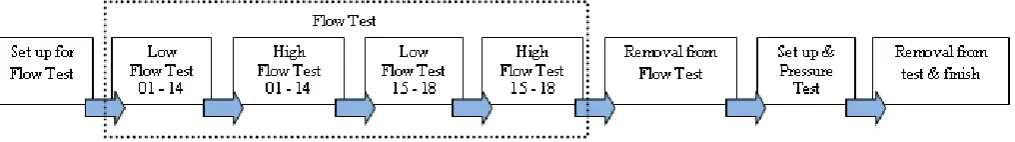
recognises value stream mapping as one of the tools developed and used by larger manufacturing enterprises such as Toyota, where it is used to analyse material flow within large production lines. In the case of this study, VSM was simplified and adapted to enable the analysis of a single process. The captured data was plotted into process charts and summarised in time study tables for its analysis. In line with the systematic approach promoted by IE [14], the overall testing process was divided into five stages (i.e. operations) for a more effective and simple analysis. Furthermore, the flow test operation was divided into four sub-stages (i.e. sub-operations) to identify the capacity limitations of the current flow test rig to only process a maximum of fourteen parts at a time. This helped to standardise the flow divider testing process as suggested by Rodgers [13] and Presgrave [17], to then determine the specific average standard times for every operation and individual activities that comprised it. The flow dividers testing process, its operations and its sub-operations are illustrated in Fig. 4 and briefly described below.
Note: 01 – 14 and 15 – 18 refer to different elements tested of flow dividers
Fig. 4 Test rig operations and sub-operations
Set up for flow test – Before the testing of flow dividers can commence, they are lifted into position and connected to the test rig by using appropriate hydraulic fittings, hoses, and sensors. This operation was determined, based on the IE methods followed, to consist of a total of fifteen manual activities, one material handling activity, and one decision activity, all of which were performed by up to three operators.
Flow test – Once the flow test set up operation is complete, the flow testing starts. The flow test subjects the flow dividers’ eighteen elements to two different flow rates which are low flow (LF) and high flow (HF). In the first stage of the flow test, elements 1 to 14 are tested at low flow. This sub-operation consists of six manual activities which are performed by three operations. Then, the same elements of the flow divider are subjected to a test at high flow. This sub-operation consists of seven manual activities which are also performed by the same three operators. Once the low and high flow tests are performed on elements 1 to 14, then the same two tests are carried out but in this case for elements 15 to 18. The low flow test of elements 15 to 18 consists of seven manual activities performed by up to three operators while the high flow test is comprised of nine manual activities carried out by the same operators.
Removal from flow test – Once the testing of the flow divider is complete, the next part of the process is to remove the unit from the flow test rig. To do this, the flow divider must be drained of its test fluid and all fittings not required for the next stage of testing removed. This operation consists of six manual activities and a material handling activity where the flow divider is lifted from the test rig. This operation is carried out by up to three operators.
Set up and pressure test – Similarly as with the set up for flow test, a set up operation must be performed in order to prepare the flow dividers for a pressure test. Thus, the flow dividers are once more lifted into position and connected to the pressure test rig by using the required hydraulic fittings, hoses, and sensors. This operation consists of eight manual activities and one material handling activity, which are carried out by up to two operators.
and a test certificate printed for the customer. Three manual, two material handling, and one decision activities, performed by up to two operators, comprise this operation.
3.2. Analysis of Current Process
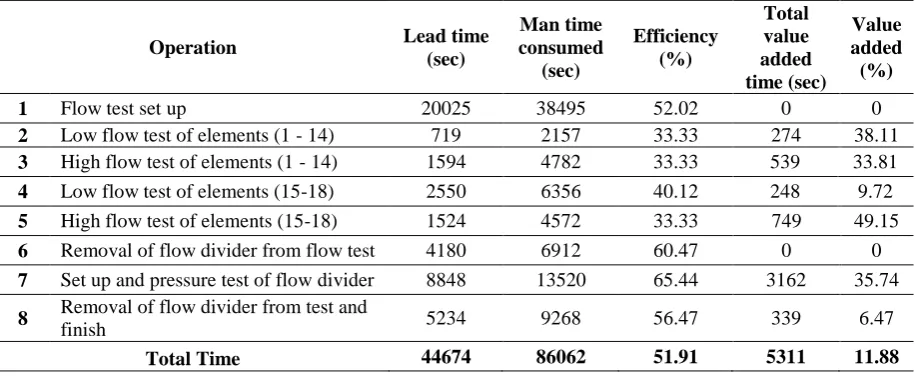
Value added analysis, another method developed within larger organisations and adopted in this project, was then conducted based on the time study data obtained from the initial investigation of the test process presented in Section 3.1. Band [24], Gale [25] and Naumann [26] advocate the concept of “value added” as a strategy for achieving competitive advantage and have also advised organisations on designing and improving processes so that they create value for their customers. In this case, the value added analysis performed helped to identify unnecessarily repeated activities within every operation and to determine which of those activities could be removed, for example, if they were classified as non-value added. A summary of the findings is presented in Table 1. In this table, lead time referred to the total average time required to perform the operation, which was calculated by adding all the individual times of the activities that comprised every operation. On the other hand, man time consumed measured the average amount of man time dedicated to every operation and activity. For example, the total time to perform operation 1 (i.e. flow test set up) was 20025 seconds; however, since up to three operators were needed to carry out the activities that comprised it, more man time was required to complete this operation. The operation’s efficiency and percentage of value added were calculated by using Eq. 1 and Eq. 2 respectively.
Table 1 Summary of initial findings
Operation Lead time
(sec)
Man time consumed
(sec)
Efficiency (%)
Total value added time (sec)
Value added (%)
1 Flow test set up 20025 38495 52.02 0 0
2 Low flow test of elements (1 - 14) 719 2157 33.33 274 38.11
3 High flow test of elements (1 - 14) 1594 4782 33.33 539 33.81
4 Low flow test of elements (15-18) 2550 6356 40.12 248 9.72
5 High flow test of elements (15-18) 1524 4572 33.33 749 49.15
6 Removal of flow divider from flow test 4180 6912 60.47 0 0
7 Set up and pressure test of flow divider 8848 13520 65.44 3162 35.74 8 Removal of flow divider from test and
finish 5234 9268 56.47 339 6.47
Total Time 44674 86062 51.91 5311 11.88
% Operation Efficiency = Operation Lead Time x 100 Man Time Consumed
(1)
% Value added = Value Added Time x 100
Operation Lead Time
(2)
3.3. Automation of Testing Process Operations
that an operator should be able to override a machine and stop it as humans are effective at improvising, correcting and making flexible decisions as required by a process.
In order to maximise efficiency gains, mechanical upgrades were also applied to the test rig to complement its automation and enable the removal of non-value added operations. All control and data equipment was capable of input/output to the computer interface. The existing control and selector valves, along with the existing fluid pressure gauges, were replaced with versions that were connected to the computer interface, enabling automation. The value added analysis presented in Section 3.2 highlighted that some operations were unnecessarily duplicated due to a limitation in the number of selector valves fitted to the test rig. For this reason, the number of valves (i.e. 14) had to be increased to 18 to match the number of flow divider discharge ports, and to remove the requirement of halting the flow test to change over flow hoses due to the shortage of valves. In order to remove the requirement to disconnect, transfer, and reconnect the flow divider to another test stand for pressure test, operations all identified as non-value added, the test rig pipe work and fittings pressure rating had to be increased where required. During this upgrade it was recommended that pipe work and fittings be upgraded to stainless steel to prevent contamination due to corrosion.
4.
Results Summary
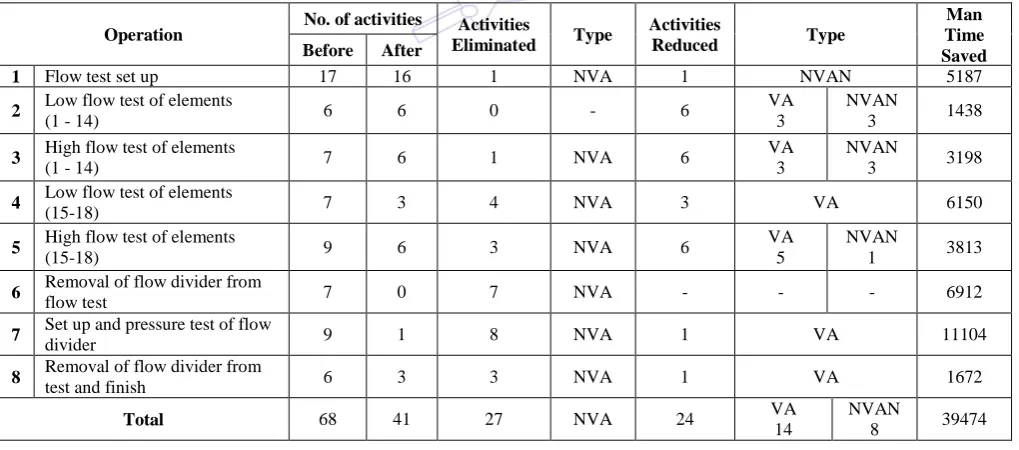
The implementation of the proposed automation upgrades to the flow test rig helped to remove non-value added activities from the testing process operations, reduce the test process lead time, and man hours consumed. The results are presented in Table 2. This table indicates, for example, that the activities in the flow test set up operation were reduced from seventeen to sixteen, and that the eliminated activity was a non-value added one. Furthermore, this table also indicates that a non-value added but necessary activity was also reduced in terms of man time. On the other hand, no activities were eliminated in the low flow test (1-14) operation. However, the man time needed to carry out all the six activities that comprise this operation were reduced. This provided a total reduction of 1438 seconds in this operation. From the six activities reduced, three were value added and three were non-value added but necessary. Table 2 also presents similar information regarding the rest of the operations of the flow dividers testing process.
Table 2 Summary of improvements in every operation after testing process automation
Operation No. of activities Activities
Eliminated Type
Activities
Reduced Type
Man Time Saved Before After
1 Flow test set up 17 16 1 NVA 1 NVAN 5187
2 Low flow test of elements
(1 - 14) 6 6 0 - 6
VA 3
NVAN
3 1438
3 High flow test of elements
(1 - 14) 7 6 1 NVA 6
VA 3
NVAN
3 3198
4 Low flow test of elements
(15-18) 7 3 4 NVA 3 VA 6150
5 High flow test of elements
(15-18) 9 6 3 NVA 6
VA 5
NVAN
1 3813
6 Removal of flow divider from
flow test 7 0 7 NVA - - - 6912
7 Set up and pressure test of flow
divider 9 1 8 NVA 1 VA 11104
8 Removal of flow divider from
test and finish 6 3 3 NVA 1 VA 1672
Total 68 41 27 NVA 24 VA
14
NVAN
8 39474
NVA: Non-value added; NVAN: Non-value added but necessary; VA: Value added
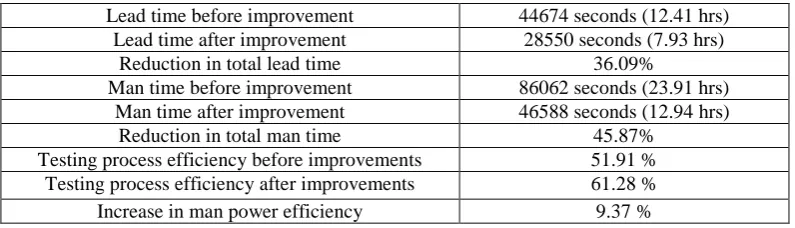
An important additional gain was the reduction of the testing lead time to within one working day. As shown in Table 3, the process lead time was reduced from 12.41 to 7.93 hours (36.09 percent). As TPS is not a 24 hours facility, where a night time shuts down for 14.5 hours (i.e. 16.00 to 07.30), the reduction in lead time can be considered from 26.91 to 7.93 hours (70.53 percent). The power generation industry often calls for its suppliers to react to extremely short lead times in the event of a gas turbine breakdown. Being able to complete any process within one working day represents a major strategic and competitive advantage for TPS.
Table 3 Summary of overall improvements after process automation improvements Lead time before improvement 44674 seconds (12.41 hrs) Lead time after improvement 28550 seconds (7.93 hrs)
Reduction in total lead time 36.09%
Man time before improvement 86062 seconds (23.91 hrs) Man time after improvement 46588 seconds (12.94 hrs)
Reduction in total man time 45.87%
Testing process efficiency before improvements 51.91 % Testing process efficiency after improvements 61.28 %
Increase in man power efficiency 9.37 %
Table 4 Summary of total non-value added reduction after process automation improvements Non-value added time before improvement 39363 seconds (10.93 hrs)
Non-value added time after improvement 24069 seconds (6.69 hrs)
Reduction in non-value added time 38.85 %
% Value added before improvement 11.88 %
% Value added after improvement 15.70 %
Increase in % of value added time 3.82 %
The raw gain to TPS was an additional eleven man hours per test, equating to 1.375 additional working days that can be utilised processing additional work. At TPS current hourly rate of £80 per hour, an additional £880 of labour was generated through “spare” resources. The current volume of 12 units per annum equates to a long pay back period.
In line with Oakland’s [28] description of quality as “the most important competitive weapon”, TPS management firmly believes that quality is key, and that producing high quality products will ensure that existing customers will remain with TPS, and new customers will be attracted. The computer based data acquisition implemented as the control base for the testing process automation will collect data more accurately [27], contributing to higher quality products. Standardisation of the process through documentation, in line with TPS ISO 9000 quality certification, will further increase the products quality level. The automation of the flow divider testing process also has the potential to bring benefits in the area of sales, attracting additional income by featuring in the company brochure and being used during customer visit demonstrations. Promotion focussing on the upgraded test rig has the potential to attract more business in line with TPS current aim of increasing turnover and growth.
TPS has a growth plan in place and is working towards increasing turnover targets. The time and resources saved through the application and combination of LM, IE and automation methods will be focussed on achieving these targets, ensuring that the automated test rig does not replace workers, but supports the growth plan by the redistribution of TPS resources. This negates the possibility of redundancy of workers, sometimes associated with automation.
single process. The continual development promoted by lean management should progress through all processes within TPS, initially focussing on the interaction of the flow divider test process with adjacent processes, before spreading further afield. An additional area of focus that will support this project is flexibility, in respect to the testing of different models of flow dividers, as well as flow testing of pumps, etc.
5.
Final Conclusions
Through the analysis of the current performance of the flow divider flow testing process, areas of improvement and recommendations for improvement in waste reduction, resource allocation, and lead times were identified, fulfilling the project objectives and thereby achieving the project aim. There is an awareness of the advantages of LM and IE methods, and associated benefits at TPS, but through familiarity of products and process, TPS has traditionally taken the route warned against by Rodgers [13], which is to be tempted, through process familiarisation, to carry out the analysis in an informal and unsystematic manner. As the first systematic, documented improvement approach at TPS, this project was not intended to be a total solution. The project was intended to re-enforce the potential benefits of the adoption of operations management theories, and provide a starting point for a documented continual improvement method engineering process, there is always a better method [13]. The project has demonstrated that the theory of operations management developed within large manufacturing organisations can be combined with more familiar practical engineering disciplines, in this case automation, and produce large gains throughout this smaller engineering service facility.
Acknowledgments
This article is a revised and expanded version of an award winning paper under the category of “best contribution to the advancement of industrial practice” entitled “Applying lean management, industrial engineering and automation technology methods for the improvement of a testing process” presented at the 27th International Conference on Manufacturing Research (ICMR), Aston, Birmingham, UK, 11-13 September, 2012.
References
[1] J.A. Garza-Reyes, I. Oraifige, H. Soriano-Meier, P.L. Forrester and D. Harmanto, “The development of a lean park homes production process using process flow and simulation methods,” Journal of Manufacturing Technology Management, vol. 23, pp. 178-197, 2012.
[2] R. Johnston, C. Chambers, C. Harland, A. Harrison and N. Slack, Cases in operations management, 2nd ed. UK: Financial Times Management, 1997.
[3] N. Slack, R. Johnston and S. Chambers, Operations management, 6th ed. Harlow: Prentice Hall, 2010.
[4] J. Motwani, “A business process change framework for examining lean manufacturing: a case study,” Industrial Management and Data Systems, vol. 103, pp. 339-346, 2003.
[5] B. Emiliani, Better thinking, better results, 2nd ed. New York, NY: CLBM, 2007. [6] S. Alavi, “Leaning the right way,” Manufacturing Engineer, vol. 82, pp. 32-35, 2003.
[7] S. Sohal and A. Egglestone, “Lean production: experience among Australian organizations,” International Journal of Operations and Production Management, vol. 14, pp. 35-51, 1994.
[8] S. Taj, “Lean manufacturing performance in China: assessment of 65 manufacturing plants,” Journal of Manufacturing Technology Management, vol. 19, pp. 217-234, 2008.
[9] J. Womack, D. Jones and D. Ross, The machine that changed the world, New York: Rawson Associates, 1990. [10] J.A. Garza-Reyes, H.S. Parkar, I. Oraifige, H. Soriano-Meier and D. Harmanto, “An empirical-exploratory study of the
status of lean manufacturing in India,” International Journal of Business Excellence, vol. 4, pp. 395-412, 2012. [11] M.I. Kahn, Industrial engineering, UK: New Age International Pvt Ltd Publishers, 2009.
[12] Institute of Industrial Engineers, “What is industrial engineering? IIE official definition,” http://www.iienet2.org/Details.aspx?id=282, November 17, 2012.
[14] G.J. Stegemerten and E.W. Demmler, Chapter 4: operational analysis, Maynard, H.B., Industrial engineering handbook, London: McGraw-Hill, 1956.
[15] ASME Standard, Operation and flow process charts, New York: American Society of Mechanical Engineers.
[16] E.C. Mead, Section 2 - Chapter 7: Making and using industrial motion pictures, Maynard, H.B., Industrial engineering handbook, London: McGraw-Hill, 1956.
[17] R. Presgrave, Section 3 - Chapter 1: standardization of work measurement, Maynard, H.B., Industrial engineering handbook, London: McGraw-Hill, 1956.
[18] M. Rother and J. Shook, Learning to see, Version 1.3, The Lean Enterprise Institute, Cambridge, MA, 2003. [19] M.A. Nash and S.R. Poling, Mapping the total value stream: a comprehensive guide for production and transactional
processes, New York:Productivity Press, 2008.
[20] J. Liker, The Toyota way: 14 management principles from the world’s greatest manufacturer, New York: McGraw-Hill, 2004.
[21] P. Hines, M. Holweg and N. Rich, “Learning to evolve: a review of contemporary lean thinking, International Journal of Operations and Production Management, vol. 24, pp. 994-1011, 2004.
[22] W.A. Wolovich, Automatic control systems: basic analysis and design, London: Saunders College Publishing, 1994. [23] D.M. Considine and G.D. Considine, Standard handbook of industrial automation, London: Chapman and Hall Ltd,
1986.
[24] W.A. Band, Creating value for customers, New York: John Wiley & Sons, 1991.
[25] B.Y. Gale, Managing customer value, creating quality and service that customers can see, New York: The Free Press, 1994.
[26] E. Naumann, Creating customer value, the path to sustainable competitive advantage, Cincinnati, OH: Thomson Executive Press, 1995.
[27] T.B. Sheridan, Humans and automation, New York: Wiley and Sons Inc.