Published online May 30, 2013 (http://www.sciencepublishinggroup.com/j/ijrse) doi: 10.11648/j.ijrse.20130203.15
Wind power density estimation using meteorological
tower data
Sardar Maran P
1,*, Ponnusamy R
21Centre for Earth & Atmospheric Sciences, Sathyabama University,Jeppiaar Nagar, Rajiv Gandhi Road,Chennai., Tamil Nadu, India 2Madha Engineering College, Madha Nagar, Somangalam Road, Kundrathur, Chennai., Tamil Nadu, India
Email address:
[email protected](Sardar Maran P), [email protected](Ponnusamy R)
To cite this article:
Sardar Maran P, Ponnusamy R. Wind Power Density Estimation using Meteorological Tower Data, International Journal of Renewable and Sustainable Energy. Vol. 2, No. 3, 2013, pp. 110-114. doi: 10.11648/j.ijrse.20130203.15
Abstract:
The amount of power in the wind is very dependent on the speed of the wind. Because the power in the wind is proportional to the cube of the wind speed, small differences in the wind speed make a big difference in the power you can make from it. A 10% difference in speed makes about a 33% change in power. This gives rise to the primary reason for wind resource assessment. In order to more accurately predict the potential benefits of a wind power installation, wind speeds and other characteristics of a site’s wind regime must be accurately understood. This gives rise to the primary reason for wind resource assessment. In order to more accurately predict the potential benefits of a wind power installation, wind speeds and other characteristics of a site’s wind regime must be accurately understood. In this paper the important aspects of wind re-source assessment for a period of three years from 2010-2012 will be studied for a 50 meter instrumented meteorological tower located at Sathyabama University, Chennai.Keywords:
Wind Resource Assessment, Wind Speed, Wind Energy, Meteorological Tower Data1. Introduction
In 2012, despite a slowing global economy, India’s elec-tricity demand continued to rise. Elecelec-tricity shortages are common, and over 40% of the population has no access to modern energy services. India’s electricity demand is pro-jected to more than triple between 2005 and 2030. In the recently released National
Electricity Plan (2012) the Central electricity Authority projected the need for 350-360GW of total generation ca-pacity by 2022. Despite major caca-pacity additions over recent decades, power supply struggles to keep up with demand. India had another record year of new wind energy installa-tions between January and December 2011, installing more than 3 GW of new capacity for the first time to reach a total of 16,084mW. As of march 2012, renewable energy ac-counted for 12.2 percent of total installed capacity, up from 2 percent in 1995. Wind power accounts for about 70 percent of this installed capacity. by the end of August 2012, wind power installations in India had reached 17.9 GW (India Wind Energy Outlook, 2012).
In Tamil Nadu the total installed Wind capacity as on 30.06.2012 is 7055.475MW, contributing to 40% of coun-try’s total wind capacity. All time high capacity addition of
1083.460 MW in 2011- 12. Wind capacity addition to a tune of 1000 MW is expected for 2012-13.A capacity addition of 6000 MW of wind energy installations is targeted under the 12th five year plan (Tamil Nadu Energy Development Agency). The coast along Tamil Nadu is the best in the country having very high potential areas with net Capacity Utilization factor (CUF) of over 40% and wind power den-sity of over 700 w/m2 at many locations. Tamil Nadu has an advantage of location, where in both the Southwest Mon-soon and Northeast monMon-soon 'tunnel' through the Palk Bay and Gulf of Mannar, contributing to a high wind speed po-tential zone.
The wind power density term is directly proportional to air density:
WPD = ½*ρ* V3
where the greek letter ρ stands for air density, which is defined by: ρ = M/Vol.
2.Area of Study
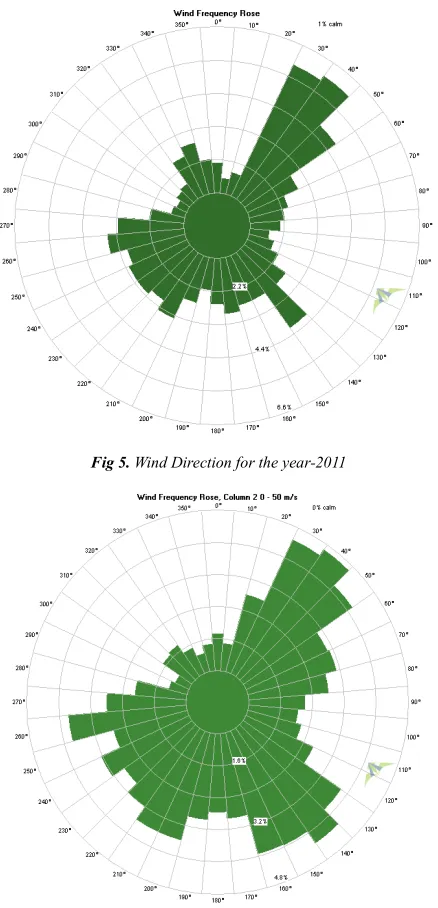
A tower used at a potential project site which has equip-ment attached to it which is designed to assess wind resource. Generally a met tower will have anemometers, wind direc-tion vanes, temperature and pressure sensors, and other measurement devices attached to it at various levels above the ground. The 50 Metre Meteorological tower installed at Sathyabama University erected by Indira Gandhi Centre for Atomic Research (IGCAR), Kalpakkam has multilevel sensors for all the basic atmospheric parameters like wind speed and direction, temperature, relative humidity, pressure, rainfall and nuclear radiation. The meteorological tower is located at latitude 12o 52 N, longitude 80o 13E with 4m elevation.
3.Importance of Meteorological
Measurement Height
Wind speed is a function of height, topology and ground cover. Generally speaking, a better picture of the wind re-source is gained from towers closest to the height of the turbine that is being contemplated for the installation. A small variation in wind speed has a significant impact on energy capture. Unfortunately, many 30m towers have been installed without proper technical guidance. This has oc-curred in regions that have high wind shear and complex terrain which requires the use of higher tower measurement of the wind. Hence, data collected does not have meaningful value for energy capture calculations, using wind turbines that are 70m (229ft) to the center of the turbine’s rotor. Wind speed has a functional relationship to elevation. As a general rule, the higher a turbine rotor is placed above ground, the greater the velocity and power of the wind. Turbine gene-rators placed on higher towers will produce more electrical energy.
For every 20 meter increase in elevation, the velocity of the wind increases 5% to 15% depending on type of ground cover. The type of ground cover in the region tends to offer a certain degree of resistance to the movement of wind as ground level is approached.
4. Materials and Methods
4.1. Towers
The most common equipment is a 40 or 50-meter met tower supported by guy wires. This type of tower is a tem-porary structure. No foundation is required.
4.2. Instruments
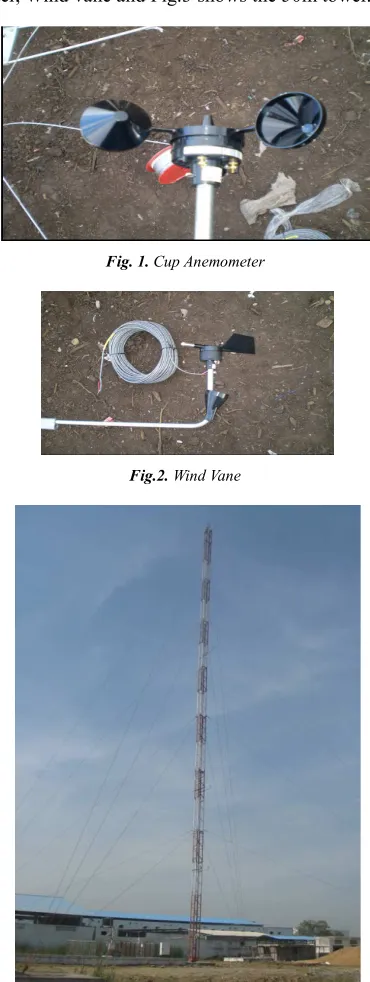
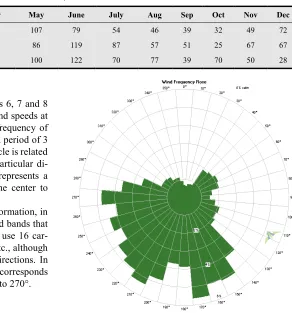
A cup anemometer & a direction vane designed for wind power applications are pictured here. The turning speed of the anemometer indicates the wind speed, and the direction of the vane indicates wind direction.
The instrumentation used for wind resource assessment includes three major components:
• anemometers and wind direction vanes, which are sensors to measure the wind speed and direction,
• a data logger, and
• a meteorological mast, or tower.
The NRG Systems Classic #40H anemometer is an un-heated three-cup anemometer designed specifically for tur-bine control applications in non-icing conditions. The Clas-sic #40H provides high precision wind speed measurements for accurate turbine control. The Classic #40 anemometer has recorded wind speeds of 96 m/s (214 mph). Their low moment of inertia and unique bearings permit very rapid response to gusts and lulls. Because of their output linearity, these sensors are ideal for use with various data retrieval systems. The following figure 1 & 2 shows the cup ane-mometer, Wind vane and Fig.3 shows the 50m tower.
Fig. 1. Cup Anemometer
Fig.2. Wind Vane
5. Results and Discussion
5.1. Monthly Average Wind Speed Variation
The annual variability of wind speed has a strong influ-ence on the analysis methodologies developed for the as-sessment of the long-term wind resource at a site and the uncertainty in such predictions. Before describing typical
methodologies used for the prediction of the long-term mean wind speed at a site. The Annual average wind speed for three years from 2010 to 2012 is as shown in the following Table1.
A three-year rolling average of the data has been taken. It is immediately apparent that the variability in the mean wind speed over three-year periods is substantially reduced compared with that of one-year periods.
Table 1. Monthly Average Wind Speed Variation
Year Jan Feb March April May June July Aug Sep Oct Nov Dec
2010 3 3.1 3.6 4.7 5 4.7 4 3.8 3.5 3.1 3.3 3.7
2011 4.2 3.9 4 4.1 4.5 5.5 4.8 4.7 3.8 3.3 4.4 4.1
2012 3.4 3.2 3.5 4.1 5.4 5.3 4.3 4.5 3.6 3.6 3.5 3.3
5.2. Wind Power Density
Wind power density directly determines cost efficiency in using wind energy. We may categorize the density as poor (< 150 Watt/m2), fair (150 ~ 250 Watt/m2), good (250 ~ 350
Watt/m2), or excellent ( > 350 Watt/m2). The following Table 2 describes wind power distribution and can be used as initial guidance in selecting region for wind power projects.
Table 2. Wind Power Density Calculation in W/m2
Year Jan Feb Mar Apr May June July Aug Sep Oct Nov Dec
2010 17 27 54 73 107 79 54 46 39 32 49 72
2011 78 43 36 59 86 119 87 57 51 25 67 67
2012 151 29 123 74 100 122 70 77 39 70 50 28
5.3. Wind Direction Distribution
A wind rose diagram in the following figures 6, 7 and 8 that shows the distribution of wind directions and speeds at this location for a period of three years. The frequency of winds blowing from particular directions over a period of 3 years. The length of each "spoke" around the circle is related to the frequency that the wind blows from a particular di-rection per unit time. Each concentric circle represents a different frequency, emanating from zero at the center to increasing frequencies at the outer circles.
A wind rose plot may contain additional information, in that each spoke is broken down into color-coded bands that show wind speed ranges. Wind roses typically use 16 car-dinal directions, such as north (N), NNE, NE, etc., although they may be subdivided into as many as 32 directions. In terms of angle measurement in degrees, North corresponds to 0°/360°, East to 90°, South to 180° and West to 270°.
6. Conclusion
The wind power density estimation can be extended in the coastal areas of Chennai city. This work can be carried out with the help of Automatic Weather stations data provided by Indian Meteorological department.
Fig 5. Wind Direction for the year-2011
Fig 6. Wind Direction for the year-2012
References
[1] M. Carolin Mabel and E.Fernandez “Growth and future trends of wind energy in India,” Renewable & Sustainable Energy Reviews, 12(2008), pp. 1745-1757.
[2] T.V.Ramachandran, et. al. “Wind Energy Potential As-sessment Spatial Decision Support System”, Energy Educa-tion Science & Technology 2005 Volume 14 Issue 2, pp 61-80.
[3] Peter Meisen, “Overview of Renewable Energy Potential of India”, Technical Report, Gobal Energy Network Institute (GENI), October,2006.
[4] L. Landberg, “Short Term Prediction of the Power Production from Wind Farms”,Journal ofWind Engineering and Indus-trial Aerodynamics, Vol. 80, 1999, pp.207-220.
[5] Sancho Salcedo-Sanz, et. al., “Accurate Short-term Wind
Speed Prediction by Exploiting Diversity in Input Data using Banks of rtificial Neural Networks”, Journal of Neurocom-puting, Vol 72, 2009, pp.1336-1341.
[6] M. Carolin Mabel & E.Fernandez, “ Analysis of wind power generation and prediction using ANN – A Case study” Renewale Energy, 33(2008), pp.986-992.
[7] K. Sreelakshmi, P.Ramakanthkumar, “ Neural Network for short term wind speed prediction”, World Acadam of Science & Engineering technology, 42(2008), pp. 221-225.
[8] Hafzullah Aksoy, Z. Fuat Toprak, Ali Aytek, N.Erdem Unal, “ Stochastic generation of hourly mean wind speed data”, Renewable Energy 29(2004), pp.2111-2131.
[9] “Wind Energy- windpower.org” Mohammad Monfared, Hasan Rastegar, Hossein Madadi Kojabadi, “A new strategy for wind speed forecasting using artificial intelligent me-thods”, Renewable Energy, 34(2009), pp.845-848.
[10] Andrew Kusiak, Haiyang Zheng, Zhe Song, “ Models for monitoring wind farm power”, Renewable Energy, 34(2009), pp.583-590.
[11] S.Kumar, “Wind Energy – India Overview” Renewable Energy, 16(1999) pp.961-964
[12] Sancho Salcedo-Sanz, et. al., “Hybridizing the fifth Gener-ation Mesoscale Model with Artificial Neural Networks for Short-term Wind Speed Prediction”, Journal of Renewable Energy, Vol. 34, 2009, 1451-1457.
[13] Mehmet Bilgili, Besir Sahin, Abdulkadir Yasar, “ Application of Artificial Neural Networks for the Wind Speed Predic-tion of Target StaPredic-tion using Reference StaPredic-tions Data”, Journal of Renewable Energy, Vol. 32, 2007, 2350-2360.
[14] M.A. Mohandes, et. al., “ Support Vector Machines for Wind Speed Prediction”, Journal of Renewable Energy, Vol. 29, 2004, Pp 939-947.
[15] Uffe B.Kiaerulff , Anders L.Madsen “Probabilistic Net-work- An Introduction to Bayesian Networks and In-fluence Diagrams”, Technical Report, May 2005, Aalborg University.
[16] G.H.Bakir, et, al., “Predicting Structured Data”, Cambridge: MIT Press, 2007.
[17] Jeasen,F.V.,”An Introduction to Bayesian Networks”, UCL Press , London, 1996.
[18] L.C.Van der Gaag and P.R.de Wall, ”Multi-Dimensional Bayesian Network Classifiers”,Third Eruopean Conference
on Probabilistic Graphical Models. Pp
107-114,[email protected](Sardar Maran P), [email protected](Ponnusamy R)
[19] S.Kumar, “Wind Energy – India Overview” Renewable Energy, 16(1999) pp.961-964
[20] Sancho Salcedo-Sanz, et. al., “Hybridizing the fifth Gener-ation Mesoscale Model with Artificial Neural Networks for Short-term Wind Speed Prediction”, Journal of Renewable Energy, Vol. 34, 2009, 1451-1457.
[21] Mehmet Bilgili, Besir Sahin, Abdulkadir Yasar, “ Application of
Renewable Energy, Vol. 32, 2007, 2350-2360.
[23] M.A. Mohandes, et. al., “ Support Vector Machines for Wind Speed
[24] Prediction”, Journal of Renewable Energy, Vol. 29, 2004, Pp 939-947.
[25] Uffe B.Kiaerulff , Anders L.Madsen “Probabilistic Net-work- An Introduction to Bayesian Networks and In-fluence Diagrams”, Technical Report, May 2005, Aalborg
University.
[26] G.H.Bakir, et, al., “Predicting Structured Data”, Cambridge: MIT Press, 2007.
[27] Jeasen,F.V.,”An Introduction to Bayesian Networks”, UCL Press , London, 1996.