THE IDAHO READING INDICATOR AS A PREDICTOR OF SUBSEQUENT DIAGNOSIS OF SPECIFIC LEARNING DISABILITIES
by
Kimberly A. Ennis
A dissertation
submitted in partial fulfillment of the requirements for the degree of
Doctor of Education in Curriculum and Instruction Boise State University
BOISE STATE UNIVERSITY GRADUATE COLLEGE
DEFENSE COMMITTEE AND FINAL READING APPROVALS
of the dissertation submitted by
Kimberly A. Ennis
Dissertation Title: The Idaho Reading Indicator as a Predictor of Subsequent Diagnosis of Specific Learning Disabilities
Date of Final Oral Examination: 19 March 2015
The following individuals read and discussed the dissertation submitted by student Kimberly A. Ennis, and they evaluated her presentation and response to questions during the final oral examination. They found that the student passed the final oral examination. Jack Joseph Hourcade, Ph.D. Chair, Supervisory Committee
Roger Stewart, Ph.D. Member, Supervisory Committee Michael John Humphrey, Ed.D. Member, Supervisory Committee Keith W. Allred, Ph.D. Member, Supervisory Committee
ACKNOWLEDGEMENT
My sincerest appreciation is given to my wonderful advisor, Dr. Jack Hourcade. Dr. Hourcade was patient with me. More importantly, he kept me on track and moving forward. I am thankful that he was willing to serve as my advisor.
I am also very grateful to Dr. Roger Stewart. Dr. Stewart was kind and generous with his time. I was inspired by his courses on assessments.
I valued the suggestions and knowledge that Dr. Humphrey and Dr. Keith Allred contributed to this dissertation. I thank Dr. Humphrey and Dr. Allred for the time and effort that they dedicated to the supervisory committee.
The dissertation would not have been completed without the help of Stephanie Lee, Assessment Specialist, Idaho State Department of Education, and Steve Tyree, Testing and Assessment Administrator, Boise School District. I hope that the information collected will be a benefit. Finally, thank you Jodi Chilson, Coordinator of Theses, Dissertations, & Fellowship Programs for putting the dissertation in the proper format.
Special thanks to my friends and family. Your encouragement and faith in me kept me motivated.
ABSTRACT
The Idaho Reading Indicator (IRI) is a universal screen used to quickly assess the reading fluency of all Idaho public school students in grades kindergarten through third. The IRI is a tool that aids in the early identification of children with potential reading difficulties. Within the group of children with reading difficulties, some students have specific learning disabilities (SLD). Early identification of reading difficulties is critical to the success of all students who struggle with reading, especially students with SLD. To understand the problem, it is important to understand the nature of reading and the
consequences of reading success and failure. The identification of SLD is not an easy task and differences in diagnostic approaches exist. The diagnostic value of the fluency assessment techniques employed by the IRI is examined.
TABLE OF CONTENTS
ACKNOWLEDGEMENT ... iv
ABSTRACT ... v
LIST OF TABLES ... x
LIST OF FIGURES ... xii
LIST OF ABBREVIATIONS ... xiii
CHAPTER 1: INTRODUCTION ... 1
Background ... 3
Problem Statement ... 6
Purpose of the Study ... 8
Research Questions and Hypothesis ... 8
Procedures ... 9
Limitations of the Study... 11
Significance of the Study ... 11
CHAPTER 2: REVIEW OF THE LITERATURE ... 13
Impact of Reading ... 18
Successful Readers and Academic Success ... 20
Poor Readers and Academic Struggles ... 21
Specific Learning Disabilities ... 22
Definition and Identification of Specific Learning Disabilities ... 23
Academic Characteristics of Students Diagnosed with Specific Learning
Disabilities ... 42
The Need for Early Identification of Reading Difficulties ... 43
Reading Achievement and Accountability ... 44
The Idaho Reading Indicator (IRI) ... 45
History of the IRI ... 46
Current AIMSweb IRI ... 69
The Kindergarten IRI ... 70
The First Grade IRI ... 72
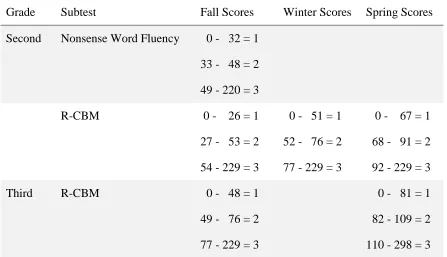
The Second and Third Grade IRI ... 75
The Future of the IRI ... 81
Curriculum-Based Measurements of Reading ... 83
Letter Name Fluency... 84
Letter Sound Fluency ... 90
R-CBM (Oral Reading Fluency) ... 91
Criticisms of CBMs ... 93
A Rational for a Possible Predictive Relationship between Low IRI Scores and Subsequent Diagnosis of SLD ... 94
CHAPTER 3: METHOD ... 97
Introduction ... 97
Research Questions and Hypotheses ... 98
Design of Study... 101
Participants ... 101
Setting ... 103
Demographics ... 103
Recruitment Plan ... 105
Variables to be Measured... 106
IRI Scores... 106
Subsequent Diagnosis of SLD ... 112
Techniques for Gathering and Managing Data ... 113
Techniques for Analyzing, Interpreting, and Presenting Data ... 114
Limitations of the Study... 115
CHAPTER 4: RESULTS ... 118
The Data ... 118
Hypotheses and the Data Analysis ... 120
Statistical Analyses ... 120
2012 Fourth Grade R-CBM Scores... 132
Statistical Analyses ... 134
Additional Findings ... 137
The Mean Raw Score Gaps Between Students with and Without SLD ... 138
The Drop in Mean Raw Scores over Summer Vacation ... 141
CHAPTER 5: DISCUSSION ... 143
Introduction ... 143
Summary of the Study ... 144
Statistical Analyses and Results Summary ... 144
Support for the Hypotheses ... 145
Consistency of the Gaps in IRI Scores Between Students Identified as SLD or Not SLD ... 146
Summer Vacation Drop in Mean Raw Scores ... 148
Conclusions and Implications ... 149
The Hypotheses ... 149
Other Findings ... 153
Future Research ... 158
REFERENCES ... 162
APPENDEX A ... 191
Number of Student IRI and R-CBM Scores Included and Missing in the Study ... 191
APPENDEX B ... 193
Summary of the Pearson Chi-Square Analysis ... 193
APPENDIX C ... 195
Summary of Symmetric Measures: Cramer’s V Analysis ... 195
APPENDIX D ... 197
2009 – 2012 IRI Chi-Square Count and Expected Count Statistics ... 197
APPENDIX E ... 199
Odds Ratios ... 199
LIST OF TABLES
Table 2.1 Chall’s (1967, 1983) Developmental Stages of Reading ... 17
Table 2.2 Waterford IRI Kindergarten Subtests ... 49
Table 2.3 Waterford IRI First Grade Subtests ... 49
Table 2.5 Winter 2007, Matching Skill Assessments on Waterford Institute IRI and Pilot AIMSweb IRI ... 59
Table 2.6 2007 AIMSweb IRI Kindergarten Cut Scores ... 62
Table 2.7 2007 AIMSweb IRI First Grade Cut Scores ... 64
Table 2.8 2007 AIMSweb IRI Second and Third Grade Cut Scores ... 65
Table 2.9 Subtest Changes from 2007 to 2009 for Grades Kindergarten through Second on the AIMSweb IRI ... 68
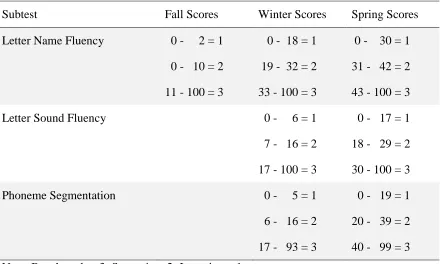
Table 2.10 Current Kindergarten IRI Subtests, Cut Scores, and Converted Scores .. 71
Table 2.11 Readability of the Three First Grade IRI Passages ... 74
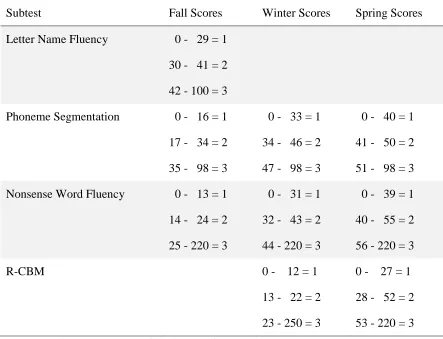
Table 2.12 Current First Grade IRI Subtests, Cut Scores, and Converted Scores ... 75
Table 2.13 Current Second and Third Grade IRI Subtests, Cut Scores, and Converted Scores ... 76
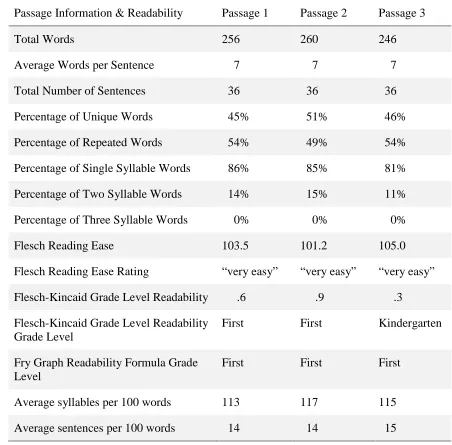
Table 2.14 Readability of the Three Second Grade IRI Passages ... 78
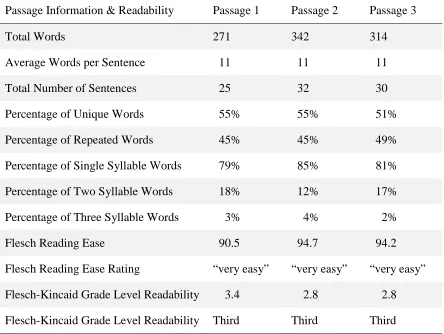
Table 2.15 Readability of the Three Third Grade IRI Passages ... 80
Table 3.1 Boise School District Student Characteristics in 2011 ... 104
Table 3.2 Boise School District Student Characteristics in 2009 ... 105
Table 3.3 First Grade IRI Cut Scores and Raw Scores ... 108
Table 3.4 Boise School District 2009-2010 First Grade IRI Scores ... 109
Table 3.5 Second Grade IRI Cut Scores and Raw Scores ... 110
Table 3.6 Boise School District 2010-2011 Second Grade IRI Scores ... 110
Table 3.7 Third Grade IRI Cut Scores and Converted Scores... 111
Table 3.8 Boise School District 2011-2012 Third Grade IRI Scores ... 111
Table 4.1 2009 First Grade Fall IRI Chi-Square Count and Expected Count Statistics ... 121
Table 4.2 2010 First Grade Spring IRI R-CBM Chi-Square Count and Expected Count Statistics ... 124
Table 4.3 2010 Second Grade Fall IRI R-CBM Chi-Square Count and Expected Count Statistics ... 126
Table 4.4 2011 Second Grade Spring IRI R-CBM Chi-Square Count and Expected Count Statistics ... 128
Table 4.5 2011 Third Grade Fall IRI R-CBM Chi-Square Count and Expected Count Statistics ... 130
Table 4.6 2012 Third Grade Spring IRI R-CBM Chi-Square Count and Expected Count Statistics ... 132
Table 4.7 2012 – 2013 Fourth Grade R-CBM Chi-Square Count and Expected Count Statistics ... 136
Table 4.8 IRI Mean Raw Scores for Fall and Spring from 2009 through 2013 ... 138
Table 4.9 The Drop in Mean Raw Scores between the Fall and Spring over Summer Vacation ... 142
Table A.1 Number of Student IRI and R-CBM Scores Included and Missing in the Study ... 192
Table B.1 Summary of the Pearson Chi-Square Analysis ... 194
Table C.1 Summary of Symmetric Measures: Cramer’s V Analysis ... 196
Table D.1 2009 – 2012 IRI Chi-Square Count and Expected Count Statistic ... 198
Table E.1 Odds Ratios ... 200
LIST OF FIGURES
Figure 2.1. The RTI Three-Tier Model ... 35 Figure 4.1. Fall and Spring Mean Raw Scores on the IRI and Fourth Grade
R-CBM ... 139
LIST OF ABBREVIATIONS
BSD ……….Boise School District
CBM ………Curriculum Based Measurement
ESEA ………..Elementary and Secondary Education Act
IDEA ………Individuals with Disabilities Act
IRI ………Idaho Reading Indicator
IQ ………...Intelligence Quotient
NCLB ………..No Child Left Behind
NICHHD ………National Institute of Child Health and Human Development
OR ………Odds Ratio
R-CBM ………Reading Curriculum Based Measurement
SDE ……….State Department of Education
SLD ……….Specific Learning Disability
CHAPTER 1: INTRODUCTION
The acquisition of reading skills is one of the most fundamental achievements of students in K-6 school programs (Committee on the Prevention of Reading Difficulties in Young Children, 1998). Students who are proficient readers are more likely to experience academic success (Committee on the Prevention of Reading Difficulties in Young
Children, 1998; Feitelson, Goldstein, Iraqi, & Share, 1993; Paris, 2005; Pretorius, 2000). In contrast, students who experience reading difficulty are more likely to struggle in school. The “Matthew Effect” in reading refers to the Biblical concept of the “poor getting poorer” and the “rich getting richer” (Stanovich, 1986). The Matthew Effect illustrates the sharp contrast between proficient readers and poor readers. Good readers read more and become even more proficient while poor readers continue to lag far behind (Cunningham & Stanovich, 2001; Taylor, Frye & Maruyama, 1990). Poor readers rarely are able to make enough gains in reading to become academically proficient or successful (Torgesen, 1998).
It is critical that students with potential problems in reading are identified at an early age. In order to turn poor readers into competent readers, students who are
identified until they are ages 8 or 9 (Lyon, 1996). It is often challenging to separate students with SLD from other types of students who are poor readers (Fletcher et al., 1994; Fuchs, Fuchs, Mathes, Lipsey, & Roberts, 2002). This is due to in part to the fact that poor reading performance may stem from a number of causes, including (a) speaking a primary language that is not English, (b) low intelligence, and (c) SLD (Fletcher et al., 1994; Fuchs et al., 2002). Another cause of reading failure may be the result of poor instruction (Committee on the Prevention of Reading Difficulties in Young Children, 1998; Foorman, Francis, Fletcher, Schatschneider, & Mehta, 1998).
Background
As stated earlier, the study is concerned with the relationship between the IRI and the subsequent identification of SLD. To understand the key variables of this study, a brief overview of the IRI is given to provide historical context as well as a description of the IRI. It is also necessary to explain the different approaches to identifying students as SLD.
The first variable in the study is the IRI scores of a cohort of first grade students in 2009 and their subsequent IRI scores through third grade. The IRI is state-mandated reading assessments for students in the state of Idaho who are in grades one through three (Idaho Comprehensive Literacy Act, Idaho Code 33-1614). The IRI was first used in 1999. The IRI is a universal screen designed to assist in the identification of students with potential reading problems and an outcomes measure because the IRI is used to
determine if students are meeting grade-level goals as compared with peers (Fisk, n.d.). The kindergarten IRI measures Letter Name Fluency and Letter Sound Fluency. The first grade IRI contains Letter Sound Fluency and oral reading fluency measurements (R-CBM). The second and third grade IRIs contain only R-CBMs. The administration of the IRI is required by law to take less than 10 minutes (Idaho State Department of Education, 2013). The IRI is also a high-stakes assessment. The results of the IRI are used as a measurement of student reading achievement and gains in reading proficiency. There have been three versions of the IRI.
SLD changed in 2010. In general, two methods of labeling students as SLD are currently used across the country. They are (a) the traditional approach (the intelligence quotient (IQ)-discrepancy model) and (b) the contemporary Response to Intervention (RTI). The reauthorization of the Individuals with Disabilities Education Improvement Act (IDEA) of 2004 included RTI as an alternative means of identifying students with SLD
(Berkeley, Bender, Gregg Peaster, & Saunders, 2009). Now states may use the IQ-discrepancy model, RTI, or a combination of them. However, clearly there is a move nationally as well as in the state of Idaho to adopt the RTI model in the identification of SLD.
The traditionally used IQ-discrepancy model analyzes the gap between a student’s IQ and academic achievement scores on standardized assessments. A student is labeled SLD when her performance on an IQ test is within the average or above average range and her performance on an academic achievement measure is significantly below the IQ score (Fletcher, Denton & Francis, 2005; Fletcher et al., 1994; Mercer, Jordan, Allsopp, & Mercer et al., 1996; Stanovich, 1991a). In Idaho, a 15 point discrepancy was required to apply the label of SLD to students referred for consideration of special education services. Under the traditional approach, a student with an IQ of 100 would have to have a score of 85 or below on an academic achievement test to meet eligibility requirements for a diagnosis of SLD.
the unique neurological skills required in effective reading. To this end, RTI begins in the general education classroom, with students of concern being provided scientific
researched-based interventions in reading over an adequate period of time (eight to twelve weeks). Before students may be referred for a SLD evaluation, the student must have demonstrated significant resistance to general education interventions during this period, with an actual rate of learning lower than reasonably expected.
Both the IQ-discrepancy and RTI models of SLD identification have advocates and critics. Another emergent diagnostic approach, the blended approach, combines elements of RTI and an assessment of cognitive processes (Barth et al., 2008; Baskette, Ulmer, & Bender, 2006; Batsche, Kavale & Kovaleski, 2006; Bradley, Danielson, & Hallahan, 2002; Fletcher, Coulter, Reschly, & Vaughn, 2004; Fuchs, Fuchs, & Stecker, 2010; Kavale & Spaulding, 2008; Keogh, 2005; McKenzie, 2009). The cognitive processes related to reading are working memory, processing speed, executive function, and receptive and expressive language (Johnson, Humphrey, Mellard, Woods, &
Swanson, 2010). Students with SLD performed significantly lower on cognitive processing tasks than their typically achieving peers (Johnson et al., 2010).
Problem Statement
The need to identify poor readers and to provide interventions is urgent. The stakes are high for students, schools, and for society. The consequences of reading failure cannot be ignored. Failure to reach reading proficiency levels may have
devastating results on a student’s life. NCLB ushered in an age of accountability testing. The failure to meet proficiency levels may result in penalties against schools. With the importance placed on testing, stakeholders need to be more informed about the
assessments that are used in high stakes testing.
In Idaho, the test that is used to measure the reading proficiency of students in grades kindergarten through third is the IRI. The IRI has been used for approximately fourteen years. The IRI is designed to be quick to administer and easy to score (Idaho State Department of Education, 2013). The IRI is a universal screen that can only provide a “snapshot” of a particular student’s reading achievement.
There are few available empirical studies of the IRI. One study considered how well the IRI could predict performance on Idaho Standards Achievement Tests (ISATS; Stewart, 2009). The ISATS is the high stakes academic achievement assessment of reading, language usage, and mathematics for grades three through tenth grade. Stewart (2009) found that the IRI correctly predicted student performance for 84% of the students. The strongest correlation between the IRI and the ISATS was among white students who were not enrolled in special education or Title I schools.
Two studies (Nave & Burke, 2007a, 2007b) were commissioned by the state to compare the first version of the IRI (1999 – 2007) with the proposed replacement version of the IRI (2007 – 2009). The studies compared proficiency ratios between students on both versions of the IRI in the fall and winter. The two studies found similar patterns of student performance on both versions of the IRI.
A more recent study by Santi and Francis (2012) was commissioned by the Idaho State Department of Education to review the IRI and to assess current practices related to the identification of students at risk for reading problems in the early grades. The authors concluded that the IRI’s use as a universal screen to identify students at risk for reading failure and as a measurement of teacher accountability were at cross purposes. The IRI as a measure of teacher performance hinders the use of the IRI as a means to identify
students with potential reading difficulties. The limited psychometric information associated with the IRI was also a concern.
study that examines the correlation between IRI scores and the subsequent identification of students as SLD.
Purpose of the Study
The purpose of this study is to examine the relationship between IRI scores and the subsequent identification of SLD. The fall and winter IRI scores of students who entered first grade in 2009 will be collected from grades one through three. The IRI scores will be correlated to the subsequent identification of SLD by the end of the first semester in fourth grade within the group of these students.
Research Questions and Hypothesis
The following questions will guide the research as the relationship between IRI scores and the subsequent identification of SLD is explored.
Question 1: What is the correlation between Letter Sound Fluency scores by students on the first grade fall IRI and subsequent identification of SLD by the end of the first semester in fourth grade?
Question 2: What is the correlation between Letter Sound Fluency scores by students on the first grade spring IRI and subsequent identification of SLD by the end of the first semester in fourth grade?
Question 4: What is the correlation between R-CBM scores by students on the first grade spring IRI and subsequent identification of SLD by the end of the first semester in fourth grade?
Question 5: What is the correlation between R-CBM scores by students on the second grade fall IRI and subsequent identification of SLD by the end of the first semester in fourth grade?
Question 6: What is the correlation between R-CBM scores by students on the second grade spring IRI and subsequent identification of SLD by the end of the first semester in fourth grade?
Question 7: What is the correlation between R-CBM scores by students on the third grade fall IRI and subsequent identification of SLD by the end of the first semester in fourth grade?
Question 8: What is the correlation between R-CBM scores by students on the third grade spring IRI and subsequent identification of SLD by the end of the first semester in fourth grade?
Procedures
Boise School District (BSD). The BSD is the second largest school district in the state and it is considered an urban school district.
The first grade IRI from the fall of 2009 and spring 2010 data will be collected. The first grade IRI contains two separate measures: (a) Letter Sound Fluency and (b) Reading Curriculum Based Measures (R-CBM). The second grade 2010 fall IRI scores and 2011 spring IRI scores will be collected. The third grade 2011 fall IRI and the 2012 spring IRI scores will be collected. All second and third grades IRIs are R-CBMs.
Student identification numbers and IRI scores will be paired. The lists of student identification numbers of students identified as SLD from first through fourth grade will be collected from 2009 through 2013. Students identified as SLD will be coded as “one.” Students not identified as SLD will be coded as “zero.” Three types of statistical
Limitations of the Study
There are several potential limitations of this study. To begin with, the sample may be too small to make extensive generalizations. Next, the Boise School District student body may not mirror the national population in potentially significant ways, including ethnic diversity. Another potential limitation to the study is that there was a shift in the way students are identified as SLD during the time period in question. Specifically, in 2010 Idaho changed from the IQ-discrepancy model to a blended
approach. The ways that students with SLD are identified is given in Chapter 2: Review of the Literature.
Furthermore, the time frame of this study may be a limitation. The study ends when the students finish fourth grade. The potential to be identified as SLD is present until graduation (or even beyond). These “late diagnoses” would not be identifiable in this study as presently structured. Finally, at the district level, students are listed as having SLD but the type of SLD is not specified. The IRI is a measure of reading
achievement. There are students who are labeled as SLD who have academic difficulties in other areas (e.g., math) but not reading. However, approximately 80% to 85% of students with SLD have deficits in reading (Lyon, 1996).
Significance of the Study
The acquisition of reading skills is arguably the most important academic function of schools. Given this, it is critical that students with potential reading difficulties,
CHAPTER 2: REVIEW OF THE LITERATURE
The ability to read is a fundamental skill necessary for Americans to fully participate in all aspects of our society (National Center for Family Literacy, 2008; Committee on the Prevention of Reading Difficulties in Young Children, 1998). Reading skills are invaluable in almost every arena in society. It can be argued that the necessity of functional reading skills is higher now than before. The ability to read is linked to social and economic advancement of the individual; thus, the success of our society depends on the reading ability of our citizens. The driving forces pushing the demand for expanded reading abilities include the international marketplace and rapid evolution of technology (Carnevale, 1991; Pretorius, 2000). Learning to read is arguably one of the most important expectations of students in primary elementary education (Committee on the Prevention of Reading Difficulties in Young Children, 1998; Johnson, Pool, & Carter, n.d.).
neurobiological, and language development are needed to learn how to read (Committee on the Prevention of Reading Difficulties in Young Children, 1998).
Skillful readers have a firm language foundation, which enables them to
understand the meaning of the text. Acquiring the skills required for reading begins with the child’s language development. The roots of reading begin with the child’s exposure to and acquisition of oral language, stories, and print awareness (Bear, Invernizzi,
Templeton, Johnston, 1996; Committee on the Prevention of Reading Difficulties in Young Children, 1998). Oral language, stories, and print awareness are “threads” that bind together as children learn how to read (Bear et al., 1996). Good readers have strong receptive language, expressive language, phonological awareness, print awareness, decoding skills, and large vocabularies (Johnson et al., n.d.; Scarborough, 2009).
To read, individuals must use visual perception, visual discrimination, visual memory, recall, and directional orientation (Traub & Bloom, 1990). Reading combines attention, memory, language, and motivation (Adams, 1994; Committee on the
Prevention of Reading Difficulties in Young Children, 1998). When we read, we map letters to sounds with visual-auditory integration (Traub & Bloom, 1990). Once mapped, the letter-sounds are synthesized into syllables, and the syllables are combined into words. Orthographic knowledge is the information stored in our memory and retrieved so that we can represent spoken language in written form (Apel, 2011). As orthographic knowledge builds, the braided bond becomes stronger and thickens as the reader’s vocabulary expands (Bear et al., 1996).
symbols quickly and accurately (Kuhn & Stahl, 2003; National Institute of Child Health and Human Development [NICHHD], 2000; Rasinski & Hoffman, 2003; Spear-Swerling, 2006; Wise et al., 2010). After developing word recognition, improving reading fluency is the next significant step for beginning readers (NICHHD, 2000). Skillful readers are able to comprehend words quickly, accurately, and read with expression (Adams, 1994; NICHHD, 2000; Committee on the Prevention of Reading Difficulties in Young
Children, 1998; Wolf & Katzir-Cohen, 2001). Measuring reading fluency, or the ability to quickly read words in text with few errors, is a means to assess reading competency and achievement (Fuchs, Fuchs, Hosp, & Jenkins, 2001; Good, Simmons, & Kame’enui, 2001; Spear-Swerling, 2006; Wise et al., 2010; Wolf & Katzir-Cohen, 2001).
advance reading comprehension, and in turn reading comprehension may foster fluency (Pikulski & Chard, 2005; Pinnell et al., 1995).
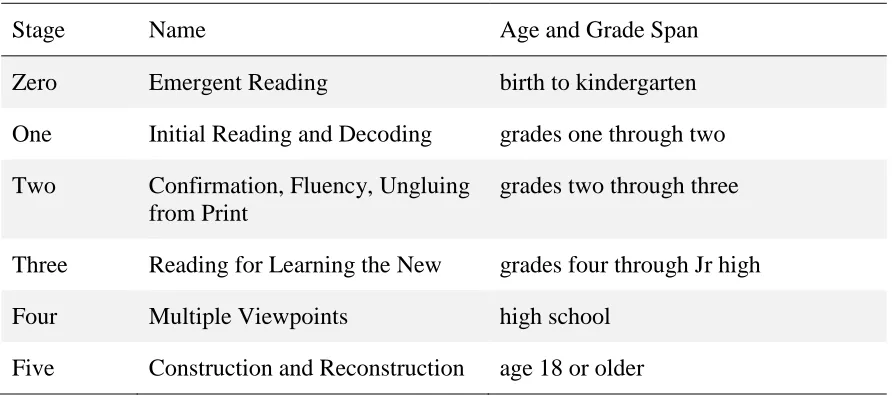
Learning to read typically follows developmental stages, starting at the beginning of a child’s life (Chall, 1967, 1983). In the pre-reading stage (“Emergent Reading” or Stage Zero), oral language, phonological awareness, and letter naming are developed during early childhood and kindergarten. Stage One (“Initial Reading or Decoding”) spans grades one through two. In Stage One children learn the letters of the alphabet and develop sound-symbol associations. In Stage Two (“Confirmation, Fluency, or Ungluing from Print”) occurs in grades two through three. In Stage Two, children learn more difficult words and read more elaborate stories. At the end of this period, students are “ungluing from print.” They are more fluent readers and rely less on decoding. Stages One and Two are the “learning to read” period in a child’s life.
Table 2.1
Chall’s (1967, 1983) Developmental Stages of Reading
Stage Name Age and Grade Span
Zero Emergent Reading birth to kindergarten
One Initial Reading and Decoding grades one through two Two Confirmation, Fluency, Ungluing
from Print
grades two through three
Three Reading for Learning the New grades four through Jr high
Four Multiple Viewpoints high school
Five Construction and Reconstruction age 18 or older
Chall’s (1967, 1983) work does not directly address automaticity, a critical issue of reading. Automaticity is defined as the ability to read without spending mental energy on decoding text (Rasinski, 2004; Samuels, 2002; Stanovich, 1991b). Automaticity enables readers to think about what they read while they are reading. In the schooling of elementary students, automaticity is the shift from “learning to read” to “reading to learn.” As students develop automaticity, they progress through four early phases (Ehri, 1998, 2005; Kuhn & Stahl, 2003).
Ehri’s (1998, 2005) work illustrates the four developmental phases of automaticity. In the first, “pre-alphabetic phase,” students read words through
can decode novel words by making connections between the letters seen in written words and phonemes in the spoken equivalents. In the fourth or “consolidated-alphabetic phase,” students have a bank of sight words in memory. Their print lexicons rapidly expand as they read many more different words. As more words are stored into memory, letter pattern knowledge becomes stronger.
Impact of Reading
As stated previously, learning to read fluently is one of the most significant accomplishments of an elementary school student (Johnson et al., n.d.). Students who achieve reading fluency experience abundant benefits. Students who fail to achieve reading fluency too often experience serious consequences to their academic growth and subsequent life successes.
Growth in reading achievement brings increased vocabulary and greater general knowledge (Cunningham & Stanovich, 1990, 1991, 1997, 1998, 2001, 2003; Stanovich & Cunningham, 1992, 1993). Time spent reading correlates to higher reading achievement (Cunningham & Stanovich, 2001; Taylor et al., 1990). The difference in the amount of time spent reading among students in grades third through fourth can predict with some accuracy, subsequent growth in reading comprehension (Taylor et al., 1990). The correlation between minutes reading at school and reading achievement was .37 (Taylor et al., 1990).
Analysis (Karlsen, Madden, & Gardner, 1984). Print exposure was measured by title and author recognition. In five out of six analyses, the print exposure measure was able to account for the variance in fifth grade reading ability, after adjustments were made for third grade reading ability. It was concluded by the authors that print exposure plays a role in both developing reading ability and contributes to the growth of reading ability.
Cipielewski and Stanovich (1992) examined fifth grade reading comprehension scores as measured by their Stanford Reading Comprehension scores with title and author recognition. It was found that in the fifth grade students, title recognition has a unique variance of 11.0%, when third grade reading comprehension was partialed from the analysis. Author recognition had an 8.1% unique variance when third grade reading comprehension was partialed. The authors concluded that title and author recognition accurately predicted performance on Stanford Reading Comprehension scores for 89% of the students and author recognition accurately predicted approximately 92%.
Cipielewski and Stanovich (1992) also considered the relationship between title and author recognition and the Stanford reading rate subtest. Significant unique variances were found for both measures when third grade reading comprehension was partialed. Unique variances of 10.7% were found for title recognition and 18.5% for author
recognition. Again, the two measures were found to accurately predict reading rate scores with approximately 80% accuracy for title recognition and 81.5% accuracy for author recognition.
predict Iowa reading comprehension scores. Student performance on the Stanford Phonetic Analysis was used to determine the decoding ability that was partialed in this analysis.
Cunningham and Stanovich’s (1997) study showed that first grade students who develop reading skills at a faster rate than their peers are more likely to read more over time. Reading more words further improved their reading comprehension, vocabulary, and general knowledge (Cunningham & Stanovich, 1997). In a long-term follow up within the population, Cunningham and Stanovich (1997) found 11th grade students who experienced early reading success read more as high school students. Children who struggled with reading in first grade but subsequently caught up at grade level in the third and fifth grades also demonstrate more print exposure in 11th grade (Cunningham & Stanovich, 1997).
Early reading success produces a synergy that contributes to reading achievement (Cunningham & Stanovich, 1998, 2001, 2003). Specifically, readers with early reading success read more, develop larger vocabularies, and expand their general knowledge. This is known as the Matthew Effect (Stanovich, 1986). Early reading difficulties are the academic equivalent of the “poor-get-poorer” phenomenon. Young readers who do not learn to read are likely to fall further behind. The students who fall behind are likely to read less and fail to obtain many of the rewards of successful reading.
Successful Readers and Academic Success
Children, 1998). Preschool aged children who are read to have larger vocabularies, greater general knowledge, and better development of ideas (Bus, van IJzendoorn, & Pellegrini, 1995; Cunningham & Stanovich, 1997; Neuman, Copple, & Brendekamp, 1998). At school entry, children who are read to in preschool learn to read and write faster than their peers who were not read storybooks (Bus et al., 1995). Students who are successful readers tend to have better vocabularies and cognitive skills (Cunningham & Stanovich, 1990, 1991, 1997, 1998, 2001, 2003; Stanovich & Cunningham, 1992, 1993). Reading ability and academic success correlate across all grades and university levels (Cunningham & Stanovich, 1997; Elley, 1991; Feitelson et al., 1993; Pretorius, 2000). At all grade levels, academically successful students read more frequently and comprehend more of what they read (Pretorius, 2000). Strong readers experience the “rich-get-richer” side of the Matthew Effect (Stanovich, 1986).
Poor Readers and Academic Struggles
Conversely, most poor readers continue to struggle throughout their school
careers (Stanovich, 1986). Poor readers tend to read less print (Cunningham & Stanovich, 1998, 2001, 2003). Students who read less do not develop vocabulary and reading
Committee on the Prevention of Reading Difficulties in Young Children, 1998).
Especially significant, children who begin school with poor reading ability rarely “catch up” to their peers (Torgesen, 1998).
This paper focuses on a subgroup of lower achieving readers, specifically children identified with specific learning disabilities (SLD). There are many reasons why students may experience reading difficulties. These include (a) speaking a primary language that is not English, (b) low intelligence, (c) poor reading instruction and (d) SLD (Committee on the Prevention of Reading Difficulties in Young Children, 1998; Fletcher et al., 1994; Foorman et al., 1998; Fuchs et al., 2002). The variety of potential causes for reading difficulties can make it difficult to identify students with SLD. Researchers are concerned with the ability to identify students with SLD and separate SLD from other causes of low reading achievement. Students described as “low achievers” have expected reading difficulties because of low intelligence. Students with SLD are unique from other student groups with academic difficulties because students with SLD have “unexpected” learning difficulties. The learning challenges of students with SLD are unexpected because of their average to superior intelligence.
Specific Learning Disabilities
and weaknesses of each diagnostic approach are examined. Finally, the diagnostic procedures used to identify students with SLD in Idaho are presented.
Definition and Identification of Specific Learning Disabilities (SLD)
SLD diagnosis involves educational and psycho-educational assessments, observations, and review of the individual’s medical, developmental, family, and educational history (American Psychiatric Association, 2012). SLD excludes students whose academic difficulties are primarily caused by (a) visual, hearing, or motor
impairments, (b) cognitive impairment, (c) emotional disturbance, (d) environmental, (e) cultural or economic disadvantages, and (f) limited English speaking skills (American Psychiatric Association, 2012; Idaho State Department of Education, 2009; Individuals with Disabilities Improvement Education Act [IDEA], 2004; Stanovich, 1991a).
Furthermore, it must be documented that the academic deficits are not the result of a lack of appropriate instruction (American Psychiatric Association, 2012; Idaho State
Department of Education, 2009; IDEA, 2004; Stanovich, 1991a). Students with SLD have academic achievement that is well below their measured intellectual ability
(American Psychiatric Association, 2012). The intellectual ability of students with SLD is typically within the average to superior range.
An individual with a SLD performs poorly in one or more of the following academic domains: (a) oral expression, (b) listening comprehension, (c) written
achievement, occupational performance, or daily living activities (American Psychiatric Association, 2012).
The identification of students with SLD is a relatively new and challenging practice in education, despite the fact that students with these academic characteristics have existed since the beginning of educational systems (Reschly, 1996; Siegel, 1999a; Vaughn & Fuchs, 2003). Unlike many other disabilities, SLD does not have a clear medical cause (Reschly, 1996). SLD is identified later in childhood. SLD is not discernible in infants, toddlers, and preschool children. The majority of students with SLD are referred for an evaluation only after demonstrating significant and long-term academic and behavioral problems. Students with SLD are difficult to separate from students whose academic deficits are due to ineffective instruction (Baskette et al., 2006; Vellutino et al., 1996).
Traditional Identification of Specific Learning Disabilities
Since 1977 until very recently, the identification of students with SLD relied on the IQ-achievement discrepancy model (Berkeley et al., 2009; Kavale, 2002; Mercer et al., 1996). To be eligible for special education under the IQ-achievement discrepancy model, students must display a significant discrepancy between intelligence quotient (IQ) scores and academic achievement, with the latter falling far below what would be
(Idaho State Department of Education, 2009). For example, a student might have a standard score of 100 points (within the average range) on a standardized IQ test. To be labeled as having a SLD, he or she would have to have a standard score of 85 or lower on an achievement test. This 15 point gap between the IQ score historically has been a primary diagnostic criterion for the label of SLD.
Criticisms of the Traditional Model to Identify Specific Learning Disabilities Over the past two decades the efficacy of the IQ-discrepancy increasingly has come under question. There are several arguments against the use of the IQ-achievement discrepancy model. These include (a) expansion of the number of students labeled as SLD, (b) the variability of eligibility formulas from state to state for SLD, (c) the questionable ability of the discrepancy model to identify “true” SLD, and (d) the consequences of “waiting-to-fail.” “Waiting-to-fail” means that a student must fall significantly behind in academics before he or she can receive special education
(Bradley, Danielson & Doolittle, 2007; Gersten & Dimino, 2006; Lau et al., 2006; Lyon, 1996; Vaughn & Fuchs, 2003; Vaughn, Linan-Thompson, & Hickman, 2003).
Dimino, 2006; Wong, Graham, Hoskyn, & Berman, 2011). If there is an
over-identification of students as SLD, finding a way to more accurately identify students with SLD while minimizing over-identification issues would be of benefit to students as well as school systems (Valas, 1999; Gersten & Dimino, 2006).
Fundamental conceptual and procedural problems may have contributed to the growing numbers of students diagnosed with SLD. The lack of consensus on what constitutes SLD and vague definitions may have contributed to the challenge of accurate identification (Lyon, 1996; Ysseldyke et al., 1983). The numbers of SLD students may have grown because of inconstant state criteria and failure to apply strict adherence to criteria at the local level (Berkeley et al., 2009; Johnson, Mellard, & Byrd, 2005; Mercer, King-Sears, & Mercer, 1990; Ofiesh, 2006; Reschly, 1996; Scruggs & Mastropieri, 2002). The SLD label may be incorrectly applied to students who more accurately fit the criteria of an intellectual disability (MacMillan, Gresham, Siperstein, & Bocian, 1996). The failure of school practitioners to accurately apply federal and state definitions may be a factor in the rising numbers of students labeled as SLD (Lyon, 1996; Mercer et al., 1996; Scruggs & Mastropieri, 2002). In a study review from 1978 to 1999, it was
estimated that 52% to 70% of students identified by the schools as SLD did not meet the eligibility criteria for SLD by federal and state definitions (MacMillan & Speece, 1999).
Critics of the IQ-achievement discrepancy model are dissatisfied with the
and six states required one standard deviation (Mercer et al., 1990). Three states permitted a range of one to 1.5 standard deviations. Five states varied the discrepancy based upon the student’s age, grade, or both age and grade. The problem with the
inconsistency of formulas in the discrepancy model is that a student could be considered as SLD in one state but not in another (Mercer et al., 1990; Moats & Lyon, 1993).
Another argument against the IQ-achievement discrepancy model is the
variability in the number of students identified as SLD among states. The prevalence of SLD between the states ranged from 2% to nearly 9% (Finlan, 1992). In 1992 to 1993, Wisconsin reported 2% of their student population as SLD while Massachusetts
identified 7% (Coutinho, 1995). The variance has been attributed to the differences between state IQ-achievement discrepancy formulas.
2004; Semrud-Clikeman, 2005; Semrud-Clikeman et al., 1992). The IQ-achievement discrepancy approach is likely to inevitably result in misclassification of students with reading difficulties (Vaughn et al., 2003). Students who were not SLD are mislabeled SLD, students with other disabilities are misidentified as SLD, and students who are genuinely SLD can go unnoticed.
The standardized assessments used to identify SLD in the discrepancy model may not effectively separate students who are under-achieving from students with SLD (Fuchs & Young, 2006; Lau et al., 2006; Vaughn & Fuchs, 2003; Vaughn et al., 2003; Vellutino, Scanlon, & Lyon, 2000; Ysseldyke, 2005; Ysseldyke et al., 1983). Defects in
standardized assessments may underestimate the intelligence of students with reading disabilities (Fuchs & Young, 2006; Siegel, 1999a; Vellutino et al., 2000; Ysseldyke, 2005). Standardized assessments cannot make a clear distinction between students who have mild SLD and those who do not have SLD but have difficultly reading for other reasons (Reschly, 1996). The result is that students with mild SLD may not be identified under the discrepancy model. Inherent linguistic and cultural biases in standardized assessments may over-identify poor, minorities, and culturally and linguistically diverse students as SLD (Artiles & Trent, 1994; Garland & Strosnider, 2005; Lau et al., 2006; Reschly, 1996; Semrud-Clikeman, 2005; Ysseldyke, 2005). Finally, national normative data of standardized assessments may not reflect the population of the students within a school district (Siegel, 1999a; Vaughn & Fuchs, 2003; Vellutino et al., 2000; Ysseldyke, 2005).
history, most notably the quality of past reading instruction (Velluntino et al., 2006). Standardized academic achievement tests used in the discrepancy model may not match the curriculum taught (Fuchs & Young, 2006; Lau et al., 2006; Vaughn & Fuchs, 2003; Vellutino et al., 2000; Ysseldyke, 2005).
Significantly, the IQ-achievement discrepancy calculation does not inform remediation (Aaron, 1991; Semrud-Clikeman, 2005; Siegel, 1999b; Vaughn & Fuchs, 2003). When given the standard scores from IQ and achievement assessments, educators may underestimate the capabilities of students, causing teachers to reduce expectations for reading achievement (Ysseldyke, 2005). The result perpetuates the Matthew Effect by setting low expectations for students that are capable of achieving reading proficiency (Cunningham & Stanovich, 1998, 2001, 2003; Morgan, Fuchs, Compton, Cordray, Fuchs, 2008; Ysseldyke, 2005).
Finally, the discrepancy model or “waiting-to-fail” requires students to fall too far behind in academics before they can receive interventions (Bradley et al., 2007; Gersten, & Dimino, 2006; Lau et al., 2006; Lyon, 1996; Vaughn & Fuchs, 2003; Vaughn et al., 2003). In general, remediation is given to students only after they meet eligibility criteria as SLD under the IQ-achievement discrepancy model. One reason for the delayed
(Lyon, 1996; Stage et al., 2003; Stuebing, Fletcher, & LeDeux, 2002). Seventy-four percent of the students with SLD were identified at ages 8 or 9 (Lyon, 1996). The reading problems of the students typically were known early in their academic career, but they did not meet the eligibility criteria until they were in the third or fourth grade. By then, the students experienced common problems associated with reading difficultly. The common problems associated with poor reading achievement are low self-esteem, decreased motivation, and never fully acquiring basic reading skills. The cost of “waiting-to fail” is the time that could have been spent on remediation (Lyon, 1996; Vaughn et al., 2003).
Early intervention may prevent long-term reading difficulties (Vellutino et al., 2006). Struggling students who received reading interventions only during their kindergarten year or interventions in kindergarten and first grade performed better on emergent literacy skill assessments than those who did not receive any interventions in reading. The majority of the students who received early intervention were no longer at risk. The discrepancy model may make it difficult to identify younger students with SLD and prevent the benefits of early interventions (Fletcher et al., 1994; Gersten & Dimino, 2006; Semrud-Clikeman, 2005; Ysseldyke, 2005).
education to students with mild SLD because they may experience academic challenges and face limited career opportunities as a consequence (Reschly, 1996). An awareness of the importance of phonological awareness in reading development has also contributed to increased identification rates (Lyon, 1996; Wong et al., 2011). Phonological awareness assessments may help identify younger students in late kindergarten and early first grade with SLD.
Contemporary Identification of Specific Learning Disabilities
Response to Intervention (RTI) is a general education approach that has emerged in the last decade to systematically address students who struggle with academic and behavioral challenges. RTI uses problem-solving and student-centered models to provide interventions for students who have trouble learning to read (Berkeley et al., 2009; Johnson, Mellard, Fuchs, & McKnight, 2006). RTI requires targeted and researched-based interventions. RTI may add more instructionally relevant data than is collected in the IQ-achievement discrepancy model because progress monitoring probes and
interventions are similar to the core curriculum (VanDerHeyden, Witt, & Gilbertson, 2007; Lau et al., 2006). RTI puts more emphasis on student outcomes instead of IQ and achievement tests (Kavale, 2005). The reauthorization of the Individuals with Disabilities Education Improvement Act of 2004 allows for RTI to be an alternative means of
Within the RTI model are two approaches to intervention implementation. They are (a) the problem-solving approach, and (b) the protocol system approach (Buffum, Mattos, & Weber, 2009; Marston, 2005). The problem-solving approach has four stages (problem identification, problem analysis, plan implementation, and plan evaluation). To illustrate how the problem-solving approach works, consider a first grade student who has difficulty with letter sound fluency. A problem-solving team moves systematically through each of the aforementioned four stages to design an individualized intervention.
The second RTI approach is the standard treatment protocol system (Buffum et al., 2009; Marston, 2005; Wong et al., 2011). The standard treatment protocol has been more researched than the problem-solving approach (Wong et al., 2011). In the standard treatment protocol system, the student firsts meets established criteria for intervention (Buffum et al., 2009). The intervention is matched to address the student’s skill deficit. To understand how this approach works, consider the first grade student who has
difficulty with letter sound fluency. The first grade student’s performance on letter sound fluency universal screen fell below the 25th percentile. This student would quickly be placed in a supplemental reading program along with other students with the same profile.
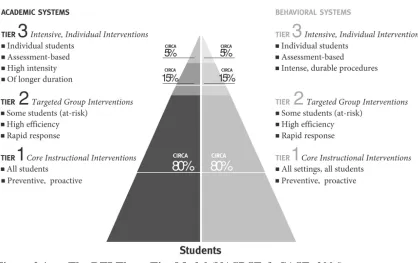
Special Education & Council of Administrators of Special Education, NASDSE & CASE, 2006). The tiers differ in frequency and intensity of interventions (Buffum et al., 2009). The most common RTI model has three tiers, although some models have four or more tiers (Buffum et al., 2009; Mellard & Johnson, 2008; Shapiro, n.d.). For the
purposes of this paper, the three-tier model will be described to illustrate the RTI process of SLD identification.
Tier 1 is also known as the core, base, primary, or universal program (Buffum et al., 2009; Marston, 2005). Tier 1 is the initial level instructional practices. The teaching and school experiences in Tier 1 are what all students encounter every day. At the Tier 1 level, general education teachers implement scientifically based instruction and core curriculumwhile closely monitoring their students’ academic progress, especially the students who are found to be at risk on universal screening assessments (Fuchs & Deshler, 2007; Hughes & Dexter, n.d. a; Mellard & Johnson, 2008; NASDSE & CASE, 2006). Approximately 75% to 80% of all students are should be able to demonstrate adequate educational progress when receiving instruction at the Tier 1 (Buffum et al., 2009; NASDSE & CASE, 2006). Universal screenings of academic skills are given to all students several times per school year to identify students who are potentially at risk for academic failure (Mellard & Johnson, 2008).
Students who are struggling academically at the Tier I level then move on to receive research-based interventions in the general education setting in Tier 2. Tier 2 is known as “supplemental level” or “secondary intervention” because the interventions are in addition to Tier 1 instruction (Buffum et al., 2009; Marston, 2005; Swanson &
school (NASDSE & CASE, 2006; Swanson & Vaughn, 2011). Tier 2 interventions generally include small group instruction, along with instruction in the general education classroom (Fuchs, Compton, Fuchs, Bryant, & Davis, 2007; Mellard & Johnson, 2008; Swanson & Vaughn, 2011). The small groups of three to five students are formed based on the homogeneous needs of the students (Mellard & Johnson, 2008; Swanson &
Vaughn, 2011). Interventions in Tier 2 usually include increased intensity, frequency, and duration of interventions. The short-term interventions last from nine to 12 weeks and are often provided three to five days per week for 30 to 60 minutes per session. Tier 2 interventions are typically implemented by the general education classroom teacher, specialists, or supervised paraprofessionals (Swanson & Vaughn, 2011). In Idaho, Tier 2 interventions are legally required to be different from and in addition to the core
instruction (Idaho State Department of Education, 2009).
Tier 3 is considered the “intensive level” of intervention (Buffum et al., 2009; Marston, 2005). Tier 3 targets approximately the 5% - 10% of the remaining student population who present the greatest educational challenges (Buffum et al., 2009; NASDSE & CASE, 2006). Tier 3 may offer (a) different interventions than Tier 2, (b) offer the same interventions but increases intervention time, and/or (c) increased frequency of progress monitoring (Buffum et al., 2009; Fuchs et al., 2007). Tier 3 interventions are more intense and include small group and individual instruction (Marston, 2005; Mellard & Johnson, 2008; Swanson & Vaughn, 2011). Tier 3 interventions are typically implemented by reading specialists, supervised
collaboration with a special educator. If the interventions do not work, the student may be referred to special education. In some models, Tier 3 is seen as synonymous with
traditional special education placement (Fuchs et al., 2007; Mellard & Johnson, 2008). In the models that equate Tier 3 with special education, students enrolled in special
education receive specially designed instruction from a special education teacher or supervised special education paraprofessional.
A visual representation of the RTI model is presented in Figure 2.1. The RTI model depicted below illustrates the structure for academic and behavioral systems. The bulk of the student population is in Tier 1 are at the bottom of the pyramid. A small percentage of students are in Tier 2. At the top of the pyramid, the fewest number of students are in Tier 3.
Criticism of the Contemporary Model to Identify Specific Learning Disabilities There are several arguments against RTI, including (a) lack of research
documenting its educational efficacy, (b) role changes of educational staff, (c) funding, and (d) the time it takes to identify students with SLD. Some critics have claimed that RTI ignores the well-established body of research that has emerged since the 1970s to describe the SLD construct (Kavale, 2005). The RTI model may be unable to sort students with SLD from students with other types of disabilities (Kavale, 2005). When students are labeled SLD through the RTI approach without assessments of cognitive processes, students who do not truly have SLD may be inappropriately included in the category (Baskette et al., 2006; Goodman & Webb, 2006; Kavale, 2005; Mastropieri & Scruggs, 2005).
The second issue is concerned with the potential to over identify students as having SLD. Under the IQ-discrepancy model, the majority of the students were
identified as SLD in grades three or four (Baskette et al., 2006). If RTI is used to identify students as SLD, too many kindergarten through fourth grade students could be labeled as SLD, thus significantly increasing the numbers of students in special education. The potential to over identify students with SLD may be difficult to avoid because RTI targets interventions for students who score at the 25th percentile rank or lower on reading assessments (Gerber, 2005; Kavale, 2005).
(Cortiella, 2011). There were several reasons for the decline in the percentages of students identified as SLD, including number of struggling students receiving preventative interventions because of RTI.
The third argument against RTI is in the inconsistent implementation of RTI across the states. RTI models, procedures, and practices differ from state to state, making RTI as inconsistent as the IQ-discrepancy model (Berkeley et al., 2009). States vary in the RTI approach that they choose (Hallahan et al., 2007). For example, some states require the exclusive use of phonologically based reading interventions, while other states allow any scientifically based curriculum for RTI interventions (Baskette et al., 2006). The differences in RTI practices between states may result in variability of SLD
prevalence among states. There is a wide range of RTI interventions and this might cause a higher variability in prevalence rates of SLD students in states that use RTI to establish eligibility for special education (Baskette et al., 2006; Hallahan et al., 2007).
those targeting culturally and linguistically diverse students is needed (CLDS; Ehri et al., 2001). In addition, more research is needed to find research-based interventions that can be “realistically and reliably” implemented by general education teachers (Speece, Case, & Molloy, 2003).
Another criticism of RTI is its potential to change the roles of teachers, special educators, and school psychologists (Gerber, 2005; Gersten & Dimino, 2006; Mastropieri & Scruggs, 2005). In RTI, teachers may have the primary responsibility to provide instruction at all three tier levels, while continuing to monitor progress of all students, and move students between the tiers (Gerber, 2005; Gersten & Dimino, 2006; Mastropieri & Scruggs, 2005). The roles of special educators and psychologists are less clear until the point of referral to special education (Gerber, 2005; Gersten & Dimino, 2006;
Mastropieri & Scruggs, 2005). General education classroom teachers will be responsible for the delivery of scientifically based instruction in Tier 1, but may not have the
knowledge or tools to accomplish this task (Mastropieri & Scruggs, 2005).
Concern about funding is yet another criticism of RTI. Some oppose RTI because of the provision under the IDEA 2004 that allows local education agencies to use up to 15% of their IDEA Part B funds for early intervention. These critics worry that using the IDEA funding in the general education setting will take money from limited special education funds (Kavale & Spaulding, 2008; Mastropieri & Scruggs, 2005; Scruggs & Mastropieri, 2002).
Tier 2 interventions generally last from eight to 12 weeks (Idaho State Department of Education, 2009; Mellard & Johnson, 2008). This could mean that a student with SLD would have to show a failure to respond to interventions for a minimum of two to three months before being referred for a special education evaluation. However, the argument about length of time to identify students with SLD under RTI can also be made against the IQ-discrepancy approach. As discussed earlier, critics call the IQ-achievement
discrepancy approach “waiting-to-fail” because the processes to deliver special education to students with SLD takes several academic years (Baskette et al., 2006; Montgomery & Moore-Brown, 2006).
In contrast, students can obtain interventions at an early age with RTI. RTI is considered a “preventative model” because interventions may be provided as soon as a reading problem is identified. Furthermore, RTI interventions may prevent placement in special education because early intervention may help the student overcome the learning difficulty, thus making further special education considerations unnecessary (Bradley et al., 2007; Fletcher et al., 2004; Gersten & Dimino, 2006; Lau et al., 2006; Semrud-Clickeman, 2005; Shaywitz et al., 2004; Vaughn & Fuchs, 2003).
scientifically based instructional practices and curriculum (Foorman, 2007; Fuchs & Deshler, 2007). Documents about effective reading instruction techniques and tools are available through the National Institute of Child Health and Human Development (NICHD) and the National Research Council (NRC; Foorman, 2007).
A Blended Approach to the Identification of Students with Specific Learning Disabilities
At the present time, RTI as a means to identify students with SLD is not mandated but permitted in the reauthorization of the Individuals with Disabilities Education
Improvement Act (IDEA) of 2004 (Berkeley et al., 2009; Bradley et al., 2007). The act continues to allow states to use the traditional IQ-achievement discrepancy criterion to identify students as learning disabled (Kavale & Spaulding, 2008). States may also employ a combination of the approaches as criteria for the category of SLD. Merging parts of RTI and comprehensive psychometric assessments as a means to identify
students with SLD may satisfy both camps in the debate (Baskette et al., 2006: Bradley et al., 2007; Barth et al., 2008; Batsche et al., 2006; Kavale & Spaulding, 2008; Fletcher et al., 2004; Fuchs et al., 2010; Keogh, 2005; McKenzie, 2009).
Including an assessment of cognitive processes with RTI may be an effective means of identifying students suspected of having SLD (Johnson et al., 2010). The meta-analysis of 32 studies found moderately large to large effect sizes (ES>.80) in cognitive processing differences between students with SLD and typically achieving students. The cognitive processes related to reading are working memory, processing speed, executive function, and receptive and expressive language. Students with SLD performed
significantly lower on all cognitive processing areas than their typically achieving peers. A blended approach is consistent with the historical definition of SLD because the central characteristic of unexpected academic underachievement is maintained (Fletcher et al., 2005; Fletcher, Morris, & Lyon, 2003). Additionally, the discrepancy component in the blended approach is preserved; however, the discrepancy is not the gap between IQ and achievement. The discrepancy in the RTI model occurs when the student
demonstrates a significant lag in academic performance and fails to respond adequately to the intervention (Fletcher et al., 2005). Students with (a) average IQs, (b) achievement below the 25th percentile, and (c) lack of response to Tier 2 levels of RTI instruction were more likely to have SLD (Johnson et al., 2010). When a student fails to make the expected gains during reading intervention, in many cases the student may be referred for a SLD special education evaluation (Fletcher et al., 2003, 2005).
Since August 1 of 2010, the state of Idaho adopted a blended approach to determine eligibility for SLD (Henderson & Hopper, 2010; Hyatt, 2010; Idaho State Department of Education, 2009). To meet eligibility for SLD in Idaho, a student must fail to make significant gains during RTI, show low achievement on achievement
weaknesses (Idaho State Department of Education, 2009). The psychological processes must be related to the area of academic concern (Hyatt, 2010). Phonological processing, processing speed (rapid automatized naming), and memory are some examples of psychological processes used in reading.
There are many reasons for Idaho’s change to the blended model (Henderson & Hopper, 2010). First, the new eligibility criteria for SLD more accurately fit the federal definition. The new approach to identify SLD is consistent with the evidence that demonstrates that students may have impairments in specific areas. The blended model allows for the evaluation and intervention process to be more closely linked to the specific needs of the student suspected of having SLD. The decision to change the eligibility criteria reflects research opposed to the IQ discrepancy model. Finally, it is hoped that the change in eligibility criteria will lead to more accurate labeling of students as SLD.
the text (Rasinski, 2004; Samuels, 2002; Stanovich, 1991b). Reading prosody is the ability to read with correct expression and phrasing (Rasinski, 2004). Students with SLD may not read as much as their non-SLD peers (Cunningham & Stanovich, 1998, 2001, 2003). Students with SLD have an increased risk of dropping out of school (Blackorby & Wagner, 1996).
The Need for Early Identification of Reading Difficulties
The ability to identify students with potential reading difficulties early in the school career is critical for students, educators, and schools. A number of studies have documented the impact of early intervention. First grade students with difficulty in reading have been found to improve on standard reading measures after receiving interventions (Berninger et al., 1999). First grade students who were identified as at-risk for reading difficulties and given interventions outperformed their matched peers who did not receive interventions on reading and phonological-processing assessments (Hurford & Johnson, 1994). First grade students with reading difficulties who were tutored by non-certified tutors for 30 minutes, four days a week over one school year significantly outperformed non-tutored peers on reading tasks (Vadasy, Jenkins, & Pool, 2000).
high school (Cunningham & Stanovich, 1997; Davis, Lindo, & Compton, 2007; Fletcher et al., 2002).
The risk of “waiting-to-fail” before intervention may cost the student with reading difficulties the opportunity to compensate (Semrud-Clickeman, 2005; Shaywitz et al., 2004). Early intervention is important to combat low motivation and the fear of failure in students with reading difficulties (Hudson, High, & Otaiba, 2007; Semrud-Clickeman, 2005; Shaywitz et al., 2004).
Reading Achievement and Accountability
Under current educational policy, educators are held accountable for student achievement (Castillo, 2005; Schilling, Carlisle, Scott, & Zeng, 2007). The NCLB
reauthorization and made substantial changes to the Elementary and Secondary Education Act (EASA; 1965; Jorgensen & Hoffmann, 2003). NCLB requires all students in grades three through eight and grade ten to have proficiency rates of 100% in reading, language arts, and math, and meet graduation requirements by 2014 (Davidson, Reback, Rockoff, & Schwartz, 2013; Linn, Baker, & Betebenner, 2002).
2012b). Twenty-six additional states, including Idaho and the District of Columbia applied for waivers (U.S. Department of Education, 2012b). Idaho received a waiver in October of 2012 (U.S. Department of Education, 2012a).
NCLB requires that states create an assessment system that tracks the academic achievement of students (Jorgensen & Hoffmann, 2003; U.S. Department of Education, 2003). States must test all students in grades three through eight and grade ten each year in reading and mathematics (Jorgensen & Hoffmann, 2003; U.S. Department of
Education, 2003). The tests are based on the state standards, with the results made public (Jorgensen & Hoffmann, 2003; U.S. Department of Education, 2003). In response, the state of Idaho developed a comprehensive assessment system that goes beyond the
requirements of NCLB (Barr, Joyner, Parrett, Willison, 2004). Idaho’s assessment system begins with kindergarten and continues through high school. The assessment system includes reading, math, and language arts. The Idaho Reading Indicator (IRI) is the assessment tool used as a universal reading screen to identify students at-risk for reading failure for grades kindergarten through third. The additional purpose of the current IRI is to measure individual student growth (Idaho State Department of Education, 2013).
The Idaho Reading Indicator (IRI)
“mastery of the skills.” A score of three is considered “proficient.” A student score of “2” indicates “partial mastery of some or all skills.” A student score of “1” indicates “a lack of mastery of some or all skills.”
History of the IRI
The development of the IRI began years before the initial legislation to assess the reading abilities of all primary elementary students was enacted in 1999. In 1997, the Reading Study Committee was formed after resolutions were passed by the Idaho legislature directing the Idaho State Department of Education to conduct a study of reading education in Idaho (Barr, Flachbart, & Stewart, 2002). The Reading Study Committee consisted of the State Superintendent of Public Education, 25 professional committee members, and consultants. The Reading Study Committee commissioned a preliminary reading test to determine the status of reading education in Idaho. The study found that 40% of Idaho fourth grade students were reading below grade level. Initiatives were recommended to guarantee the right of all Idaho school children to read. An Interim Legislative Reading Committee was appointed in 1998 and continued the work of the Reading Study Committee by drafting the legislation for the Comprehensive Literacy Act. In 1999, the Idaho legislature passed the Idaho Comprehensive Literacy Act (Idaho Code 33-1614, 33-1615). Since 1999, all public school students, kindergarten through third grade, have been given the IRI to identify students below grade level in reading (Idaho Comprehensive Literacy Act, Idaho Code 33-1614).