Semnan University
Journal of Heat and Mass Transfer Research
Journal homepage: http://jhmtr.journals.semnan.ac.irGDL construction effects on distribution of reactants and
electrical current density in PEMFC
Reza Bahoosh
*, Moosa Jafari, Seyed Saied Bahrainian
Faculty of Mechanical Engineering, Shahid Chamran University of Ahvaz, Ahvaz, Iran.
P A P E R I N F O A B S T R A C T
Paper history: Received: 2018-12-01 Received: 2019-03-19 Accepted: 2019-04-24
In this article, a two dimensional pore scale model of polymeric fuel cell, which is promising of a clean and renewable energy production, is presented here. Let reactive gases behave as an ideal gas; inhomogeneous anisotropic structure of the gas diffusion layer, is contemplated as a random generated circular porous media. Lattice Boltzmann method is applied to inquire the fluid flow and mass transfer within the cathode microstructure. All parts of the cathode have the same temperature and the electrochemical reaction on the surface of the catalyst layer enters the solution as a boundary condition. Effects of the gas diffusion layer structure (carbon fibers diameters changes) on the flow of reactive gases, molar fraction of various oxygen species, and water vapor within the various parts of the gas diffusion layer as well as the electrical current density are investigated. The results indicate that by increasing the diameter of the carbon fibers in the gas diffusion layer within constant porosity facilitates both the flow of oxygen and the vapor species inside the GDL, while affecting the produced electrical current on the surface of the catalyst layer.
DOI: 10.22075/jhmtr.2019.16653.1224
Keywords: GDL Construction; Reactants distribution; Electrical current density; PEMFC.
© 2019 Published by Semnan University Press. All rights reserved.
1.
Introduction
Fuel cell technology is a promising clean alternative energy as a result of high efficiency of the direct conversion of chemical energy to electrical energy with very low environmental impacts. Among the various types of fuel cell, proton exchange membrane fuel cells (polymer fuel cell) can be applied as a reliable equipment in the industry, resorts, transportation system, military industry, and both small and large scale dispersed generation systems due to high efficiency, quick startup, high power density, low corrosion, light weight, longevity and lower operating temperatures (60 to 85°C) [1–5].
Low durability and high energy cost of fuel cell energy compared to other energy sources are the main obstacles to the growth of this technology. In order to apply this technology on a large scale, the cost of electrical energy by fuel cells should be reduced to be able to compete with other sources of electrical energy. Numerous studies have been conducted in the last two decades to improve the
*Corresponding Author: R. Bahoosh, Faculty of Mechanical Engineering, Shahid Chamran University of Ahvaz, Ahvaz, Iran.
Email: [email protected]
performance of proton exchange membrane fuel cells [6– 12].
In fact, while general models provide good information on the effects of various parameters on the performance of fuel cells, they hardly are able to predict the effects of structural modificationson the performance of the cell components. In partial models where only one or more components of the fuel cell are modeled, transport mechanisms are simulated in a relatively short time with high precision. The most important advantage of the Lattice Boltzmann Method (LBM) is its ability to model flow in complex media. Consequently, this method is extensively applied to model various fuel cell components[13–18].
catalyst layer. In the absence of this layer, the membrane is completely dried due to the flow of gases in the channel. Meanwhile, this layer plays an important role in the transfer of heat from reactive sites and water management in the fuel cell. Water vapor formed in the catalyst layer is directed to the outlet channel by diffusion and avoids the flow path of the gas stream and reactive sites be closured and reduced, respectively [19].
Given the essential role of the gas diffusion layer, many studies have been conducted on the simulation of flow of reactive gases, heat transfer and flow of water droplets within the gas diffusion layer[20–25] .Despite the higher speed of continuous macroscopic models [20, 21] than microscale models in numerical solution (As a result of the less computational volume), those models neglect the effects of the real structure and heterogeneous features of GDL. Therefore, empirical correlations should be applied in these models for averaging leading to unrealistic distributions within the GDL in some cases [25].Afterwards, the lattice-pore network and LBM are used to understand more details of the model.[22–25]
Contemplating the heterogeneous anisotropic structure of the GDL, permeability has been calculated with the aim of increasing the accuracy of fuel cell modeling [27, 28]. However, properties such as permeability, tortuosity and diffusion coefficient in this porous layer are affected by the porous structure of the gas diffusion layer.
The structure of the gas diffusion layer at the time of production may vary depending on the diameter of carbon fibers and the level of adhesives or hydrophobic additives. It can also be changed while assembling of cell components because of clamping pressure. There are several examinations on the effects of clamping pressure modifies on the transport coefficients as well as the performance of polymer fuel cell[29–31]. Compression of the gas diffusion layer and a subsequent decrease in porosity, and tortuosity as well as GDL’s permeability below the collector plate will affect the flow of reactive gases and thereby the performance of the fuel cell. Its performance can be influenced by non-uniform distribution of porosity [31] as well.
Chen et al.[32] applied FVM and LBM to simulate fluid flow and mass transfer in gas channel and GDL of a proton exchange membrane fuel cell. They proposed a 2-D model consists of gas channel, GDL and catalyst layer and reported gas velocity vectors in the model domain and reactants mole fraction distribution for several over-potentials within the GDL.
Molaeimanesh and akbari[33] proposed a 2-D pore-scale model based on the lattice Boltzmann method for the cathode electrode of a PEM fuel cell with heterogeneous and anisotropic porous gas diffusion layer and inter-digitated flow field. They inspected the effects of some operation and scale parameters including activation over-potential, pressure differential between inlet and outlet channels and ratio of land width to channel width, as well as channel width.
Li et al.[25] investigated pore-scale flow and mass transport in a carbon paper gas diffusion layer of interdigitated PEMFC by LBM. Their results display great effects of GDL pore structures on fluid flow, mass transport, local current density distribution and liquid water behaviors.
Fishman [34] and Nabovati et al.[35] produced a three-dimensional GDL structure to examine the effect of volume fraction of adhesive and hydrophobic additives and heterogeneous porosity distribution on the permeability and tortuosity of GDL.
Despite the essential role of porosity in the fluid flow in porous media such as GDL, the pore network in the GDL may vary with solid particle diameter, arrangement of solid particles (fibers in GDL) and presence of additives such as adhesives and PTFE [36]
As mentioned above, GDL directs reactants towards the catalyst layer to perform an electrochemical reaction. In addition to the effect of GDL structure on permeability, it also affects the flow of reactive gases in this layer.
Despite the numerous studies on the effect of the structure related to the gas diffusion layer for transport parameters [27–32], or study on the change in the permeability by changing the diameter of solid particles within the porous medium [36], there is no study on the flow of reactive gases inside the fuel cell cathode which deals with modifications in fluid flow as a result of the changes in pore network of the GDL. Although the two-dimensional model proposed by Le et. Al [25] and Molaeimanesh[33] for the cathode is used in this paper; but the porous environment of the gas diffusion layer is modeled completely different.
This study investigates the effect of GDL structural changes due to the change in the cross-section of carbon fibers on the flow of reactive gases and electrical current density.
For this purpose, a two dimensional model of polymer fuel cell cathode with an interconnected flow field is presented. The gas diffusion layer is made using randomly generated solid particles. The effect of carbon fiber diameter on the pathways of reactants is surveyed at different porosities of the gas diffusion layer.
In the next sections, the LBM, the governing equations and the numerical solution method for a multicomponent flow are briefly discussed. Then, the structure of the cell consisting of GDL and catalyst layer as well as boundary conditions, assumptions and the method for modelling the cathode are explained. Finally, the model is validated and the results on the effect of carbon fiber cross-sectional diameter on the gas flow and the electric current density are discussed.
2.
Numerical solution method
2.1. Lattice Boltzmann method: concepts
computational fluid dynamics method which simulates fluid flow in a completely different way from traditional methods. LBM is based on the kinetic theory and Boltzmann's equations. Fluid flow is described by distribution functions which indicate the probability of finding a fluid particle in a range of velocity and location[37].
LBM includes two stages: (1) fluid flow where particles move on paths computed by the type of lattice arrangement and (2) collision which provides new distributions in each network based on predetermined collision rules. Applying the relationship proposed by Bhatnagar, Gross and Krook for modeling particle collision, the Boltzmann's transport equation is as follows [38]:
(1) fi(r + ci∆t . t + ∆t) − fi(r. t) = −
1
τ(fi(r. t) − fieq(r. t))
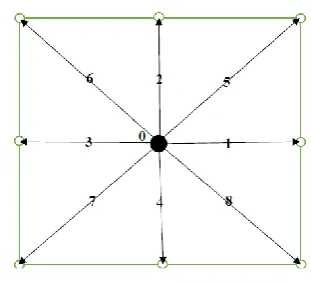
The first step for LBM modeling is to select an appropriate lattice arrangement for the problem under study. Basically, the arrangement is displayed as DnQm where n and m respectively indicate the number of dimensions and the number of flow paths. Contenplating the two-dimensional model of the fuel cell cathode is used in this study. To model the fluid flow, it is necessary to consider 9 paths for the distribution of particles. Hence, the D2Q9 arrangement (Fig. 1) is applied in the present model in which the particle velocity in different paths, ci, in Eq. 1, is defined as follows:
ci=
{
0 i = 0 (cos [(i − 1)π2 ] . sin [(i − 1)π2 ]) i = 1.2.3.4
√2 (cos [(i − 5)π
4 +
π 4] . sin [
(i − 5)π
4 +
π
4]) i = 5.6.7.8
(2)
In LBM, the equilibrium distribution function, feq in Eq. (1), must be defined. This function is expressed as follows in problems involving fluid flow:
(3) fieq= wif [1 +
ci∙ u
(cs)2+
(ci∙ u)2
2(cs)4 −
u ∙ u 2(cs)2]
In Eq. (3), cs, is the velocity of sound in the fluid and ci=Δx/Δt is the particle velocity in various directions of the Lattice Boltzmann and is considered equal to 1. After applying the general equation of the Lattice Boltzmann (Eq. (1)), on the lattice arrangement selected for the solution domain in the flow and the collision stages, the distribution functions, fi, are obtained at each node. Thereafter, macroscopic hydrodynamic properties including density (ρ), velocity (u), pressure (P) and viscosity (υ) can be easily computed:
ρ= ∑ fi i
(4)
ρu = ∑ fici i
(5)
𝑃 = 𝑐𝑠2𝜌 ; 𝑐𝑠2= 1 3⁄ (6)
𝜐 =Δ𝑥
2
3Δ𝑡( 1
𝜏− 0.5) (7)
Figure 1. D2Q9 arrangement
Application of boundary conditions in LBM is not explicitly as in the traditional computational fluid dynamics methods. In this method, fi should be first determined in the boundary nodes. To this end, solving equations according to the type of boundary conditions to obtain unknown distribution functions is essential. The bounce-back boundary condition is one of the most widely applied boundary conditions when LBM is used for fluid flow within complex microstructures. This boundary condition is applied when the flow of fluid is simulated on a stationary solid or a moving object. This boundary condition uses this hypothesis that fluid particles colliding a solid surface are returned to the solution domain. More details on LBM as well as boundary conditions including constant velocity or pressure, wall, non-slip, alternating boundary condition, symmetry, specific flux on the boundary, and so on can be found in the literature on LBM [39], [40].
2.2. Lattice
Boltzmann
method
for
a
multicomponent single-phase fluid flows
Active and passive methods are applied to model a multicomponent fluid flow [33] . In the passive approach, the flow is solved only for a species with a larger mole fraction than the rest of species in the mixture. In contrast, flow and collision stages in LBM are solved for all species separately in the active approach used in this study. In the active approach that is in fact inspired by the multiphase flow model of Shan and Chen [41] , the combined velocity (Eq. 8) is used instead of the velocity of each species:
u⃗ comp=
∑ τ1 n∑ fn
iC⃗ i i n
∑ τ1 n
n
(8)
The index n in Eq. (8) represents each of the species in the mixture.
3.
Cell cathode model and boundary
conditions
3.1. Polymer fuel cell cathode
components of the cathode. Dry air (79% N2 with 21% O2) enters the cathode through the inlet channel. Oxygen reaches the catalyst layer through diffusion and convection mechanisms by passing the GDL and reacts with hydrogen ions produced in the anode. Water is produced by the reduction of oxygen in the cathode electrode based on the following equation:
4𝐻++ 𝑂
2+ 2𝑒−→ 2𝐻2𝑂 (9)
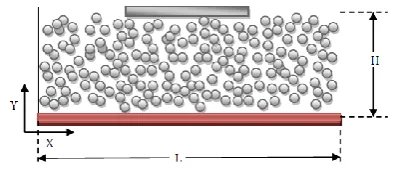
It is here assumed that water is produced in the form of water vapor and behaves like an ideal gas. Different arrangements have been proposed for the gas flow channel to improve the flow of gas within the gas diffusion layer as well as increasing the rate of water transfer in GDL. Spiral, parallel and interconnected configurations are among the most widely applied gas channel designs. Among them, the interconnected channel arrangement presented by Nguyen[42] has received much attention. As a result of the general application and high efficiency of this flow field, the mentioned arrangement is used in this study. In the inquired flow field (Fig. 2), the pressure difference between the inlet and outlet channels play a key role in the flow of reactive gases within the GDL so that an increase in ΔP increases the gas flow by advection. Figure 3 indicats the computational domain consisting of a gas diffusion layer, inlet and outlet gas channels and a catalyst layer. As it can be observed, only half of the gas inlet and outlet channels is contemplated within the solution domain because of the symmetry and to reduce computational time.
Figure 2. fuel cell cathode with interdigitated flow field design
Figure 3. Schematic of problem domain
3.1.1. Gas diffusion layer modelling
In addition to the uniform flow of reactive gases towards the catalyst layer, the gas diffusion layer should drive the generated water, as the byproduct of the reaction, out of the cell. The lack of water removal from the cell will increase the probability of flooding and reduce the performance of the cell. In addition, this layer acts as support for the catalyst layer and should have a reasonable electrical conductivity to transmit electrical current. As a result of the pressure applied to the cell components by clamping, the gas diffusion layer should also have a sufficient mechanical strength. Accordingly, GDL is mainly constructed from conductive porous materials like carbon. Porous carbon layer is available as carbon paper by compressing carbon fibers (non-woven) and carbon fabrics (woven). The two types of porous carbon differ in terms of thickness, flexibility, porosity and permeability and are applied depending on the intended application. GDLs made of carbon paper are thinner with less flexibility and are widely used because of high permeability for gases and high electrical conductivity. Due to lower cost and easier creation of a micro-porous layer or a catalyst layer, fuel cell manufacturers often utilize carbon paper [43].
are usually used due to high cost, time consuming and complexity of imaging methods[45].
Assuming that the fiber cross sections in the two-dimensional model are circles of the same diameter, randomized generation method is applied in this study to achieve the GDL structure with the desired porosity. By generating random points inside the solution domain as the center of solid particles in the porous medium (Fig. 3), the nodes of the lattice located at a radius less than the diameter of the carbon fiber are considered as solid. It is also assumed that carbon fibers do not overlap and the generation of random points in different diameters continues to reach the desired porosity.
3.1.1.1. Permeability and tortuosity
Resistance to fluid flow is one of the important features of porous media which is characterized by the permeability parameter, K. In consonance to with the Darcy equation, for a continuous single-phase flow with constant fluid properties, the permeability at low Reynolds changes with the pressure gradient as follows [46]:
𝐾 = −𝜇〈𝑢〉 ∆𝑃
(10)
In Eq. 10, 〈𝑢〉 is the average volume velocity of the fluid, μ is the dynamic velocity and ΔP is the applied pressure difference in the sample volume. The permeability modifies with the shape and position of the cavities inside the porous medium. In the fiber porous media, topology and morphology of pores are dependent on the diameter of pores, volumetric porosity and distribution of fibers in the porous medium. Kozeny-Carmen correlation is widely applied to estimate the permeability of a randomized porous medium [47]:
𝐾 = 𝜀
3
180(1 − 𝜀)2𝑑2 (11)
In the Kozeny-Carmen correlation, ε is porosity and d represents the mean diameter of solid particles in the porous medium. Applying LBM, Koponen et al. [48] obtained the permeability in a three-dimensional porous medium with randomly distributed fibers. They proposed the following relation for permeability using modeling results:
𝐾 =𝑑2
4 𝐴(𝑒𝐵(1−𝜀)− 1)−1 (12)
In Eq. (12), d is the fiber diameter, ε is the porosity of the medium and the respective constants A and B are equal to 5.55 and 10.1. For highly porous media (ε> 0.7), Davis [49] suggested the following correlation:
𝐾 = 𝑑2[64(1 − 𝜀)3 2⁄ (1 + 56(1 − 𝜀)3)]−1 (13) where d is the fiber radius and ε represents the porosity of the fiber structure.
The fluid flow inside porous media is affected by the structure of pores. While pore volume is readily computed by the porosity, the characteristics of pores are harder to be determined due to the complex structure of the porous medium. The true microscopic pathway that a fluid passes
between two points in the porous medium is specified by tortuosity. This parameter provides a better understanding of the fluid flow mechanism and the complexity of the pore network in the porous media. The ratio of the actual length of the path covered by the fluid to the shortest path between two points of the porous medium is characterized by tortuosity. A larger tortuosity represents the more complex structure of the porous medium and thus more resistance to the flow of fluid. Tortuosity can be computed by the following equation [50]:
𝜏 =∑ √𝑢∑|𝑢|2+ 𝑣2 (14)
To predict tortuosity in terms of porosity ε, Koponen et al.[51] the following relationship:
𝜏 = 1 + 𝑎 ( 1 − 𝜀
(𝜀 − 𝜀𝑐)𝑚) (15)
3.1.2. Catalyst layer and electrochemical reaction
The electrochemical reaction of oxygen reduction (Eq. 9) is very slow in normal conditions. Thus, the reaction should take place in the presence of a catalyst. Platinum is one of the most suitable catalysts for this reaction. However, platinum is very expensive and greatly increases the cost of generating electrical current from the fuel cell. For this purpose, attempts have been made to reduce platinum loading in the cathode cell by using novel methods to increase the active surface area of the catalyst layer. Therefore, the catalyst layer consists of platinum nanoparticles on a bed of carbon fibers and a membrane. The catalyst layer has been assumed to be a very thin layer as a boundary condition in many modelling studies[26, 41,53], the electrochemical reaction of oxygen reduction takes place on this layer assuming a reaction boundary for the catalyst layer (southern boundary in Fig. 3). For modeling the electrochemical reaction, the method proposed by Kamali et al. [53] is applied in this study. By modifying the bounce-back boundary condition and in consonance to with the chemical reaction rate on the catalyst surface, a percentage of oxygen molecules colliding this layer reacts and are converted to water molecules, while the rest remains unchanged and enter the solution domain.
In order to use a reaction rate constant in LBM, the actual reaction rate constant should be converted to its equivalent in LBM. The reaction rate constant in LBM is proportional to the actual reaction rate constant as follows [53]:
𝐾𝑠𝑟𝐿𝐵= (
6𝐾𝑠𝑟∆𝑡
∆𝑥 ) (1 + 𝐾𝑠𝑟∆𝑥
2𝐷 )
⁄ (16)
𝑲𝒔𝒓=
𝐽 4𝐹𝜌𝑂2
(17)
Where F is Faraday's constant and ρO2 is the density of oxygen on the surface of the cathode catalyst. The density of electric current on the surface of the catalyst layer can be calculated applying the Butler-Walmer relationship [4] as follows:
j = aroughnessjref( ρO
ρO.ref) [exp (
αfFη
RuT )
− exp (−αrFη RuT )]
(18)
In Eq. (16), j represents the electrical current density,
𝑎𝑟𝑜𝑢𝑔ℎ𝑛𝑒𝑠𝑠 indicates the roughness coefficient (the ratio of
the actual surface area of the catalyst layer to its apparent surface), 𝑗𝑟𝑒𝑓means the reference electric current density, 𝜌𝑂indicates the oxygen reference density and 𝛼
𝑓and
𝛼𝑟signify the transport coefficients in the forward and reverse reactions, respectively. According to equations (11) and (12), we have: reverse reactions, respectively. Pursuant to equations (11) and (12):
𝐾sr=a
roughness jref
4F (
1
𝜌𝑂,𝑟𝑒𝑓) [𝑒𝑥𝑝 (
𝛼𝑓𝐹𝜂
𝑅𝑢𝑇)
− 𝑒𝑥𝑝 (𝛼𝑟𝐹𝜂 𝑅𝑢𝑇)]
(19)
3.1.3. Boundary
The domain examined in this paper (Fig. 3) consists of six boundaries. The pressure in the inlet gas channel (Fig. 3) equals with 1.5 atm and a pressure difference of 0.001atm is considered between the inlet and outlet channels. Accordingly, the constant pressure boundary condition proposed by Zou and He[54] is applied at these two boundaries. As mentioned in section 3.1, to increase the speed of numerical solution, half of the gas channels are contemplated and symmetry boundary condition is applied to these boundaries. The applicability of the no-slip condition on solid surfaces is determined by the Knudsen dimensionless number. Given that the Knudsen number in the gas diffusion layer is of 10-2 order [52] , no-slip or bounce-back boundary conditions in LBM can be applied on solid particles in GDL as well as the solid part of the dipole plates at the boundary. The catalyst layer is on the southern boundary and the electrochemical reaction takes place on the surface of the catalyst layer. As a result of the very low thickness of this layer, the flow and diffusion of gases in this layer are not explored.
The catalyst layer is considered to be a reactive boundary condition. To model this boundary condition, the bounce-back boundary condition proposed by Kamali et al. is applied. By calculating 𝐾𝑠𝑟𝐿𝐵 using equations (16) to (19), the unknown distribution functions of oxygen and water vapors are obtained. Obviously, since nitrogen does not participate in the electrochemical reaction, the bounce-back boundary condition is applied as follows:
𝑓2𝑂2= (1 − 𝐾
𝑠𝐿𝐵)𝑓4𝑂2
𝑓5𝑂2= (1 − 𝐾
𝑠𝐿𝐵)𝑓7𝑂2
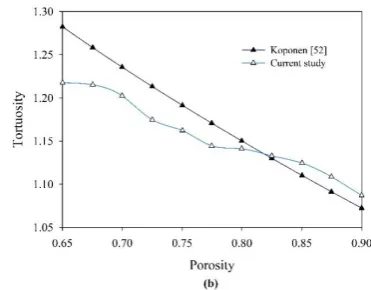
Figure 4. Comparison permeability(a) and tortuosity(b) of different models
𝑓6𝑂2= (1 − 𝐾𝑠𝐿𝐵)𝑓8𝑂2
𝑓2𝑊= 𝐾𝑠𝐿𝐵𝑓4𝑂2+ 𝑓4𝑊
𝑓5𝑊= 𝐾𝑠𝐿𝐵𝑓7𝑂2+ 𝑓7𝑊
𝑓6𝑊= 𝐾𝑠𝐿𝐵𝑓8𝑂2+ 𝑓8𝑊
(20)
4.
Results and discussion
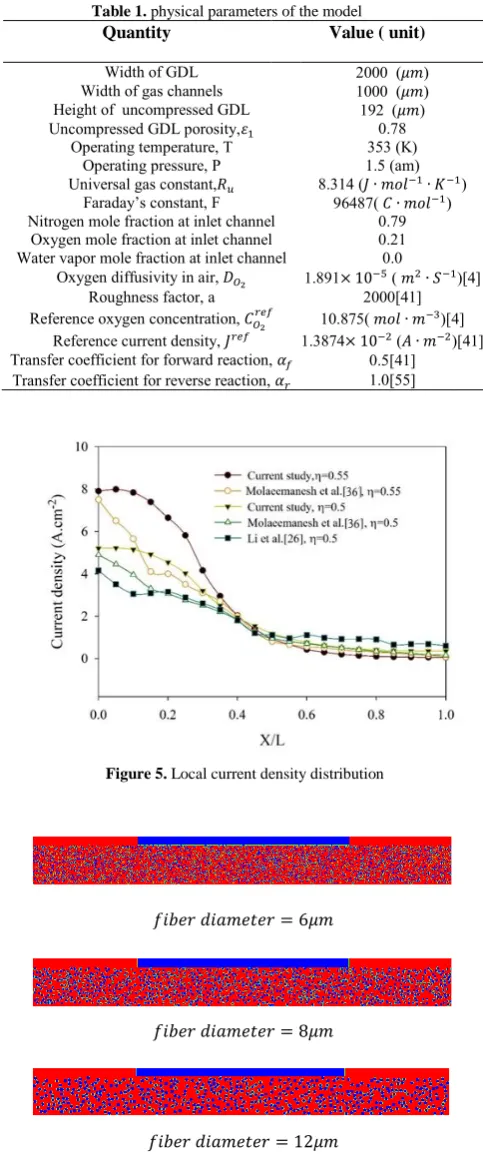
Dry air stream consisting of oxygen and nitrogen enter the cell cathode from the gas inlet channel and reaches the catalyst layer through GDL (Fig. 2). After reacting in the vicinity of the catalyst, while generating an electric current and water vapor, it flows towards the outlet channel. It is assumed that oxygen, nitrogen and water vapor behave like an ideal gas. The dimensional and functional parameters in Table 1 are applied to postulate the flow of reactive gases and electrochemical reaction and to explore the influence of the carbon fiber diameter in the gas diffusion layer on the flow of reactive gases and electrical current density. By choosing the D2Q9 arrangement, a 116 × 1001 network was used for meshing the solution domain. Oursuant to the physical dimensions of the model (Table 1), each network in the LB space equals 2 × 10⁻⁶ m in the physical space. The following assumptions are contemplated in the simulation process:
Water is produced in the electrochemical reaction as vapor and the gas mixture behaves like an ideal gas.
The thickness of the catalyst layer is very small and this layer is introduced into the solution domain by the boundary condition for the electrochemical reaction.
The cathode is assumed to be in temperature equilibrium and thus heat is not transferred in the cathode.
Fluid flow is laminar with constant properties.
Carbon fibers with a circular cross section do not overlap.
obtained. Regarding the choice of the active approach, the combined velocity (Eq. 8) was applied in the modeling instead of the velocity of each gas species in the reaction mixture.
For model validation, the permeability of the porous medium generated in this study was compared with those predicted by Kozeny-Carmen[47], Koponen[48] and Davis[49] correlation. The tortuosity of the porous medium was compared with that obtained from the correlation proposed by Koponen et al. [51]. To this end, a porous channel was created with random circular particles contemplating the pressure boundary condition at inlet and outlet channels to produce a pressure difference between the input and output channels. The northern and southern boundaries of the channel are solid. The bounce-back boundary condition was considered on all solid boundaries including southern and northern boundaries and solid particles in the channel. The results obtained from the comparison of tortuosity and permeability of the porous medium illustrates in Figure 4. As can be seen, the modeling results have a good accuracy.
To compare the modeling results of the electrochemical reaction in the cathode, the fluid flow and the electrochemical reaction inside the polymer fuel cell were modeled with conditions and dimensions applied by Molaeimanesh et al. The local current density on the surface of the catalyst layer is shown in Fig. 5.As it can be observed, the modifications observed in this study are very similar to those in the literature. The differences are as a result to the difference in the porous medium model.
Nevertheless, literature shows a reduction in the density of the electric current on the surface of the catalyst layer by moving towards the gas outlet channel. The rate of loss of local current density is considerably increased at X/L> 0.25 (end of the air inlet channel). Simulation of the flow of reactive gases in the cathode in different GDL structures is discussed below.
As mentioned above, the diameter of carbon fibers in the gas diffusion layer can modify the pore network inside GDL. Any change in the pore network can affect the cell performance by influencing the permeability of reactive gases within the GDL porous medium. Fig. 6 depcites four different GDL structures at a constant porosity and variable diameter of randomly generated solid particles, namely, carbon fibers with a circular cross section. As it can be obsereved, despite the constant porosity, ∅ = 0.75, the empty paths between circular particles increase with increasing cross-sectional diameter of carbon fibers. By changing the resistance in the path of reactive gases, the distribution of reactive gases within the GDL is expected to change.
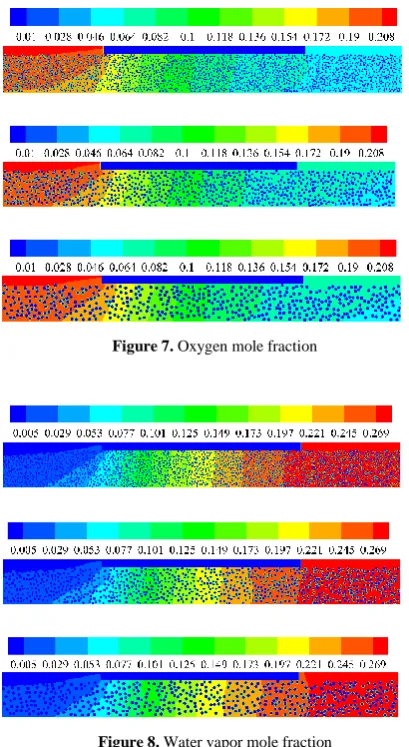
Figure 7 displays the effect of cross section of fibers forming the GDL on the mole fraction of oxygen.
Due to the consumption of oxygen during the electrochemical reaction on the catalyst layer, the oxygen mole fraction decreases from the inlet channel to the outlet channel in all structures. However, when GDL is made of larger diameter carbon fibers the concentration of oxygen
increases throughout this layer. This can be effective in preventing oxygen deficiency in the cell.
Table 1. physical parameters of the model
Quantity Value ( unit)
Width of GDL 2000 (𝜇𝑚)
Width of gas channels 1000 (𝜇𝑚) Height of uncompressed GDL 192 (𝜇𝑚) Uncompressed GDL porosity,𝜀1 0.78
Operating temperature, T 353 (K)
Operating pressure, P 1.5 (am)
Universal gas constant,𝑅𝑢 8.314 (𝐽 ∙ 𝑚𝑜𝑙−1∙ 𝐾−1)
Faraday’s constant, F 96487( 𝐶 ∙ 𝑚𝑜𝑙−1)
Nitrogen mole fraction at inlet channel 0.79 Oxygen mole fraction at inlet channel 0.21 Water vapor mole fraction at inlet channel 0.0
Oxygen diffusivity in air, 𝐷𝑂2 1.891× 10⁻⁵ ( 𝑚2∙ 𝑆−1)[4]
Roughness factor, a 2000[41]
Reference oxygen concentration, 𝐶𝑂𝑟𝑒𝑓2 10.875( 𝑚𝑜𝑙 ∙ 𝑚−3)[4]
Reference current density, 𝐽𝑟𝑒𝑓 1.3874× 10⁻² (𝐴 ∙ 𝑚−2)[41]
Transfer coefficient for forward reaction, 𝛼𝑓 0.5[41]
Transfer coefficient for reverse reaction, 𝛼𝑟 1.0[55]
Figure 5. Local current density distribution
𝑓𝑖𝑏𝑒𝑟 𝑑𝑖𝑎𝑚𝑒𝑡𝑒𝑟 = 6𝜇𝑚
𝑓𝑖𝑏𝑒𝑟 𝑑𝑖𝑎𝑚𝑒𝑡𝑒𝑟 = 8𝜇𝑚
𝑓𝑖𝑏𝑒𝑟 𝑑𝑖𝑎𝑚𝑒𝑡𝑒𝑟 = 12𝜇𝑚
𝑓𝑖𝑏𝑒𝑟 𝑑𝑖𝑎𝑚𝑒𝑡𝑒𝑟 = 16𝜇𝑚
Figure 7. Oxygen mole fraction
Figure 8. Water vapor mole fraction
The distribution of water vapor in the cell plays a key role in the fuel cell performance. If the generated water does not exit the GDL, it will have a negative impact on the cell performance by blocking the flow of gases. Figure 8 illustrayes the concentration field of water vapor. Since water is produced by the consumption of oxygen in the electrochemical reaction, the concentration of water vapor increases in all structures by moving from the inlet channel to the gas outlet channel. According to Fig. 8, despite an approximately same mole fraction distribution for water vapor at the entrance of reactants to the GDL, the concentration of water vapor at the bottom of the GDL opposite the gas outlet channel decreases with increasing cross-sectional diameter of carbon fibers. Although this is advantegous in reducing the probability of flooding in the cell, it should be checked whether this reduction in concentration is due to more effective removal of gases towards the output channel or the electrochemical reaction rate and consequently a decrease in the electric current density.
As previously mentioned, the reactants are transferred by diffusion and convection in the GDL. In both cases, the porosity of the GDL plays a key role in the effectiveness of these mechanisms. To compute, the effect of carbon fiber diameter in the gas diffusion layer, the distribution of
Figure 9. Oxygen mole fraction
oxygen and water vapor mole fractions was calculated at ∅ = 0.65 and the results are depcited in Fig. 9. As the diameter of carbon fibers increases at this constant porosity, the flow of oxygen in the gas diffusion layer is facilitated and distribution of oxygen becomes more uniform in a section of GDL located in front of the gas outlet channel. Comparing the oxygen concentration field at ∅ = 0.65 (Fig. 9a) with distribution of oxygen mole fraction at ∅ = 0.75 (Fig. 7.), the decrease in uniform penetration of oxygen into the GDL is significant. This reduction is as a result of the reduced permeability of the porous media of the gas diffusion layer with increasing the solid resistance at lower porosities. The same trend is observed for water vapor in Fig. 9b.
For further investigation of changes in the mole fractions of oxygen and water vapor on the surface of the catalyst layer, the mole fractions are computed at three different porosities (∅ = 0.65; 0.75; 85) and the results are decpited in Fig. 10. By decreasing the cross-sectional diameter of carbon fibers at all three porosities, the molar fraction of water vapor on the catalyst layer increases throughout the GDL, but the mole fraction of oxygen decreases. The mole fractions change less at lower porosities. In addition, there is no significant difference between mole fractions of reactive species in two GDL structures with cross-sectional diameters of 12 and 16 µm even at ∅ = 0.65.
Therefore, it is predicted that an increase in the cross-sectional diameter of carbon fibers by more than 12 µm will have a little impact on the flow or even the permeability of gases in the GDL.
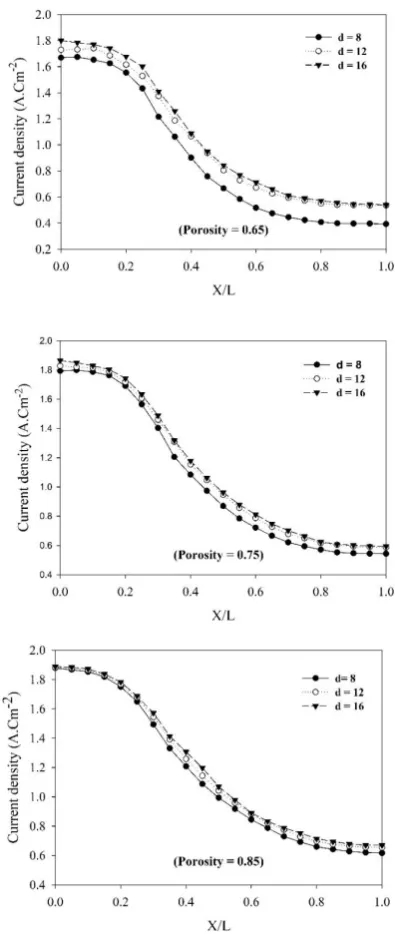
surface of the catalyst layer is the only factor affecting the electric current density generated on this layer. As clearly can observe in Fig. 11, an increase in the cross-sectional diameter of the carbon fibers at all three porosities has a positive effect on the magnitude of the electric current density. The effect of increasing the diameter of fibers on the density of the electric current produced on the surface of the catalyst layer is greater at lower porosities. The difference of the average electrical current density between the smallest and largest cross-sectional diameter, namely, d = 8μm, and d = 16μm, at ∅ = 0.65, ∅ = 0.75 and ∅ = 0.85 are respectively 15.3%, 6.3% and 4.4%. In addition, there is no significant difference in the generated electric current with increasing the diameter of the GDL fiber cross section at ∅>0.75.
Figure 10. Oxygen and water vapor mole fraction in different Fiber diameter and porosity
Figure 11. Local electrical current density on catalyst layer Surface
5.
conclusion
investigated. Pursuant to the results, an increase in the diameter of the carbon fibers by changing the porous media pore network at a constant porosity cause the uniform distribution of oxygen throughout the GDL. It had a positive effect on the removal of vapor produced in the gas diffusion layer as well.Furthermore, an increase in the cross section of the fibers forming the GDL caused an increase in the density of the electric current generated on the surface of the catalyst layer. This increase, in addition to the cross-sectional diameter, also depends on the porosity of the GDL so, that the average current density at ∅ =0.65, 0.75 and 0.85 were respectively 15.3%, 6.3% and 4.4% as the cross sectional diameter boosted from 8 to 16 µm. Moreover, no significant difference was observed in the electric current with increasing the diameter of carbon fibers at ∅ > 0.75.
References
[1] F. Barbir, PEM fuel cells : theory and practice,
Elsevier, 1-80, (2013).
[2] Y. Wang, K. S. Chen, J. Mishler, S. C. Cho, and X.
C. Adroher, “A review of polymer electrolyte
membrane fuel cells: Technology, applications, and needs on fundamental
research,” Applied Energy, vol. 88, no. 4. pp.
981–1007, (2011).
[3] H. Wu, “Mathematical Modeling of Transient
Transport Phenomena in PEM Fuel Cells,”
(2009).
[4] M. M. Mench, Fuel Cell Engines, Wiley, 10-22, (2008).
[5] W. Yuan, Y. Tang, X. Yang, and Z. Wan, “Porous
metal materials for polymer electrolyte membrane fuel cells - A review,” Appl. Energy,
vol. 94, pp. 309–329, (2012).
[6] J. Giner and C. Hunter, “The Mechanism of
Operation of the Teflon-Bonded Gas Diffusion
Electrode: A Mathematical Model,” J.
Electrochem. Soc., vol. 116, no. 8, p. 1124, (1969).
[7] H. S. Chu, C. Yeh, and F. Chen, “Effects of
porosity change of gas diffuser on performance of proton exchange membrane
fuel cell,” J. Power Sources, vol. 123, no. 1, pp.
1–9, (2003).
[8] S. Dutta, S. Shimpalee, and J. W. Van Zee,
“Numerical prediction of mass-exchange
between cathode and anode channels in a
PEM fuel cell,” Int. J. Heat Mass Transf., vol. 44,
no. 11, pp. 2029–2042, (2001).
[9] G.-P. Ren, L.-J. Yu, X.-M. Jiang, and J.-Q. Yuan,
“Numerical analysis of the influencing factors
on performance of proton exchange
membrane fuel cell,” Shanghai Jiaotong Daxue
Xuebao/Journal Shanghai Jiaotong Univ., vol. 40, no. 8, (2006).
[10]Y. Zhang, A. Mawardi, and R. Pitchumani,
“Analysis and design of proton exchange
membrane fuel cells for maximum power density and uniform current density
distribution,” in Proceedings of the 1st
European Fuel Cell Technology and Applications Conference 2005 - Book of Abstracts, 2005, vol. (2005).
[11]K. D. Baik, S. Il Kim, B. K. Hong, K. Han, and M.
S. Kim, “Effects of gas diffusion layer structure
on the open circuit voltage and hydrogen crossover of polymer electrolyte membrane
fuel cells,” Int. J. Hydrogen Energy, vol. 36, no.
16, pp. 9916–9925, (2011).
[12]J. P. James, H.-W. Choi, and J. G. Pharoah, “X -ray computed tomography reconstruction and analysis of polymer electrolyte
membrane fuel cell porous transport layers,”
Int. J. Hydrogen Energy, vol. 37, no. 23, pp. 18216–18230, (2012).
[13]G. Falcucci, S. Ubertini, E. Galloni, and E.
Jannelli, “Modeling fuel cells through Lattice
Boltzmann methods,” in EFC 2009 - Piero
Lunghi Conference, Proceedings of the 3rd European Fuel Cell Technology and Applications Conference, (2009).
[14]J. Park and X. Li, “Multi-phase micro-scale
flow simulation in the electrodes of a PEM fuel
cell by lattice Boltzmann method,” J. Power
Sources, vol. 178, no. 1, pp. 248–257, (2008). [15]J. Yablecki, J. Hinebaugh, and A. Bazylak,
“Effect of Liquid Water Presence on PEMFC
GDL Effective Thermal Conductivity,” J.
Electrochem. Soc., vol. 159, no. 12, pp. F805–
F809, (2012).
[16]B. S. Yasser, Y. Tabe, and T. Chikahisa, “Liquid
water and gas flow simulation in a channel of PEM fuel cels using the Lattice Boltzmann
method,” in ASME 2010 8th International
Conference on Fuel Cell Science, Engineering and Technology, FUELCELL 2010, vol. 1, (2010).
[17]V. P. Zhdanov, “Simulations of processes
related to H2-O2 PEM fuel cells,” J.
Electroanal. Chem., vol. 607, pp. 17–24, (2007).
[18]Y. Gao, “Using MRT lattice Boltzmann method
to simulate gas flow in simplified catalyst layer for different inlet-outlet pressure ratio,”
Int. J. Heat Mass Transf., vol. 88, pp. 122–132, (2015).
[19]C. Hartnig, L. Jörissen, J. Scholta, and W.
Lehnert, “4 - Gas diffusion media, flowfields
and system aspects in low temperature fuel cells BT - Polymer Electrolyte Membrane and
Direct Methanol Fuel Cell Technology,” in
[20]C. Spiegel, “Modeling the Gas Diffusion
Layers,” PEM Fuel Cell Model. Simul. Using
Matlab, pp. 197–241, (2008).
[21]R. Wu, X. Zhu, Q. Liao, H. Wang, and Y. D. Ding,
“Pore network modeling of oxygen diffusion
in gas diffusion layer of proton exchange
membrane fuel cells,” in Proceedings of the
ASME Micro/Nanoscale Heat and Mass Transfer International Conference 2009, MNHMT2009, vol. 2, pp. 307–312, (2010).
[22]Z. Shi and X. Wang, “Pore structure modeling
of flow in gas diffusion layers of proton
exchange membrane fuel cells,” ASME 2010
8th Int. Conf. Fuel Cell Sci. Eng. Technol. FUELCELL 2010, vol. 1, pp. 525–531, 2010.
[23]L. Chen, H. B. Luan, and W. Q. Tao, “Liquid
water dynamic behaviors in the GDL and GC of
PEMFCS using Lattice Boltzmann method,”
Front. Heat Mass Transf., vol. 1, no. 2, (2010). [24]L. Hao and P. Cheng, “Lattice Boltzmann
simulations of water transport in gas diffusion layer of a polymer electrolyte membrane fuel
cell,” J. Power Sources, vol. 195, no. 12, pp.
3870–3881,( 2010).
[25]L. Chen, H. B. Luan, Y. L. He, and W. Q. Tao,
“Pore-scale flow and mass transport in gas
diffusion layer of proton exchange membrane
fuel cell with interdigitated flow fields,” Int. J.
Therm. Sci., vol. 51, no. 1, pp. 132–144, (2012). [26]J. P. Feser, A. K. Prasad, and S. G. Advani,
“Experimental characterization of in-plane
permeability of gas diffusion layers,” J. Power
Sources, vol. 162, no. 2 SPEC. ISS., pp. 1226–
1231, (2006).
[27]A. Tamayol, F. McGregor, and M. Bahrami,
“Single phase through-plane permeability of
carbon paper gas diffusion layers,” J. Power
Sources, vol. 204, pp. 94–99, (2012).
[28]P. Chippar, O. Kyeongmin, K. Kang, and H. Ju,
“A numerical investigation of the effects of
GDL compression and intrusion in polymer
electrolyte fuel cells (PEFCs),” in International
Journal of Hydrogen Energy, vol. 37, no. 7, pp. 6326–6338, (2012).
[29]T. Hottinen, O. Himanen, S. Karvonen, and I.
Nitta, “Inhomogeneous compression of
PEMFC gas diffusion layer. Part II. Modeling
the effect,” J. Power Sources, vol. 171, no. 1, pp.
113–121, (2007).
[30]A. H. Mahmoudi, A. Ramiar, and Q. Esmaili,
“Effect of inhomogeneous compression of gas
diffusion layer on the performance of PEMFC
with interdigitated flow field,” Energy
Convers. Manag. , vol. 110, pp. 78–89, (2016). [31]Z. Fishman, J. Hinebaugh, and A. Bazylak,
“Microscale Tomography Investigations of
Heterogeneous Porosity Distributions of
PEMFC GDLs,” J. Electrochem. Soc., vol. 157,
no. 11, p. B1643,( 2010).
[32]L. Chen, H. Luan, Y. Feng, C. Song, Y. L. He, and
W. Q. Tao, “Coupling between finite volume
method and lattice Boltzmann method and its application to fluid flow and mass transport in
proton exchange membrane fuel cell,” Int. J.
Heat Mass Transf., vol. 55, no. 13–14, pp. 3834–3848, (2012).
[33]G. R. Molaeimanesh and M. H. Akbari, “A
pore-scale model for the cathode electrode of a proton exchange membrane fuel cell by
lattice Boltzmann method,” Korean J. Chem.
Eng., vol. 32, no. 3, pp. 397–405, (2015).
[34]Z. Fishman and A. Bazylak, “Heterogeneous
Through-Plane Distributions of Tortuosity, Effective Diffusivity, and Permeability for
PEMFC GDLs,” J. Electrochem. Soc., vol. 158,
no. 2, p. B247, (2011).
[35]A. Nabovati, J. Hinebaugh, A. Bazylak, and C.
H. Amon, “Effect of porosity heterogeneity on
the permeability and tortuosity of gas diffusion layers in polymer electrolyte
membrane fuel cells,” J. Power Sources, vol.
248, pp. 83–90, (2014).
[36]J. Hinebaugh and A. Bazylak, “Stochastic
modeling of polymer electrolyte membrane fuel cell gas diffusion layers – Part 1: Physical
characterization,” Int. J. Hydrogen Energy, vol.
42, no. 24, pp. 15861–15871, (2017).
[37]A. A. Mohamad, Lattice Boltzmann Method. (2011).
[38]P. L. Bhatnagar, E. P. Gross, and M. Krook, “A
model for collision processes in gases. I. Small amplitude processes in charged and neutral
one-component systems,” Phys. Rev., vol. 94,
no. 3, pp. 511–525, (1954).
[39]S. Succi, “The lattice Boltzmann equation for
Fluid Dynamics and Beyond,” Oxford
University press. p. 299, (2001).
[40]M. C. Sukop and D. T. Thorne, Lattice boltzmann modeling: An introduction for geoscientists and engineers. (2006).
[41]X. Shan and H. Chen, “Lattice Boltzmann
model for simulating flows with multi phases
and components,” Phys. Rev. E, vol. 47, no. 3,
pp. 1815–1819, (1993).
[42]T. V. Nguyen, “A Gas Distributor Design for
Proton-Exchange-Membrane Fuel Cells,” J.
Electrochem. Soc., vol. 143, no. 5, p. L103, (1996).
[43]Y. Wang, C. Y. Wang, and K. S. Chen,
“Elucidating differences between carbon
paper and carbon cloth in polymer electrolyte
fuel cells,” Electrochim. Acta, vol. 52, no. 12,
pp. 3965–3975, (2007).
[44]K. Schladitz, S. Peters, D. Reinel-Bitzer, A.
trim based on geometric modeling and flow simulation for non-woven,” Comput. Mater.
Sci., vol. 38, no. 1, pp. 56–66, (2006).
[45]V. P. Schulz, J. Becker, A. Wiegmann, P. P. Mukherjee, and C.-Y. Wang, “Modeling of Two -Phase Behavior in the Gas Diffusion Medium
of PEFCs via Full Morphology Approach,” J.
Electrochem. Soc., vol. 154, no. 4, p. B419,( 2007).
[46]D. A. Nield and A. Bejan, Convection in porous media. (2013).
[47]M. Kaviany, “Principles of Heat Transfer in
Porous Media,” Mech. Eng. Ser., vol. 53, no. 9,
p. 726, (1995).
[48]A. Koponen et al., “Permeability of three
-dimensional random fiber webs,” Phys. Rev.
Lett., vol. 80, no. 4, pp. 716–719, (1998).
[49]C. N. Davies, “The Separation of Airborne
Dust and Particles,” Proc. Inst. Mech. Eng. B,
pp. 185–213, (1952).
[50]O. Filippova and D. Hänel, “Grid Refinement
for Lattice-BGK Models,” J. Comput. Phys., vol.
147, no. 1, pp. 219–228, (1998).
[51]A. Koponen, M. Kataja, and J. Timonen,
“Permeability and effective porosity of porous
media,” Phys. Rev. E - Stat. Physics, Plasmas,
Fluids, Relat. Interdiscip. Top., vol. 56, no. 3, pp. 3319–3325, (1997).
[52]H. R. Ashorynejad, K. Javaherdeh, and H. E. A.
Van den Akker, “The effect of pulsating
pressure on the performance of a PEM fuel cell
with a wavy cathode surface,” Int. J. Hydrogen
Energy, vol. 41, no. 32, pp. 14239–14251, (2016).
[53]M. R. Kamali, S. Sundaresan, H. E. A. Van den Akker, and J. J. J. Gillissen, “A multi-component two-phase lattice Boltzmann method applied to a 1-D Fischer-Tropsch reactor,” Chem. Eng.
J., vol. 207–208, pp. 587–595,(2012).
[54]Q. Zou and X. He, “On pressure and velocity
boundary conditions for the lattice Boltzmann
BGK model,” Phys. Fluids, vol. 9, no. 6, pp.
1591–1598, (1997).
[55]G. R. Molaeimanesh and M. H. Akbari,
“Agglomerate modeling of cathode catalyst
layer of a PEM fuel cell by the lattice
Boltzmann method,” Int. J. Hydrogen Energy,