ISSN 0975-928X
Research Note
Genetic variability, correlation and path coefficient for grain yield and
quantitative traits of elite rice (
Oryza sativa
L.) genotypes at Uttar Pradesh
Mahendra Bhati, G. Suresh Babu and Aishwarya Singh Rajput
Experimentation Centre of Department of Genetics and Plant Breeding, Allahabad School of Agriculture,
Sam Higginbottom Institute of Agriculture, Technology and Sciences, (Deemed-to-be-University), Allahabad-211007, U.P. Email- [email protected]
(Received: 25 July 2014; Accepted:28 Mar 2015)
Abstract
Studies on genetic variability, correlation and path coefficient analysis were conducted on 30 elite rice (Oryza sativa L.) genotypes. Analysis of variance among 30 genotypes showed significant difference for all characters studied. Highest genotypic coefficient of variance (GCV) phenotypic coefficient variance (PCV) was observed for grain yield per hill followed by harvest index indicating that these characters could be used as selection for crop improvement. High estimates of heritability coupled with high genetic advance were observed for plant height and spikelets per panicle. Correlation studies revealed that grain yield per hill was positively significant correlated with harvest index, biological yield per hill, test weight and plant height at both genotypic and phenotypic level. Path coefficients revealed the harvest index, biological yield per hill, number of spikelets per panicle, number of tillers per hill and plant height had high positive direct effect on grain yield at both genotypic and phenotypic level.
Keywords
Rice (Oryza sativa L.), genetic variability, correlation and path coefficients. Rice is the most important food grain crop of the
world and forms the staple diet of 2.7 billion peoples. Rice provides 75% of the calories and 55% of the protein in the average daily diet of the peoples. . Rice contributes the 43% of total food grain production and 46% of total cereal production. (FAO [Food and Agriculture Organization] (2012). India stands first in area and second in production. India is a major rice growing country of the world with an area 43.97 m ha, production 104.32 million tones and productivity of 2.4 t/ha (Agricultural Statistics at a glance, 2012). Genetic variability for quantitative traits is the key component of breeding programme for broadening the gene pool of rice and other crops. High magnitude of variability in a population provides the opportunity for selection to evolve a variety having desirable characters. The genetic coefficient of variation together with heritability estimate would give the best picture of the amount of advance to be expected from the selection. The amount of genetic advance under selection mainly depends on the amount of genetic variability (Jayasudha and Sharma, 2010).
Information on association of characters, direct and indirect effects contributed by each character towards yield will be in added advantage in aiding the selection process. Correlation and path analysis establish the extent of association between yield and its components and also bring out relative importance of their direct and indirect effects, thus
giving an obvious understanding of their association with grain yield (Babu et al, 2011). The
present study was undertaken to investigate the genetic variability, heritability and association between grain yield and yield related traits as a basic for selection of high yielding rice genotypes. The experimental material consisted of 30 elite rice genotypes and present investigation was carried out at the field experimentation centre, Department of Genetics and Plant Breeding, Allahabad school of Agriculture, Sam Higginbottom Institute of Agriculture Technology and Sciences, (deemed-to-be-university), Allahabad (U.P.) during kharif
ISSN 0975-928X
per formula suggested by Johnson et al. (1955). The partitioning of genotypic and phenotypic correlation coefficient in to direct and in direct effects was carried out using the procedure suggested by (dewey and lu, 1959).
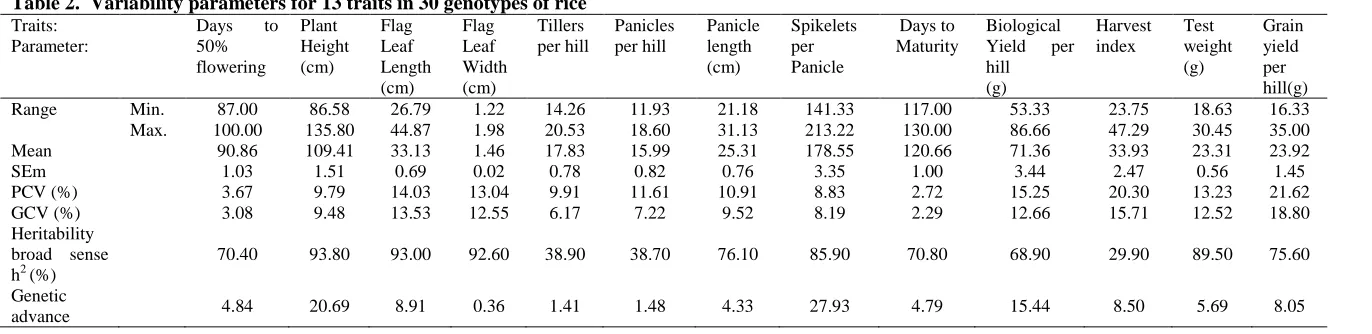
The success of any breeding programme depends upon the genetic variability present in the base population and relationship of various characters towards yield. Analysis of variation shown highly significant differences among the genotypes for all the traits studied indicating the presence of considerable genetic variation among the study materials (Table 1). High genetic variability for different quantitative traits in rice was also reported earlier by Khan et al. (2009), Akinwale et al. (2010) and Babu et al. (2011). Coefficient of variation truly measure of variance among the different traits (Table 2). The estimates of phenotypic coefficient of variation (PCV) were slightly higher than those of genotypic coefficient of variation (GCV) for all the traits studied. In this study slight differences indicated minimum environmental influence and consequently greater role of factors 0n the expression of the traits. Genotypic coefficient of variation and phenotypic coefficient of variation was highest for grain yield per plant followed by harvest index, flag leaf length and test weight. Similar results were obtained by (Jayasudha and Sharma, 2010).
Heritability plays an important role in deciding the suitability and strategy for selection of a character. In the present study high heritability was observed for traits viz. plant height followed by flag leaf length, flag leaf width, test weight, number of spikelets per panicle, panicle length, grain yield per hill, days to maturity, days to 50% flowering. It suggests high component of heritable portion of variation that can be exploited by breeders in the selection of superior genotypes on the basis of phenotypic performance. While the moderate heritability observed for harvest index and low heritability was observed for number of tillers per hill and number of panicles per hill which indicates the possibility of using for rice improvement program, but their expression can be very much influenced by the environment. Similar results were also reported by Tripathi et al. (1999) recorded high heritability for plant height.
The characters exhibiting high heritability may not necessarily give high genetic advance. Johnson (1955) reported that high heritability should be accompanied by high genetic advance to arrive at more reliable conclusion. The breeder should be cautious in making selection based on heritability as it includes both additive genes actions. In the present study high heritability along with high genetic advance was exhibited by plant height and
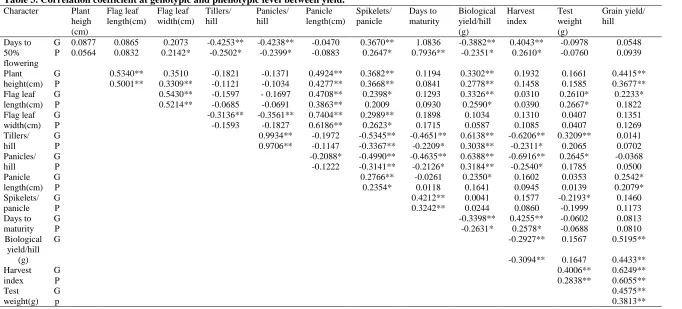
no. of spikelets per panicle. These characters shows ample scope of selection. Similar result reported earlier in rice by Seyoum et al. (2011). Genotypic and phenotypic correlation coefficients (Table 4) indicated that the genotypic and phenotypic correlation coefficient showed similar trend but genotypic correlation coefficients were of higher in magnitude than the corresponding phenotypic correlation coefficients which might be due to the masking or modified effect of environment on character association at the genetic level. This finding agreed with those of kole et al. (2008).
Grain yield was found to be positively and significantly associated with test weight, harvest index, biological yield per hill, plant height and panicle length both at genotypic and phenotypic levels, indicating the relative utility of these traits for selection with respect to grain yield. The positive correlation of grain yield with various traits was supported by Sharma and Dubey (1997) for panicle length, Sharwagi et al. (1997) for harvest index, Basavraja et al. (1997) for plant height and Chakarborty et al. (2001) for test weight. The correlation show positive non significant association with flag leaf width, number of spikelets per panicle, days to 50% flowering, days to maturity and tillers per hill both at genotypic and phenotypic level. Similar reported by Seyoum et al. (2012) for tillers per hill. In the present study path coefficient analysis has been conducted taking grain yield per hill as depended variable and other characters as independent is presented in (Table 4). Path coefficient analysis revealed that tillers per hill had highest positive direct effect on grain yield followed by harvest index, biological yield per hill, plant height and spikelets per panicle. Positive direct effect of these traits indicated that direct selection for these traits would likely be effective in increasing grain yield. Similar results were also reported by Gawai et al.
(2006) for tillers per plant and harvest index and plant height and Ekka et al. (2011) for leaf length. On the other hand the highest positive direct effect has been reported for number of tillers per hill by Agahi et al. (2007). The direct effects of panicles per hill were negative followed by test weight, panicle length, flag leaf width and days to 50% flowering at genotypic level. In the present study path coefficient revealed that number of tillers per hill, harvest index and biological yield per hill had high influence on grain yield per hill. Selection of plants on these traits would certainly lead to
improvement in grain yield.
References
ISSN 0975-928X
Akinwale, A.G., G. Gregorio, F. Nwilene, B.O. Akinyele, S.A. Ogunbayo and A.C. Odiyi. 2011. Haritability and Correlation coefficient analysis for yield and its component in rice (Oryza sativa L.). African. J. Plant Sci.,5: 29-33.
Babu, S. G., Lavanya, G. R. and Singh, A. P. 2011. Genetic variability for grain yield and character association studies in upland rice (Oryza sativa L.). Envir. Ecol.,29 (1): 164-168.
Basavaraja, P., Rudraradhya, M. and Kulkarni, R. S. 1997. Genetic variability, correlation and path analysis of yield components in two F4 population of five rainfed . Mysore J. Agric. Sci.,31: 1-6.
Burton, G.W. (1952). Quantitative inheritance in grasses
Proc. 6th Grassland Congr.,1:356-363 Burton GW, Devane EH (1953). Estimating heritability
in tall fescue (Festuca arundinacea) from replicated clonal material. Agron J., 45: 478-481
Chakraborty, S., Das, P. K.., Guha, B., Barman, B. and Sarmah, K. K. 2001. Coheritability correlation and path analysis of yield components in boro rice. Oryza., 38: 99-101.
Dewey, D. R. and Lu, K. H. 1959. Correlation and path coefficients analysis of components of crested wheat grass seed production. Agron. J., 51: 575-581.
FAO [Food and Agriculture Organization] .2012. Agricultural outlook 2009-2025.
Gawai, M.P. Veer, K.T. Patil, D.K. and Dheware, R.M. 2006. Genetic variability and path coefficient in some promising lines of rice. New Botanist.,
33: 209-214
Johanson, H. W., Robinson, H. F. and Comstock, R. E. 1955. Estimates of genetic and environmental variability in soybean. Agron. J.,47 (7): 314- 315.
Jayasudha, S., Sharma, D., (2010). Genetic parameters of variability, correlation and path- coefficient for grain yield and physiological traits in rice (Oryza sativa L.) under shallow lowland situation. Electron. J. Plant Breed.,1(5), 33-38. Khan, A.S., M. Imran and M. Asfaq. 2009. Estimation of genetic variability and correlation for grain yield components in rice (Oryza sativaL.). Am. Eurasian J. Agric. Environ. Sci.,6: 585-590. Kole PC, and Hasib KM. 2008. Correlation and
regression analysis in scented rice. Madras Agri. J., 95(1-6): 178- 182.
Panse VG, and Sukhatme PV. 1961. Statistical methods for agricultural workers. 2nd Edn ICAR, New Delhi pp.361.
Ruth Elizabeth Ekka, A.K. Sarawagi and Raja R Kanwar. 2011. Correlation and path analysis in traditional rice accession of Chhattisgarh. J. Rice. Res., 4: 10-18
Sarawgi, A.K., N.K. Rastogi and D.K. Soni. 1997. Correlation and path analysis in rice accessions from Madhya Pradesh. Field Crop Res., 52: 161-167.
Seyoum Mulugeta, Sentayehu Alamerew and Kassahun Bantte. 2012. Genetic variability, heritability, correlation coefficient and path analysis for yield and yield related traits in upland rice (Oryza sativa L.). J. Plant Sci., 10: 1-10.
Sharma, R. K. and Dubey, S. D. 1997. Variation and association among panicle traits in rice. Oryza,
34: 8-12.
Tripathi, A.K., Singh, J.K. and Bhandarkar. (1999). Studies on variability, stability and correlation studies on lowland rice (Oryza sativa L.).
ISSN 0975-928X
Table 1. Analysis of variance for different quantitative characters in 30 genotypes of rice
Significant at 1% level * and Significant at 5%** level of significance respectively Table 2. Variability parameters for 13 traits in 30 genotypes of rice Traits:
Parameter:
Days to 50% flowering
Plant Height (cm)
Flag Leaf Length (cm)
Flag Leaf Width (cm)
Tillers per hill
Panicles per hill
Panicle length (cm)
Spikelets per Panicle
Days to Maturity
Biological Yield per hill (g)
Harvest index
Test weight (g)
Grain yield per hill(g)
Range Min. 87.00 86.58 26.79 1.22 14.26 11.93 21.18 141.33 117.00 53.33 23.75 18.63 16.33
Max. 100.00 135.80 44.87 1.98 20.53 18.60 31.13 213.22 130.00 86.66 47.29 30.45 35.00
Mean 90.86 109.41 33.13 1.46 17.83 15.99 25.31 178.55 120.66 71.36 33.93 23.31 23.92
SEm 1.03 1.51 0.69 0.02 0.78 0.82 0.76 3.35 1.00 3.44 2.47 0.56 1.45
PCV (%) 3.67 9.79 14.03 13.04 9.91 11.61 10.91 8.83 2.72 15.25 20.30 13.23 21.62
GCV (%) 3.08 9.48 13.53 12.55 6.17 7.22 9.52 8.19 2.29 12.66 15.71 12.52 18.80
Heritability broad sense h2 (%)
70.40 93.80 93.00 92.60 38.90 38.70 76.10 85.90 70.80 68.90 29.90 89.50 75.60
Genetic
advance 4.84 20.69 8.91 0.36 1.41 1.48 4.33 27.93 4.79 15.44 8.50 5.69 8.05
Source of variation
D F
Days to 50% Floweri ng
Plant height (cm)
Flag leaf width (cm)
Flag leaf Lengt h (cm)
Tillers per hill
Panicle s per hill
Panicle length (cm)
Spikelets per panicles
Days to maturit y
Biologic al yield per hill(g)
Harvest
index Test Weight (g)
Grain yield per hill(g)
Replication 2 0.43 2.20 1.65 0.001 6.18* 7.12* 0.08 4.31 1.23 6.63 20.01 0.018 2.17
Treatment 29 26.84** 329.93** 61.86** 0.10** 5.55** 6.11** 19.25** 676.89** 26.13** 281.77** 104.35** 26.58** 67.21**
ISSN 0975-928X
Table 3. Correlation coefficient at genotypic and phenotypic level between yield. Character Plant
heigh (cm)
Flag leaf length(cm)
Flag leaf width(cm)
Tillers/ hill
Panicles/ hill
Panicle length(cm)
Spikelets/ panicle
Days to maturity
Biological yield/hill (g)
Harvest index
Test weight (g)
Grain yield/ hill Days to
50% flowering
G 0.0877 0.0865 0.2073 -0.4253** -0.4238** -0.0470 0.3670** 1.0836 -0.3882** 0.4043** -0.0978 0.0548 P 0.0564 0.0832 0.2142* -0.2502* -0.2399* -0.0883 0.2647* 0.7936** -0.2351* 0.2610* -0.0760 0.0939 Plant
height(cm)
G 0.5340** 0.3510 -0.1821 -0.1371 0.4924** 0.3682** 0.1194 0.3302** 0.1932 0.1661 0.4415** P 0.5001** 0.3309** -0.1121 -0.1034 0.4277** 0.3668** 0.0841 0.2778** 0.1458 0.1585 0.3677** Flag leaf
length(cm)
G 0.5430** -0.1597 - 0.1697 0.4708** 0.2398* 0.1293 0.3326** 0.0310 0.2610* 0.2233*
P 0.5214** -0.0685 -0.0691 0.3863** 0.2009 0.0930 0.2590* 0.0390 0.2667* 0.1822
Flag leaf width(cm)
G -0.3136** -0.3561** 0.7404** 0.2989** 0.1898 0.1034 0.1310 0.0407 0.1351
P -0.1593 -0.1827 0.6186** 0.2623* 0.1715 0.0587 0.1085 0.0407 0.1269
Tillers/ hill
G 0.9934** -0.1972 -0.5345** -0.4651** 0.6138** -0.6206** 0.3209** 0.0141
P 0.9706** -0.1147 -0.3367** -0.2209* 0.3038** -0.2311* 0.2065 0.0702
Panicles/ hill
G -0.2088* -0.4990** -0.4635** 0.6388** -0.6916** 0.2645* -0.0368
P -0.1222 -0.3141** -0.2126* 0.3184** -0.2540* 0.1785 0.0500
Panicle length(cm)
G 0.2766** -0.0261 0.2350* 0.1602 0.0353 0.2542*
P 0.2354* 0.0118 0.1641 0.0945 0.0139 0.2079*
Spikelets/ panicle
G 0.4212** 0.0041 0.1577 -0.2193* 0.1460
P 0.3242** 0.0244 0.0860 -0.1999 0.1173
Days to maturity
G -0.3398** 0.4255** -0.0602 0.0813
P -0.2631* 0.2578* -0.0688 0.0810
Biological yield/hill
(g)
G -0.2927** 0.1567 0.5195**
-0.3094** 0.1647 0.4433** Harvest
index
G 0.4006** 0.6249**
P 0.2838** 0.6055**
Test weight(g)
G 0.4575**
ISSN 0975-928X
Table 4. Direct and indirect effect between yield and its relates traits in 30 rice genotypes at genotypic level Character Days to
50% flowering
Plant height (cm)
Flag leaf length
(cm)
Flag leaf width
(cm)
Tillers/ hill
Panicles/ hill
Panicle length
(cm)
Spikelets/ panicle
Days to maturity
Biological yield /hill
(g)
Harvest index
Test weight (g)
Grain yield per
hill (g) Days to 50%
flowering
-0.074 -0.007 -0.006 -0.015 0.031 0.031 0.004 -0.027 -0.080 0.029 -0.030 0.007 0.055
Plant height (cm)
0.038 0.429 0.229 0.151 -0.078 -0.059 0.211 0.158 0.051 0.142 0.083 0.071 0.442
Flag leaf length (cm)
0.006 0.038 0.072 0.039 -0.011 -0.012 0.034 0.017 0.009 0.024 0.002 0.019 0.223
Flag leaf width (cm)
-0.028 -0.048 -0.074 -0.137 0.043 0.049 -0.101 -0.041 -0.026 -0.014 -0.018 -0.006 0.135
Tillers/ hill -1.776 -0.760 -0.667 -1.310 4.176 4.149 -0.824 -2.232 -1.943 2.563 -2.592 1.340 0.014
Panicles/ hill 1.511 0.489 0.605 1.270 -3.542 -3.565 0.744 1.779 1.652 -2.277 2.466 -0.943 -0.037
Panicle length (cm)
0.007 -0.069 -0.066 -0.104 0.028 0.029 -0.140 -0.039 0.004 -0.033 -0.022 -0.005 0.254
Spikelets/ panicle
0.102 0.102 0.067 0.083 -0.148 -0.138 0.077 0.277 0.117 0.001 0.044 -0.061 0.146
Days to maturity
-0.004 0.000 -0.001 -0.001 0.002 0.002 0.000 -0.002 -0.004 0.001 -0.002 0.000 0.081
Biological yield/hill(g)
-0.173 0.147 0.148 0.046 0.273 0.284 0.105 0.002 -0.151 0.445 -0.130 0.070 0.520
Harvest index 0.404 0.193 0.031 0.131 -0.620 -0.690 0.160 0.158 0.425 -0.292 0.998 0.400 0.625
Test weight (g)