Vol.9 (2019) No. 5
ISSN: 2088-5334
Evaluation of Seismic Performance Based on A Direct
Displacement-based Method
Usman Wijaya
#,*, Roesdiman Soegiarso
#,
,Tavio
+#
Department of Civil Engineering, Universitas Tarumanagara, Jakarta, Indonesia Email: *[email protected]
+
Department of Civil Engineering, Institut Teknologi Sepuluh Nopember, Surabaya, Indonesia Email: [email protected]
Abstract— Commonly, in the design of the seismic-resistant building, the force-based method has been popularly adopted to
distribute the effect of earthquake forces to the building structure. This concept uses forces as an approach to simulate the impact of the earthquake on a building. To predict lateral forces of a building structure due to earthquake, Direct Displacement-Based Method (DDBM) can be introduced as an alternative solution. The performance level of a building structure can be categorized based on its damage level. In this paper, the performance-based evaluations were carried out according to ATC-40, FEMA 356, FEMA 440, and nonlinear time history analysis with seven ground motion (Denali, Imperial Valley, Kobe, Loma Prieta, Northridge, San Fernando, and Superstition Hills). The expected performances of the building structures were checked from the results obtained by the pushover time-history analyses compare to nonlinear time history analysis. The structural response parameters obtained from the force-based approach were found different from those obtained from the performance-based approach of the same building structures. The target displacements almost approach the results of DDBM. This means that the overall structure is in the category of performance criteria for Damage Control. The design level of performance is Life Safety, then the structure has not yet reached the target performance but approaching the design performance at a higher performance level. The actual structural response parameters obtained based on the DDBM were found slightly different from those stated in the ASCE 7-16. Therefore, the DDBM can be used as a promising alternative approach for the design engineers in evaluating the structural performance level of a building structure.
Keywords— DDBM; earthquake; pushover analysis; seismic; time history analysis.
I. INTRODUCTION
Commonly, in the design of the seismic-resistant building, the force-based method has been popularly adopted to distribute the effect of earthquake forces on the building structure. This concept uses forces as an approach to simulate the impact of the earthquake on a building. Therefore, it is expected that the construction might withstand the earthquake strikes and further avoid it from progressive collapse. The concept has currently shifted from providing sufficient strength to resist the seismic forces toward serving the performance rather than the strength. This is mainly due to the issue that the current force-based concept does not always satisfy the expected performance of the buildings due to the seismic impact. There are many ways to improve the performance of the buildings, and some of them are through the detailing for concrete members or the introduction of damping systems such as base isolators [1], [2]. Another way is to introduce the implementation of
performance-based design rather than the force-based design. The performance-based design emphasizes the performance of the building structures during an earthquake event.
Structural performance is a performance level of a certain structure toward a seismic design earthquake. The structure performance level can be obtained by observing the damage level of a particular structure when loaded by a seismic design earthquake in a specific return period. Therefore, the structure performance level is always related to the cost of reparation of the structure itself. Commonly, in the structural performance-based design, it considers both purposes and cost-effectiveness without neglecting the safety of the residence. The structural performance level is categorized according to its level of structural damage in which, in this paper, it adopts three different performance-based design references that are commonly used, namely ATC-40, FEMA 356, and FEMA 440 [3], [4], [5], [6], [7].
earthquake to the expected damage level in order to achieve the desired performance [8]. Fundamental factors that affect the ability of the lateral force restraint system are the mass of the building, the rigidity and configuration, the deformation capacity of the elements, and the strength and characteristic of the soil [9].
In the forced-based design, the calculations of design base shear are used in order to predict the forces as a result of an earthquake [10]. This design shear force and flexibility of the structure always link to each other. Meanwhile, in the performance-based design, to predict the design shear forces of the structure during the earthquake in order to achieve the expected structural performance, further calculation using the Direct Displacement Method might be necessary [11], [12].
II. MATERIAL AND METHOD
A. Material
In this study, the building data are as follows: 1. Building’s function : Apartment 2. Building’s total height : 43 m 3. Story height (1st) : 4.5 m 4. Story height (2nd to 12th) : 3.5 m 5. Total floor numbers : 12 stories
6. Location : Yogyakarta
7. Material : Reinforced concrete
8. Concrete grade ( fc′) : 35 MPa 9. Reinforcement grade ( f ) y : 420 MPa 10. Floor deck thickness : 12 cm 11. Rooftop deck thickness : 12 cm
12. Column (K1) : 60 × 60 cm
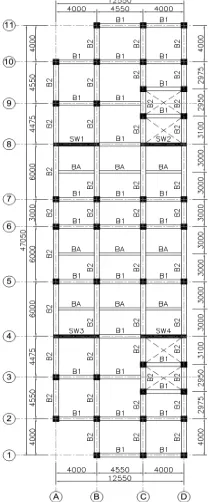
13. Primary beam (B1) X-direction : 40 × 60 cm 14. Primary beam (B2) Y-direction : 50 × 70 cm 15. Secondary beam (B3) : 25 × 35 cm 16. Shear wall thickness : 35 cm 17. The typical plan layout is illustrated in Figure 1.
Fig. 1. Typical plan layout of a twelve-story building considered
B. Direct displacement-based method (DDBM)
Earthquake forces can induce both the deformation and displacement of a building structure. The capability of a building structure to deform in the elastic response corresponds to the rigidity of the structural system. However, the correlation between these two might become complicated for structures during the inelastic response. Then, it is going to depend mainly on the displacement and also deformation during the seismic response [13], [14].
The Direct Displacement-Based Method (DDBM) appears to be a reliable alternative solution to the weaknesses of the Force-Based Method (FBM). The DDBM emphasizes a specific displacement value as a reference in order to determine the required structural strength due to the designed earthquake. The primary difference between FBM and DDBM is that in DDBM, the structure is created using a single degree of freedom (SDOF) represented by the performance of peak displacement response, not from the initial elastic characteristic.
1) Direct Displacement-Based Design (DDBD) concept for frame
The basic concept of the DDBD procedure is that the structure is designed using inelastic characteristics of the structure on a designed performance level rather than the first characteristic.
Displacement design for frame system depends on the inelastic mode shape and the height of each floor which can be illustrated as follows [14]:
− = n i n i H H H H 4 1 3 4
δ (1)
Displacement design in the MDOF level has to be converted into the SDOF system, where maximum displacement is an equivalent of movement in MDOF displacement level, which can be illustrated as follows [14]:
( )
(
)
= = ∆ ∆ = ∆ n i i i n i i i d m m 1 1 2(2)
The design displacement ductility can be explained as follows [14]: y d ∆ ∆ =
µ (3)
2) Equivalent viscous damping
The value of equivalent viscous damping of the SDOF system can be calculated as follows [14]:
− + = π µ µ ξ F F F 1 565 . 0 05 .
0 (4)
on the acceleration spectrum graph, a line was drawn to obtain the value of an expected acceleration value (∆d). Thus, the active period of the system can be purchased and illustrated in Figure 2.
Fig. 2. Design response spectrum and spectra displacement [14]
The practical stiffness value depends on the effective mass and productive period, calculated as follows [14]:
2 2 4 e e e T m
K = π (5)
After the effective stiffness system calculation, the design base shear could be calculated as follows [13]:
d e Base K
V = ×∆ (6)
3) DDBD Concept for Dual System
The proportion of base shear that acts on the frame and shear wall is determined as follows [13]:
Base F
F V
V =β
(7a)
(
F)
BaseW V
V = 1−β
(7b) The value of HCF varies depending on the capacity of the frame (VF) to resist the base shear towards the total base shear (VBase).
Fig. 3. The height of contra flexure wall based on the shear force proportion and the relative overturning moment [13]
From Figure 3, the value of the inflection wall, HCF depends on the value of the relative overturning moment and the low shear proportion that is able to be resisted by the frame.
In a reasonable condition, the shear wall should receive at least 50 percent of the total base shear that acts on the
building. In the case, ASCE 7-16 states that the frame should receive at least 25 percent of the base shear. In determining a design deformation profile, it is assumed that the ultimate strain of the frame does not reach the critical condition since the design deformation profile reaches the material strain or deformation limit at the plastic joint of the shear wall. The deformation reaches the maximum point at the contra flexure height (HCF) [9].
For Hi≤ HCF,
− = ∆ CF i i y yi H H H w 6 2 3 2
ϕ (8)
For Hi > HCF,
− = ∆ 6 2 2 CF i CF y yi H H H w
ϕ (9)
The yield curvature at the bottom of shear wall is calculated based on the type of shear wall or existing column of the structural system [13]. For square concrete wall can be calculated as follows:
W y y ε l
ϕ =2 (10)
In determining the design displacement profile for the MDOF system, consideration of function parameters of the structure is essential. This consideration is started by determining the design curvature of the shear wall. The design curvature the damage-control condition is determined based on the strength of the building structure which is designed against the acted loads as follows [13]:
W dc =0.072 l
ϕ (11)
The value of design curvature should be reduced by 10 percent [9]. The second step is to define the length of the plastic joint of the shear wall.
Equivalent viscous damping for the SDOF system depends on the displacement ductility of the designed structure. The dual system is a combination of frame and shear wall systems. Thus, both frame and shear wall systems have their own displacement ductility and equivalent viscous damping. The displacement ductility of the shear wall can be calculated by Equation (12), whereas for the equivalent viscous damping of the shear wall can be calculated using Equation (13) [13].
yW d W =∆ ∆
µ (12)
− + = π µ µ ξ W W W 1 444 . 0 05 .
0 (13)
The equivalent damping value for SDOF on a dual system can be calculated using equation (10) [15].
OTM F OTM W OTM eq M F M W
M ξ ξ
The value of base shear is distributed to each floor (Fi) by Equation (15) at the center of the building layout [13].
(
)
− ∆ ∆
+
= n
i i i i i Base i
i F V m m
F
1 9
.
0 (15)
III.RESULT AND DISCUSSION
The considered building is located in Yogyakarta, Indonesia. According to the Indonesian standard (SNI 1726:2012), Yogyakarta is located in a highly seismic zone. The building is sitting on the soft soil. The criteria for soft soil are shown in Table 1 [16].
TABLEI SITE CLASSIFICATION
Sites Class Vs (m/sec) N Su (kPa)
A-Hard Rock > 1500 N/A N/A
B-Rock 750 to 1500 N/A N/A C-Very dense soil and soft rock 350 to 750 > 50 > 100
D-Stiff soil 175 to 350 15 to 50 15 to 100 E-Soft soil < 175 < 15 < 50
According to SNI 1726:2012, the response spectrum of Yogyakarta for soft soil is shown in Figure 4.
0 0.1 0.2 0.3 0.4 0.5 0.6 0.7 0.8
0 0.5 1 1.5 2 2.5 3 3.5 4 4.5
Response Spectrum
Fig. 4. The response spectrum of Yogyakarta for soft soil [16]
Fig. 5a. Imperial valley ground motion (X-direction)
Seven scaled and unscaled ground motions were selected, as shown in Figures 5a to 11b and Table 2. In order to derive the magnitude influence on the spectral response shape, the magnitude was ranged from about 6.6 to 7.9 in the PEER ground motion database. The seven ground motions selected were based on the most fitted to the Yogyakarta response spectrum from the Indonesian standard SNI 1726:2012 [16].
Fig. 5b. Imperial valley ground motion (Y-direction)
Fig. 6a. Denali ground motion (X-direction)
Fig. 7a. Kobe ground motion (X-direction)
Fig. 7b. Kobe ground motion (Y-direction)
Fig. 8a. Loma Prieta ground motion (X-direction)
Fig. 8b. Loma Prieta ground motion (Y-direction)
Fig. 9a. Northridge ground motion (X-direction)
Fig. 9b. Northridge ground motion (Y-direction)
Fig. 10a. San Fernando ground motion (X-direction)
Fig. 11a. Superstition hills ground motion (X-direction)
Fig. 11b. Superstition hills ground motion (Y-direction)
TABLEII SELECTED GROUND MOTION
Earthquake Year Station Magnitude Direction
X Y
Denali 2002 TAPS Pump Station #10 7.9 12.97 12.42
Imperial
Valley 1940
El Centro Array
#9 6.95 1.34 1.68
Kobe 1995 Amagasaki 6.9 0.98 0.83
Loma Prieta 1989 Los
Gatos-Lexington Dam 6.93 0.71 0.74
Northridge 1994 Anaverde
Valley-City R 6.69 8.96 8.96 San
Fernando 1971 Pacoima 6.61 0.47 0.51 Superstition
Hills 1987
Superstition Mtn
Camera 6.84 0.99 0.63
According to ASCE 7-16, the period range of the target spectrum is 0.2T to 1.5T, as shown in Table 3 [3]. However, the comparison of the seven scaled- and unscaled-ground motions (GM) to the response spectrum (RS) of Yogyakarta is given in Figures 12 to 15.
TABLEIII SCALING RANGE
Period Range (0.2T - 1.5T)
T 1.505
0.2T 0.301
1.5T 2.265025
Fig. 12. Comparison of unscaled GM vs. RS in X-direction
Fig. 13. Comparison of unscaled GM vs. RS in Y-direction
Fig. 14. Comparison of scaled GM vs. RS in X-direction
Fig. 15. Comparison of scaled GM vs. RS in Y-direction
Fig. 16. Pushover analysis result in X-direction
Fig. 17. Pushover analysis result in Y-direction
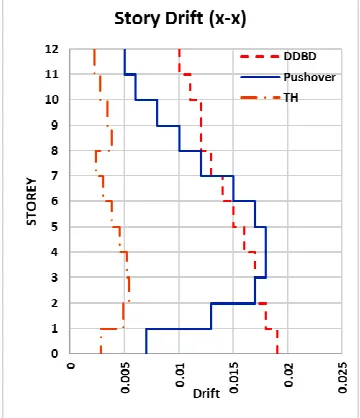
From Figures 18 and 19, it is known that displacement values for both X-direction (dual system) and Y-direction (frame system) from the pushover analysis have given the curves that are almost close to displacement damage index of the DDBD. Where this applies to the drift level, it is shown in Figures 20 and 21 that the required drifts larger than allowable drifts, respectively. However, starting from fourth to the top roof, the required drifts become smaller.
From Figures 18 and 19, it is known that displacements for both X- and Y-directions (frame and dual systems, respectively) are very close to the movements of the DDBD. However, from the fifth to the twelfth floor, the displacements are smaller than those of the DDBD due to the typical section and rebar. The required drifts indicated that they were much lower than the corresponding allowable drifts. The drift index from the third to twelfth floor reduced. The required drifts from pushover analysis are smaller than the permissible drift limits which means that each floor is still in the life safety performance level corresponding to the drift index.
In Figures 20 and 21, regarding typical section members, the required drifts from the pushover analysis of the first-third floor have more significant drifts. The first floor and the second floor to top roof heights are 4.50 m and 3.60 m, respectively. This configuration produces the soft story phenomenon on the first floor.
Comparing the pushover analysis with ATC-40, FEMA 356, and FEMA 440 and also time history analysis with the DDBD, it can be seen that for each method, the displacement value almost reaches performance value with the DDBD (Table 4). This means that the entire structure is on the damage control performance index. With the life safety index performance, the structure has not reached the expected performance but approaching the performance index at a higher level.
Regarding the typical section of the members, the required drifts obtained from the pushover analysis from the first to third floors are more massive compared to the upper story drifts, as shown in Table 4.
In the evaluation of seismic performance, the required drifts can be closer to allowable drifts, for example, to determine the performance of the existing building or retrofitting for a target seismic performance.
Fig. 18. Displacement comparison in X-direction
Fig. 19. Displacement comparison in Y-direction
response parameters. According to ATC-40, the structural performance index of the structure is the damage control (DO) SP-2. It is categorized in the transition between the immediate occupancy (IO) SP-1 and Life Safety (LS) SP-3. This means that the preliminary design with the DDBM can be a promising alternative design method in the future.
Fig. 20. Drift comparison in X-direction
Regarding regular buildings, the pushover analysis obtains better damage index performance than the time history analysis. Evaluation of seismic performance for ordinary buildings can use DDBM or pushover analysis. Both results are acceptable. For further research, a study on the seismic performance of irregular buildings using time history analysis is a fascinating topic.
Fig. 21. Drift comparison in Y-direction
TABLEIV
COMPARISONLEVELOFDAMAGEINDEX
IV.CONCLUSIONS
From the study, there are a few conclusions which can be drawn as follows: DDBM is the most effective method for seismic performance evaluation. Due to its performance in the category of Life Safety (LS), thereby, for seismic performance evaluation, the DDBM is a good alternative that can be used first if an engineer would like to recognize the performance of the structure. The target displacements almost approach the results of DDBM. This means that the overall structure is in the category of performance criteria for Damage Control. The design level of performance is Life Safety, then the structure has not yet reached the target performance but approaching the design performance at a higher performance level. Nonlinear static pushover analysis delivers seismic performance that is more accurate than nonlinear time history analysis, particularly for irregular buildings.
NOMENCLATURE H structure’s height
m mass
V base shear
Greek letters
β base shear ratio
Δ displacement
ɛ strain
ξ viscous damping
µ displacement ductility
Subscripts
F frame
i ith-floor
W wall
y yield
Direction Parameter DDBM Pushover Analysis Time History
Design ATC-40 FEMA 356 FEMA 440 Inelastic Drift
X-direction Displacement (m) 0.497 0.477 0.466 0.466 0.232
Actual Drift - 0.0111 0.0108 0.0108 0.0054
Performance Level Life Safety Damage Control Damage Control Damage Control Damage Control
Y-direction Displacement,(m) 0.4750 0.422 0.417 0.417 0.1892
Actual Drift - 0.0098 0.0097 0.0097 0.0044
Performance Level Life Safety Immediate Occupancy
Immediate Occupancy
Immediate Occupancy
ACKNOWLEDGMENT
The authors would like to acknowledge all the facilities gratefully and the supports received to make this research possible.
REFERENCES
[1] A. B. Habieb, G. Milani, Tavio, and F. Milani, “Low Cost Rubber Seismic Isolators for Masonry Housing in Developing Countries,”
AIP Conf. Proc., vol. 1906, no. 5, pp. 647–653, 2017.
[2] U. Wijaya, R. Soegiarso, and Tavio, “Seismic Performance Evaluation of a Base-Isolated Building,” Int. J. Civ. Eng. Technol., vol. 10, no. 1, pp. 285–296, 2019.
[3] American Society of Civil Engineers, “Minimum Design Loads and Associated Criteria for Buildings and Other Structures,”
ANSI/ASCE Stand., pp. 1–822, 2017.
[4] ATC-40, “Seismic Evaluation and Retrofit of Concrete Buildings,”
Appl. Technol. Counc. Redw. City, Calif., vol. 1, 1996.
[5] FEMA 356, “Prestandard and Commentary for the Seismic Rehabilitation of Buildings,” Fed. Emerg. Manag. Agency,
Washingt. DC, no. 1, pp. 1–518, 2000.
[6] FEMA 440, “Improvement of Nonlinear Static Seismic Analysis Procedures,” Fed. Emerg. Manag. Agency, Washingt. DC, vol. 440, no. June, p. 392, 2005.
[7] FEMA 451B, “NEHRP Recommended Provisions: Instructional Materials (FEMA 451B),” Fed. Emerg. Manag. Agency, Washingt.
DC, pp. 1–27, 2006.
[8] M. A. P. Handana, R. Karolina, and Steven, “Performance Evaluation of Existing Building Structure with Pushover Analysis,”
IOP Conf. Ser. Mater. Sci. Eng., vol. 309, no. 1, 2018.
[9] P. Moustafa, K. M. Zidan, T. Mohamed, and A. Rahman, “Seismic Analysis of Buildings Using Direct Displacement Based Design Method,” IOSR J. Mech. Civ. Eng., vol. 13, no. 6, pp. 97–112, 2016. [10] L. Rahul, “A Study on Pushover Analysis Using Eurocode Based
Capacity Spectrum Method,” 16th World Conf. Earthq. Eng., vol. 45, no. January, pp. 1–13, 2017.
[11] J. Carillo, G. Gonzales, and A. Rubiano, “Displacement Ductility for Seismic Design of RC Walls for Low-Rise Housing,” Lat. Am. J.
Solids Struct., vol. 11, no. 4, pp. 725–737, 2014.
[12] Y. Lu, I. Hajirasouliha, and A. M. Marshall, “Direct Displacement-Based Seismic Design of Flexible-Base Structures Subjected to Pulse-Like Ground Motions,” Eng. Struct., vol. 168, no. April 2017, pp. 276–289, 2018.
[13] T. J. Sullivan, M. J. N. Priestley, and G. M. Calvi, “Direct Displacement-Based Design of Frame-Wall Structures,” J. Earthq.
Eng., vol. 10, no. October 2014, pp. 91–124, 2006.
[14] M. J. N. Priestley, G. M. Calvi, and M. J. Kowalsky, “Displacement-Based Seismic Design of Structures,” IUSS Press, 2007.
[15] L. Yan and J. Gong, “Development of Displacement Profiles for Direct Displacement Based Seismic Design of Regular Reinforced Concrete Frame Structures,” Eng. Struct., vol. 190, no. October 2018, pp. 223–237, 2019.
[16] Badan Standardisasi Nasional, “SNI 1726:2012 Tata Cara Perencanaan Ketahanan Gempa untuk Struktur Bangunan Gedung dan Non Gedung,” BSN, pp. 1–138, 2012.
![Fig. 2. Design response spectrum and spectra displacement [14]](https://thumb-us.123doks.com/thumbv2/123dok_us/9971516.1985479/3.595.41.290.561.649/fig-design-response-spectrum-spectra-displacement.webp)