Vol.6 (2016) No. 6
ISSN: 2088-5334
Development of PHilMech Computer Vision System (CVS) for
Quality Analysis of Rice and Corn
Andres M. Tuates Jr
#, Aileen R. Ligisan
* #Philippine Center for Postharvest Development and Mechanization CLSU Compound, Science City of Muñoz, Nueva Ecija.3120. Philippines E-mail: [email protected]
Abstract— Manual analysis of rice and corn is done by visually inspecting each grain and classifying according to their respective categories. This method is subjective and tedious leading to errors in analysis. Computer vision could be used to analyze the quality of rice and corn by developing models that correlate shape and color features with various classification. The PhilMech low-cost computer vision system (CVS) was developed to analyze the quality of rice and corn. It is composed of an ordinary scanner as the image acquisition device and a computer with image-processing software. The performance of the CVS was compared to the traditional manual method being adopted by the National Food Authority (NFA) and the Agricultural Machinery Testing and Evaluation Center (AMTEC). The performance testing and evaluation showed that the accuracy of obtaining the results in classifying rice and corn using the CVS was comparable to the manual method of analysis. But, the processing time to complete the analysis using the CVS technology (6-7 minutes) was 5-8 times faster compared to the manual method (30-60 minutes). The developed CVS will automate the existing practice in determining the milling quality of brown rice, milled rice, and yellow corn and minimize the tedious and subjective manual method of evaluation.
Keywords— computer vision system; probabilistic neural network; human inspection; accuracy; repeatability
I. INTRODUCTION
Annually, the Philippine government, through the National Food Authority imports an average of twenty cargos containing 600,000 metric tons of milled rice to supply the country’s rice deficit. Out of the yearly imports, around 27 million rice kernels undergo laboratory analysis. As a reference in determining good quality grains, the Philippine Grain Standards (PGS) set the limits of not exceeding 5%, 0.5%, 4%, 0.2% and 0.5% for broken grains, discolored grains, chalky grains, immature grains and damaged grains, respectively [1]. Likewise, moldy kernels of 0.1% for Grade 3 to premium corn grain intended for food was adopted to meet the international standards for grains [2]. The cost of manual analysis for each quality parameter is P50.00, while complete analysis for all the parameters is P400.00 [3]. The manual process takes 30-60 minutes per sample depending on the skills of the classifier, physical condition of the samples and working environment.
As part of the country’s regulatory system, physical evaluation of milled rice obtained from imported rice hullers and mills is also being carried out by the Agricultural and Mechanization Testing and Evaluation Center (AMTEC). The center reported that manual method of analysis for brown rice and milled rice takes one hour to complete the procedures prescribed in the Philippine Agricultural
Engineering Standards (PAES). Observations revealed that manual method of analysis is subjective, tedious, expensive and prone to errors.
To address the above-mentioned limitations in conducting a physical analysis of grains, PhilMech has developed a low-cost computer vision system (CVS) that can be used to analyze the different quality parameters of yellow corn, brown and milled rice [4] & [5]. The CVS uses an ordinary flatbed scanner as the image acquisition devise. By applying a computer model, the acquired image is processed to extract shape and color features, which can correlate at varying classifications of grain samples. The CVS can predict the standard quality parameters of brown rice, milled rice and corn in less than 10 minutes with high accuracy and repeatability. The CVS method of analysis is rapid, cost effective and more efficient than the manual method. But, despite the many advantages of using the CVS, the technology still needs to be validated in terms of technical benefits under actual operation prior to its commercialization. Hence, this study.
II. MATERIALS AND METHOD
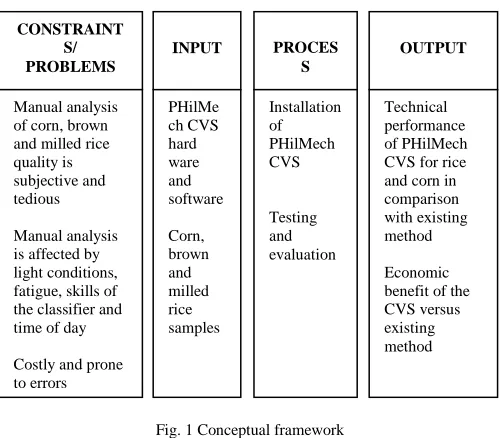
fatigue, skills of the classifier and time of day. Integration of PHilMech CVS on the actual operation of NFA and AMTEC on the quality analysis served as input. Likewise, the conduct of training on the operators and testing and evaluation was the process applied. The PHilMech CVS was installed at the testing sites. The expected output was the tested PHilMech CVS and its economic benefits.
Fig. 1 Conceptual framework
A. Development of An Integrated PHilMech Computer Vision System (CVS) for Rice and Corn
The existing PHilMech CVS designed for milled rice, brown rice, and yellow corn were integrated into a single system to maximize its utilization and reduce the cost of investment. The integrated CVS is comprised of a background segmentation, extraction of features, color and size classifications algorithms. The system design is modular with digital separation, print-out reports, and export file features to reduce the processing time in generating reports. The CVS is composed of a standard flatbed scanner connected to a PC or Laptop running at least Windows XP and uses the standard WIA software drivers. The inside surface of the flatbed cover was painted with a black color to absorb reflections during scanning and preserve the color information of grain samples. Upon acquisition of data, the image was stored as a 24-bit color bitmap with a resolution of 300 dots per inch (dpi). Image acquisition and analysis of samples were executed through the developed image processing software.
The acquired rice and corn images, which were saved in the hard disk had undergone the following processing steps in order to come up with the desired grain classifications:
• The background color of the scanned images was removed through the background segmentation process.
• Digital separation of touching grains was employed. • The color blob extraction algorithm was developed to
enable extraction of segmented blobs from the original image. The color blob extraction algorithm was made to allow extracting the color properties of each segmented kernel.
• Digital morphology was performed mathematically on a binary image including image filtering and geometric analysis such as Geometric measurements measured perimeter, area, circularity, ferret diameter and other related geometric measurements.
• Each samples image of grains was counted and labeled to obtain the total number of kernels.
• The shape and color features of the samples were processed to obtain the classification of each image into each quality group.
• Finally, the resulting classifications of rice and corn were summarized and used to draw the quality evaluation based on the limits specified by the Philippine Grain Quality Standards.
• The classification was computed by combining the weight prediction model and the probabilistic neural network (PNN) using 24 color features extracted from each grain image as input.
B. Testing Sites
The testing and evaluation of the PHilMech CVS were conducted at the National Food Authority (NFA) in Quezon City, and the Agricultural Machinery Testing and Evaluation Center (AMTEC) in UPLB, Laguna.
The National Food Authority is a government corporation which provides the needed services to the grains marketing industry in the country. By virtue of Presidential Decree # 4 and RA 7394 (consumer Act of the Philippines), NFA is mandated to establish and enforce the national grains standards in collaboration with various sectors. On the other hand, the Agricultural Machinery Testing and Evaluation Center (AMTEC) was established in 1977 to serve as an official testing agency to promote a self-reliant agricultural machinery industry that would cater to the needs of the Filipino farmers. Specifically, the AMTEC serves as the national center that will test and evaluate the performance of agricultural and fishery machinery for the benefit of Filipino farmers and fisher folks.
C. Performance Testing and Evaluation
1) NFA Manual Method: The quality analysis for milled
rice follows the NFA standard test procedure [1]. A predetermined amount of milled rice was collected and then mixed. Three hundred grams (300 g) from the mixed samples were divided into three equal parts. The first part (100 g) was used for the determination of moisture content and impurities of the samples, while the second and third parts of 100 g each were used for the analysis of head rice/brokens (e.g. brewers, big brokens and head rice) and different quality parameters for milled rice (e.g. chalky, damaged, discolored, immature, and red kernels), respectively.
The test method used for corn grains also followed the NFA test standard. Five hundred (500 grams) of mixed corn grains was used for the determination of different quality parameters such as foreign matters, other colors, shrivelled and immature grains, damaged and moldy grains.
2) AMTEC/PAES Manual Method: The physical analysis
described in PAES [6] was followed during the testing and evaluation conducted at AMTEC. Five hundred grams (500 g) of cleaned palay samples was used to measure the CONSTRAINT
S/ PROBLEMS
INPUT PROCES
S
OUTPUT
Manual analysis of corn, brown and milled rice quality is subjective and tedious
Manual analysis is affected by light conditions, fatigue, skills of the classifier and time of day
impurities. Out of this samples, two hundred grams (200 g) was set aside for hulling, 3x100 whole kernels for crack determination, 3x1000 whole kernels for the weight of 1000 grains, and the remaining samples were used for moisture content determination. Percentage by weight of defective kernels (e.g. damaged, chalky, other varieties, yellow, and red rice) was determined from a 20-gram brown rice sample after hulling. Head rice, broken rice, brewers rice, the weight of 1000 grains, and whiteness was determined from a 100 gram milled rice sample.
3) CVS Method: The PHilMech CVS was set-up at the
NFA and AMTEC for the analysis of rice and corn. The CVS was operated and managed by PHilMech in close coordination with the authorized research personnel of the two agencies. The results of analysis using the CVS were compared with the manual methods to evaluate the performance of the CVS digital separation, grain size, color classification and processing time.
4) Digital Separation: Digital separation was aided by a
grain template with perforations patterned based on shapes of milled rice, brown rice and yellow corn to partially separate the grains. The template helps in reducing excessive touching and overlapping of the grain samples during loading on the scanner glass surface. The grains were poured on the surface of the perforated template and spread them by using a paint brush until all the perforations are individually filled up with grains. The loaded template was then lifted leaving the grains on the glass surface intact. During image processing, the touching grains were digitally separated using the combination of path splitting and watershed methods. If the grain blobs were identified as touching, the concavities were identified. If two concavities are identified, the line between the two centers of the concavities was drawn but if the number of concavities is greater than two, the watershed segmentation was applied. The watershed method translates a grayscale image into a three-dimensional surface with grayscale values serving as the height of each pixel.
5) Grain Size Classification: The classification for grain
sizes e.g. head rice, broken rice, and brewers were based on the PGS [11] as follows:
• Short grain – rice with 80% or more of the whole milled rice kernels having a length of less than 5.5 mm
• Medium grain - rice with 80% or more of whole milled rice kernels having a length of 5.5 to 6.3 mm. • Long grain – rice with 80% or more of whole milled
rice kernels having a length of 6.4 to 7.4 mm.
• Very long grain - rice with 80% or more of whole milled rice kernels having a length of 7.5 mm and above.
• Head rice – pieces of kernels with ¾ or more of the average length of the unbroken kernel.
• Broken kernels – Pieces of kernels smaller than ¾ of the average length of the unbroken kernel
• Brewers – Small pieces or particles of kernels that pass through a sieve having round perforations 1.4
mm in diameter. This is also known as “binlid” or chips.
The length measurement of the grain sample was based on the longest axis extracted from projected grain blobs digitally separated from previous steps.
6) Grain Color Classification: A Probabilistic Neural
Network (PNN) Architecture Model was employed to model the classification of rice and corn into the defined classes such as damaged, chalky/immature, moldy, discolored, red kernels, other color, and paddy. It is based on the Bayesian strategy for pattern recognition, which postulates that a decision rule to classify patterns should minimize “expected risk” of misclassification. Training patterns determine the window positions and responses so that new inputs will generate a response that is similar to the response generated by the training data that they resemble [7]. As with other pattern recognition techniques, PNNs require that training data be available from the entire solution space domain [8].
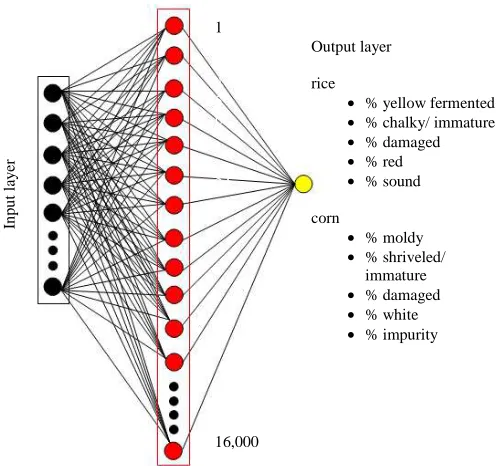
The PNN Architecture Model architecture comprised of 24-node input, 1 hidden layer of around 16,000 nodes, and an output layer with a single node (Fig. 2). The PNN analysis was used for both the training and validation datasets to establish the classification models. The datasets were randomly sampled as 75% for training, 20% for calibration, and 5% for testing the accuracy of the classifier. Training was automatically stopped after 20 models have been generated with no improvement of 1% in the ANN model was obtained.
Fig. 2 A probabilistic neural network architecture
The grain color features including basic statistics from the RGB and CIE L*a*b color components (e.g. statistical range, mean, standard deviation, and median) were extracted and summarized in Table 1.
Output layer
rice
• % yellow fermented • % chalky/ immature • % damaged • % red • % sound
corn
• % moldy • % shriveled/
immature • % damaged • % white • % impurity
In
p
u
t
la
y
er
1 2 3 4 5 6
24
TABLEI
COLOR FEATURES EXTRACTED FROM EACH RICE AND CORN IMAGE
RedRange GreenRange BlueRange LRange aRange bRange
RedMean GreenMean BlueMean LMean aMean bMean
RedStdDev GreenStdDev BlueStdDev LStdDev aStdDev bStdDev
RedMedian GreenMedian BlueMedian LMedian aMedian bMedian
RedRange GreenRange BlueRange LRange aRange bRange
Redmean GreenMean BlueMean LMean aMean bMean
III.RESULTS AND DISCUSSION
A. Description of PHilMech Computer Vision System
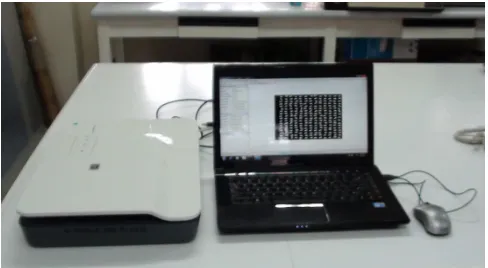
Fig. 3 shows the HP scanjet (G3110) flatbed scanner with a charged-coupled device (CCD) scanning element coupled to a laptop computer. The image acquisition device was complimented by a laptop (Intel Core i3, 2.0 GHz, 2 GB RAM, 320 GB HDD) computer. The interface connection for the scanner and the camera to the computer was made using universal serial bus (USB 2.0) port.
Fig. 3 An HP scanjet (G3110) flatbed scanner coupled with a laptop computer
Fig. 4 shows the graphical user interface (GUI) of the PHilMech Grain Quality Evaluation Software for rice and corn. The GUI shows the acquired image and grade of the grain samples based on the Philippine Grain Quality Standard classification results in terms of size and color. The CVS software has a menu window for changing the settings such as the threshold values for background segmentation (Fig. 5 & Fig. 6). The selection of models to be used for classification can also be accessed and upgraded (Fig. 7).
Fig. 4 Graphical user interface (GUI) of the PHilMech Quality Evaluation Software
Fig. 5 Menu showing some options for changing the settings of the CVS software
Fig. 6 Menu showing the digital separation
Fig. 7 Menu for selecting models for classification of current image
B. Performance Testing and Evaluation of CVS
1) Digital Separation: Grain separation was necessary to
was employed in this study using the combination of path splitting and watershed method. The grain image was then separated into individual blobs prior to feature extraction.
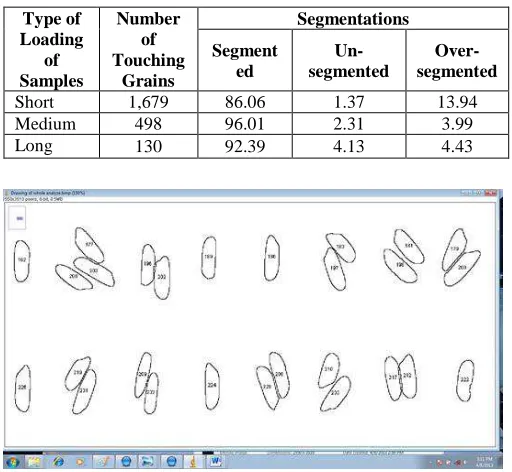
Tables 2 and 3 show the performances of digital separation for rice and corn. Digital separation tests showed that the number of touching grains was generally affected by the type of loading and the size of the grains. The number of touching grains during bulk loading was more than 2-fold higher than loading of samples using a grain template. It was also found out that the number of touching grains for short grain samples was 3-fold and 12 times higher compared to the medium and long grain samples, respectively. These values are important in optimizing the processing time during digital separation, because the higher the number of touching grains, the longer the processing time in grain segmentation. However, the type of loading of samples and size of grains except for small size grains does not affect the performance of digital separation. The low percent of digital separation in small size grains was affected by the overlapping of grains during loading because of its small size. Fig. 8 and Fig. 9 showed the digitally separated rice and corn grains, respectively.
TABLEII
SUMMARY OF THE DIGITAL SEPARATION PERFORMANCE IN DIFFERENT
TYPE OF LOADING OF SAMPLES USING CORN GRAINS (%)
Type of Loading
of Samples
Number of Touching
Grains
Segmentations
Segmented Un-segmented
Over-segmente
d
Bulk 190 98.42 1.00 1.00
Aided with grain template
91 98.90 1.57 1.57
TABLEIII
SUMMARY OF THE DIGITAL SEPARATION PERFORMANCE USING SMALL,
MEDIUM AND LONG GRAIN (%)
Type of Loading
of Samples
Number of Touching
Grains
Segmentations
Segment ed
Un-segmented
Over-segmented
Short 1,679 86.06 1.37 13.94
Medium 498 96.01 2.31 3.99
Long 130 92.39 4.13 4.43
Fig. 8 Digitally separated rice grain samples
Fig. 9 Digitally separated corn grain samples
2) Grain Size Classification: Tables 4 and 5 show the
actual percentage by weight of head rice, broken rice sound corn grains, and its defectives and their predicted value generated using the PHilMech developed CVS. The means of predicted percent by weight of test samples were almost similar to its actual weight.
The analysis of variance revealed that there is no significant difference on the samples classified by the NFA classifier and the computer vision system but the processing time of CVS was significantly lower (7 min) compared to the manual method (30-60 min). Likewise, the CVS method of measurement was more objective than the manual method.
TABLEIV
THE ACTUAL PERCENTAGE BY WEIGHT OF HEAD RICE,BROKEN AND
BREWER RICE SAMPLES AND ITS PREDICTED VALUE GENERATED USING
THE PHILMECH DEVELOPED CVSTHE ACTUAL PERCENTAGE BY WEIGHT OF
SOUND,DAMAGED,IMMATURE AND WHITE AND ITS PREDICTED VALUE
GENERATED USING THE PHILMECH DEVELOPED CVS (CORN)
Variety Head Rice Broken Rice
Manual CVS Manual CVS
mr-0342-12-0 67.63 67.86 32.28 32.04
mr-0345-12-0 48.04 50.83 52.52 50.83
mr-0376-12-0 44.97 44.34 55.12 54.76
mr-0378-12-0 35.82 37.14 64.46 60.92
mr-0382-12-0 53.48 53.40 46.60 46.29
mr-0383-12-0 49.73 48.28 50.27 51.01
mr-0387-12-0 54.42 56.08 45.62 43.51
mr-0518-12-0 51.33 53.67 48.50 44.90
mr-0519-12-0 58.92 61.36 41.05 38.14
mr-0520-12-0 51.44 53.45 48.45 44.83
mr-0524-12-0 62.03 63.85 37.79 35.13
mr-0525-12-0 63.70 65.39 36.22 33.70
mr-0526-12-1 58.09 60.95 41.77 38.03
mr-0527-12-0 53.03 55.31 46.22 40.10
mr-0528-12-0 61.83 64.63 37.99 34.04
mr-0532-12-0 59.19 61.29 40.56 37.41
mr-0533-12-0 62.52 66.03 37.17 32.26
mr-0621-12-T 78.51 80.02 21.62 19.98
mr-0628-12-T 87.05 88.51 12.93 11.49
TABLEV
THE ACTUAL PERCENTAGE BY WEIGHT OF SOUND,DAMAGED,IMMATURE
AND WHITE AND ITS PREDICTED VALUE GENERATED USING THE
PHILMECH DEVELOPED CVS (CORN)
Corn Parame-ters
Test Samples
Ave
1 2 3 4 5 6 7
Sound Predicted
Weight 86.7 90.7 92.1 87.6 84.8 91. 7
92. 1 89.4 Actual
Weight 89.9 84.9 95.3 85.0 82.2 87. 1
92. 0 88.0 Damaged
Predicted
Weight 10.4 4.0 4.0 2.1 8.7 3.9 4.1 5.3 Actual
Weight 6.7 9.7 2.3 9.4 9.4 8.4 3.7 7.1 Immature
Predicted
Weight 1.2 2.3 2.0 8.2 4.0 2.8 2.3 3.3 Actual
Weight 1.7 2.0 0.9 3.6 4.9 2.5 1.7 2.5 White
Predicted
Weight 1.7 3.1 1.8 2.2 2.5 1.7 1.5 2.1 Actual
Weight 1.7 3.4 1.5 2.0 3.6 2.0 2.6 2.4
3) Grain Color Classification: The accuracy of the
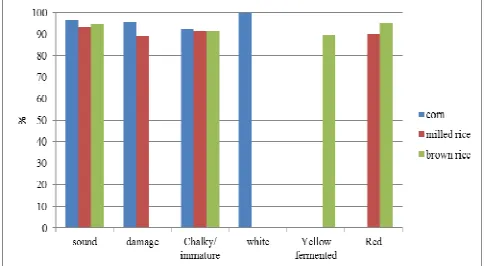
computer vision system was a measure of the efficiency of the set-up to classify the brown rice, milled rice and yellow samples according to their respective classifications. The average accuracy of CVS in classifying yellow corn, milled rice and brown rice for their respective color categories are above 90% (Fig. 10). The low accuracy level obtained by CVS in milled rice classification was due to the similarity in color of the grain parameter.
Fig. 10 Accuracy of CVS in classifying yellow corn, milled rice, and brown rice according to their respective color categories
4) Processing time: Table 6 shows the performance of
CVS in classifying rice and corn sample. It was 5-8 times faster compared to the manual method (30-60 minutes). The slow processing time in manual method was attributed to the inherent limitations of the classifiers to easily distinguish similar color of grain samples. Also, the working conditions and level of skills of the classifier contributed to low performance.
TABLEVI
THE ACTUAL PERCENTAGE BY WEIGHT OF SOUND,DAMAGED,IMMATURE
AND WHITE AND ITS PREDICTED VALUE GENERATED USING THE
PHILMECH DEVELOPED CVS (CORN)
ACTIVITIES
TIME Brown
Rice
Milled Rice
Yellow Corn
Loading < 3 < 3 < 2
Acquisition < 1 < 1 < 1
Digital separation < 1 < 1 < 1
Classification < 1 < 1 < 1
Unloading < 1 < 1 < 1
Total < 7 < 7 < 6
C. Economic Benefits and Technology Acceptability of Using The CVS
The investment cost for acquiring the PHilMech CVS for rice and corn is estimated at P200,000. The system is consists of an ordinary flatbed scanner (P10,000, a personal computer (P30,000) and the CVS computer software (P150,000). This cost of CVS software is much cheaper compared to the commercially available similar customized software (P 0.5 to 2 million).
By pursuing the commercialization of the PHilMech CVS, concerned government and private institutions, particularly the NFA and AMTEC will benefit in reducing their backlogs for quality analysis of rice and corn during peak procurement operations (NFA) and evaluation of postharvest machinery (AMTEC). Also, the utilization of the CVS will minimize the variability of results during analysis due to some limiting factors such as bias of the classifier, human fatigue, working conditions, and time constraints. The reliable and accurate performance of the CVS will earn more confidence from the clients (farmers and buyers). Moreover, grains classifiers can perform other more productive tasks.
IV.CONCLUSIONS
The accuracy of the CVS in classifying rice and corn was comparable to the manual method of analysis. But, the main advantage of using the CVS is its ability to generate results in a very short period of time. The processing time to complete the analysis using the CVS technology (6-7 minutes) was 5-8 times faster compared to the manual method (30-60 minutes).
The developed CVS will automate the existing practice in determining the milling quality of brown rice, milled rice, and yellow corn and minimize the tedious and subjective manual method of evaluation.
ACKNOWLEDGMENT
We would like to thank AMTEC and NFA for allowing the project team to use their laboratory, equipment, and instruments.
REFERENCES
[1] National Food Authority (NFA). 2002. Primer on the Philippine Grains Standardization Program. Quezon City, Philippines. [2] Bureau of Agriculture and Fisheries Standards. 2004. Department of
Agriculture. Philippines.
[4] Bulaong M.C. and Madamba P.S. 2007. Determination of weight percentage moldy corn kernels from bulk samples using flatbed scanner. In: Philippine Agricultural Mechanization Bulletin. Vol. XIV No.1:20-29
[5] Bulaong M.C., Agustin O.C. and Tuates Jr A.M. 2011. Quality analysis of milled rice using computer vision. Terminal report. Philippine Center for Postharvest Development and Mechanization, Science City of Munoz, Nueva Ecija, Philippines.
[6] Philippine Agricultural Engineering Standards. 2001. Vol. 1. Agricultural Machinery Testing and Evaluation Center, College of Engineering and Agro-Industrial Technology, University of the Philippines, Los Banos, Laguna, Philippines.
[7] Hush D.R. and Horne B.G. 1993. Progress in supervised neural networks, what’s new since Lippmann. IEEE Signal Processing Magazine 10(1): 8–39.
[8] Steenhoek L.W., Misra M.K., Hurburgh Jr. C.R. & Bern C.J. 2001a. Implementing a computer vision system for corn kernel damage. Applied Engineering in Agriculture. 17(2): 235–240.
[9] Brosnan T., and Sun D.W. 2004. Improving quality inspection of food products by computer vision––a review. Journal of Food Engineering. 61 (2004) 3–16.
[10] Tuates Jr. A.M., Bulaong M.C., and Ligisan A.R. 2012. Development of Computer Vision System for Brown Rice Quality Analysis. Terminal report. Philippine Center for Postharvest Development and Mechanization, Science City of Munoz, Nueva Ecija, Philippines. [11] Neuroshell 2 Release 4 Artificial Neural Network by Ward Systems
Group Inc., Executive Park, West 5 Hilcrest Drive, Frederick MD, USA. Retrieved from: www.wardsystems.com.
[12] Majumdar S., and Jayas D. S. 2000a. Classification of cereal grains using machine vision: I. Morphology models. Transactions of the ASAE, 43(6), 1669–1675.
[13] Birla R. and Chauhan A.P.S. 2015. An Efficient Method for Quality Analysis of Rice Using Machine Vision System. Journal of Advances in Information Technology Vol. 6, No. 3.
[14] Grinbergs H. 2016. Production Quality Decision Support Using Real-time Computer Vision Framework. Engineering for Rural Development.
[15] Majumdar S., and Jayas D. S. 2000d. Classification of cereal grains using machine vision: IV. Combined morphology, color, and texture models. Transactions of the ASAE, 43(6), 1689–1694.
[16] Lurstwut B. and Pornpanomchai C. 2016. Application of Image Processing and Computer Vision on Rice Seed Germination Analysis. International Journal of Applied Engineering Research ISSN 0973-4562 Volume 11, Number 9 (2016) pp 6800-6807.
[17] Paliwal J., Borhan M.S., and Jayas D.S. 2003. Classification of cereal grains using a flatbed scanner. In 2003 ASAE Annual International Meeting, Paper No. 036103. St. Joseph, Michigan, USA: ASAE.
[18] Arakeria M.P., Lakshmanab. 2016. Computer Vision Based Fruit Grading System for Quality Evaluation of Tomato in Agriculture industry. 7th International Conference on Communication, Computing and Virtualization
[19] Roush W.B., Cravener T.L., Kochera Kirby Y. and Wideman JR. R.F. 1997. Probabilistic Neural Network Prediction of Ascites in Broilers Based on Minimally Invasive Physiological Factors. Department of Poultry Science, Pennsylvania State University, University Park, Pennsylvania, and Department of Poultry Science, University of Arkansas, Fayetteville, Arkansas.
[20] Shahin M., Symons S. and Meng A.. 2004. Seed sizing with image analysis. ASAE Meeting Paper No. 043121. St. Joseph, Mich.: ASAE
[21] Swapnil S.P., Dale M.P. 2016. Computer Vision Based Fruit Detection and Sorting System. Special Issue on International Journal of Electrical, Electronics and Computer Systems, ISSN (Print): 2347-2820 V-4 I-2 For 3rd National Conference on Advancements in Communication, Computing and Electronics Technology [ACCET-2016] held at M. E. S. College of Engineering, Pune.
[22] Tarlak F., Dzdemir M., Melikdglu M. 2016. Computer vision system approach in colour measurements of foods: Part II. Validation of methodology with real foods. Food Science and Technology. [23] Test Data Bulletin for Rice Mill. 2004. Agricultural Machinery